Another Strong Start to the Week!Gold opened the week on a positive note without a significant pullback, rebounding quickly after touching a low of 3013. The overall price action remains range-bound with a bullish bias, though gold is still trading within the lower to middle Bollinger Bands. A clearer upside move may emerge once the correction phase concludes.
In the short term, resistance remains at the 3030-3040 zone. If this level holds, short positions can be considered. On the downside, key support levels to watch are 3012 and 3005, with the 3005-3000 range offering a potential buying opportunity.
Trading Strategy:
- Sell near 3030-3040resistance if it remains intact.
- Buy around the 3005-3000 support zone.
- Adopt a range-trading approach, focusing on shorting near resistance and buying near support.
I have always been glad that I can stick to my original intention. I can be dedicated to every friend who proposes cooperation. I will use my professional strength to help you make profits, recover your capital, and increase your funds. My reputation depends entirely on the publicity of customers. My strength has been honed in actual combat for a long time. Even if the road ahead is bumpy, as long as you give us trust, we will do our best to guide you and use your funds to the maximum effective limit, so that you can experience the feeling of profit in the ups and downs of the market! If you don’t know when to enter the market, you can pay attention to my 🌐 signal. I will release specific signals in real time. Remember to pay attention to the 🌐 signal in time.
Xauusdupdates

XAU/USD 24 March 2025 Intraday AnalysisH4 Analysis:
-> Swing: Bullish.
-> Internal: Bullish.
Bias and analysis remains the same as analysis dated 23 March 2025.
Price has printed a bearish CHoCH following printing further all time highs.
Price is now trading within an established internal range. I will however continue to monitor price.
Intraday Expectation:
Price to trade down to either discount of internal 50% EQ, or nested Daily and H4 demand levels before targeting weak internal high priced at 3,057.590.
Note:
With the Federal Reserve's dovish stance and persisting geopolitical uncertainties, heightened volatility in Gold is expected to continue. Traders should proceed with caution and adjust risk management strategies in this high-volatility environment.
Price could also be driven by President Trump's policies, geopolitical moves and economic decisions which are sparking uncertainty.
H4 Chart:
M15 Analysis:
-> Swing: Bullish.
-> Internal: Bearish.
As per analysis dated 19 March 2025 whereby I mentioned as an alternative scenario that internal range has significantly narrowed. All HTF's require a pullback, therefore, it would be completely viable if price printed a bearish iBOS.
This is how price printed, by printing a bearish iBOS.
Price has yet to print a bullish CHoCH to indicate bullish pullback phase initiation, however, price has traded into premium of 50% internal EQ, therefore, I am happy to confirm internal range.
Intraday Expectation:
Price has traded in to premium of 50% EQ and has mitigated M15 supply zone.
Technically, price to target weak internal low priced at 2,999.465.
Note:
With the Federal Reserve maintaining a dovish stance and ongoing geopolitical tensions, volatility in Gold prices is expected to remain elevated. Traders should exercise caution, adjust risk management strategies, and stay prepared for potential price whipsaws in this high-volatility environment.
M15 Chart:

Go short first, then go long, and grasp the rhythmGold overall rose and fell last week. After three consecutive positive weekly lines, the upper shadow line was closed. On Friday, it walked out of the adjustment space. The short-term rise slowed down slightly, and it was more inclined to fluctuate at a high level. The daily line turned negative and retreated to correct, and it was in a partial adjustment stage. In the 4H cycle, it did not stabilize above the 3047-57 mark mentioned earlier, so it walked out of the second downward exploration space, but combined with the intact structure of the three-month rising channel, the current retracement is more inclined to technical correction rather than trend reversal. From a spatial point of view, the 3030 line as the midpoint of the channel constitutes the primary resistance. If this position cannot be effectively broken through, the gold price may test the support of the 3000 integer mark downward. It is worth noting that the static resistance formed near 3050 resonates with the recent fundamental negatives, further suppressing the upward space.
The current strategy needs to focus on whether the 3026 opening high can be recovered in the oscillation range. If it stabilizes, it will be seen to 3035 last week's opening point; on the contrary, if it falls below the 3010 short-term moving average support, the shorts can follow the trend to the expected 3000 mark. It is recommended to adopt the range trading mode, and operate back and forth between high and low in the range of 3000-3035. Technically, we need to be alert to the stagflation signal formed by the continuous shortening of MACD and the closing of Bollinger Bands. It is recommended to avoid chasing highs and focus on the impact of US CPI data on the market.
Gold operation advice: Go short after rebounding around 3030-3040. Go long after stepping back to 3010-3000.If you don’t know when to enter the market, you can follow me. I will release specific signals in real time. Remember to pay attention in time.

Gold shock adjustmentDuring the decline of gold price on Friday, the high point was moving downward and the low point was also moving in steps. Let's see whether the decline here is caused by the selling behavior of long orders at high positions or the peak of gold price. We will follow the trend to implement the high-altitude strategy to be bearish. The main focus below is the support of Friday's low of 3000, followed by the conversion position of the previous high of 2954; as for resistance, we must first pay attention to the last high point of the rebound during the decline of 3038, followed by 3046 and 3057. On the whole, if the opening price touches 3038 above, we can go short and look at the downward trend; if the opening price touches the integer mark of 3000 below, we can go long and look at the rebound.

XAUUSD Analysis todayHello traders, this is a complete multiple timeframe analysis of this pair. We see could find significant trading opportunities as per analysis upon price action confirmation we may take this trade. Smash the like button if you find value in this analysis and drop a comment if you have any questions or let me know which pair to cover in my next analysis.

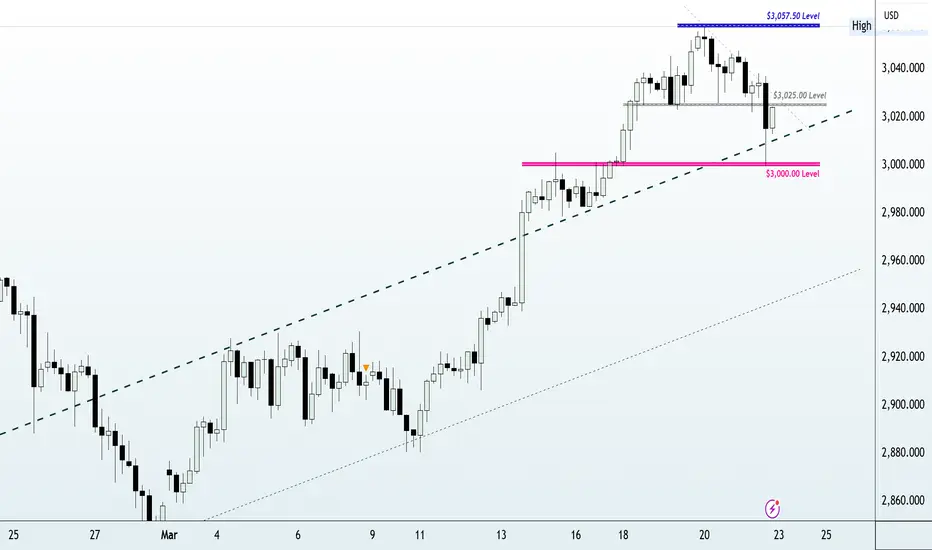
GOLD Price Analysis: Key Insights for Next Week Trading Decision🚀 XAUUSD Key Update & Market Outlook
Gold continues to hold a bullish trend, but price action has pulled back after setting a new record high. The key $3,000 level will play a significant role in guiding our trading decisions next week. A hold above this zone could fuel further bullish momentum, while a breakdown could trigger strong bearish moves.
📌 Major Market Drivers:
🔹 US Dollar Strength: Gold retreated as the USD gained traction, with traders booking profits ahead of the weekend.
🔹 Trump's Trade Policies: Uncertainty surrounding new tariffs remains a key influence on market sentiment.
🔹 Federal Reserve’s Stance: Powell & Fed officials maintain that rate cuts aren’t urgent, reinforcing the current restrictive policy.
🔹 Market Sentiment & Early-Week Price Action: We’ll be closely watching how price behaves around the $3,025 zone for potential trading signals.
📅 Key Economic Events Next Week:
🗓️ Tuesday: US S&P Global PMI Publications – Key insight into economic activity and inflation pressures.
🗓️ Thursday: US GDP (Q4 Final) – A crucial report on economic growth that could impact USD and Gold.
🗓️ Friday: US Core PCE Index – The Fed’s preferred inflation gauge, highly significant for rate expectations.
We’ll break all of this down in detail during tomorrow’s Forex Morning Mastery livestream. Stay tuned, and let’s get ready for the new trading week! 🔥📊 #XAUUSD #Gold #Forex #MarketOutlook
Is Gold Ready to Drop? Key Levels & Strategy for the Next Move!📉🔥 Right now, XAUUSD (Gold) is pulling back from the highs and consolidating in a range. I'm watching for a buy opportunity if price breaks below the current range low and retraces into the previous swing equilibrium.
🎯 In the video, we dive into imbalances as key pullback targets, analyze price action and market structure, and discuss a potential trade setup—if the market presents the right conditions.
🚨 Not financial advice—trade smart! 🚀

Gold may Retest its All Time High once againHello Traders
In This Chart GOLD HOURLY Forex Forecast By FOREX PLANET
today Gold analysis 👆
🟢This Chart includes_ (GOLD market update)
🟢What is The Next Opportunity on GOLD Market
🟢how to Enter to the Valid Entry With Assurance Profit
This CHART is For Trader's that Want to Improve Their Technical Analysis Skills and Their Trading By Understanding How To Analyze The Market Using Multiple Timeframes and Understanding The Bigger Picture on the Charts

Potential Gold price decline in the coming weekHello traders,
Gold experienced a significant decline during the last two days of the previous trading week. On Friday, we saw a break below the 3022 level, which led to a shift in market sentiment. While the long-term bullish momentum remains intact, the current price action suggests a strong pullback may be underway, potentially continuing into the coming week.
We should closely monitor the 3028 level for a potential selling opportunity, with the first target set at last week's low of 2999, and an extended target around 2966.
However, if Gold reclaims 3040, we may see bullish momentum resume, given the ongoing geopolitical tensions and risk-off sentiment, which means we need to be very careful and stick to a trading plan.
How do you plan to trade Gold this week? Share your thoughts in the comments!
If you found this analysis helpful, please support it with a boost. Make sure to follow to receive new updates.

XAUUSD Top-down analysis Hello traders, this is a complete multiple timeframe analysis of this pair. We see could find significant trading opportunities as per analysis upon price action confirmation we may take this trade. Smash the like button if you find value in this analysis and drop a comment if you have any questions or let me know which pair to cover in my next analysis.

Next week's market strategy analysisGold fell on Friday, falling to the lowest level of 2999 and then began to rebound strongly. Overall, if we say that gold has peaked now, it is too early, because there are still many uncertainties to stimulate the increase in risk aversion, so it is possible that gold will rise again. However, the impact of the news is only one aspect of our reference. However, the impact of news is only one aspect for our reference. After all, a lot of information cannot be known in time. We can only say that we should pay attention to the existence of this risk factor, so we still start from the technical level. There is still room for gold to rebound next week. We will first focus on the short-term suppression of 3025-30.
From the hourly analysis, pay attention to the support of 3005-3000 below. If it does not break after the retracement, continue to be bullish. Pay attention to the short-term suppression of 3025-3030 above, and focus on the suppression of 3045-57 above. The operation still maintains the same rhythm of the main multi-trend. If you don’t know when to enter the market, you can pay attention to me. I will release specific signals in real time and pay attention to it in time.
Gold operation strategy for next week: Gold will go long after stepping back from 3005-3000, and the target is 3025-3030.

Don't miss out on this analysis of XAUUSD.On Mar 21, 2025, XAUUSD closed at 3023, with the lowest 2999.32 and the highest 3047.43. Previous support was 3000 and resistance was 3060. Now let's analyze new levels and the trend.
New Support and Resistance
Pivot Point Theory: From Huicong Finance data on Mar 21, 2025, the pivot point for XAUUSD is 3042.41, with support at 2995.85 and resistance at 3090.92.
Technical Analysis: On the 4 - hour chart, support is near 3027.26 (20 - day MA) and in 3011 - 2996.90 range. Resistance is around 3056.20 - 3057.25 (previous high) and 3070 - 3085.
Trend Analysis
Technical: The 5 - day MA (around 3030) and 20 - day MA (2950 - 2942) are in a bullish arrangement, but the price has deviated. The 4 - hour chart shows a possible completed correction, yet there are divergence signs, indicating potential profit - taking pressure.
Fundamental: Geopolitical tension in the Middle East persists, supporting gold. US economic data is weak, fueling recession concerns and safe - haven demand for gold. The market still anticipates Fed rate cuts, which would benefit gold.
In short, XAUUSD may range - trade between 3000 - 3060 in the short - term. A break above 3060 could lead to higher prices, while a break below 2995.85 may open up downward space.
The market has been extremely volatile lately. If you can't figure out the market's direction, you'll only be a cash dispenser for others. If you also want to succeed,Follow the link below to get my daily strategy updates

Next week's analysis has been written, please check itOn Mar 21, 2025, XAUUSD closed at 3023, with the lowest 2999.32 and the highest 3047.43. Previous support was 3000 and resistance was 3060. Now let's analyze new levels and the trend.
New Support and Resistance
Pivot Point Theory: From Huicong Finance data on Mar 21, 2025, the pivot point for XAUUSD is 3042.41, with support at 2995.85 and resistance at 3090.92.
Technical Analysis: On the 4 - hour chart, support is near 3027.26 (20 - day MA) and in 3011 - 2996.90 range. Resistance is around 3056.20 - 3057.25 (previous high) and 3070 - 3085.
Trend Analysis
Technical: The 5 - day MA (around 3030) and 20 - day MA (2950 - 2942) are in a bullish arrangement, but the price has deviated. The 4 - hour chart shows a possible completed correction, yet there are divergence signs, indicating potential profit - taking pressure.
Fundamental: Geopolitical tension in the Middle East persists, supporting gold. US economic data is weak, fueling recession concerns and safe - haven demand for gold. The market still anticipates Fed rate cuts, which would benefit gold.
In short, XAUUSD may range - trade between 3000 - 3060 in the short - term. A break above 3060 could lead to higher prices, while a break below 2995.85 may open up downward space.
The market has been extremely volatile lately. If you can't figure out the market's direction, you'll only be a cash dispenser for others. If you also want to succeed,Follow the link below to get my daily strategy updates

XAU/USD: Weekly Recap and Key Levels for Next WeekLast week, XAU/USD showed a pattern of high-level consolidation. After reaching the key psychological level of 3000 USD on March 17th, gold prices entered a sideways phase. On March 20th, gold hit a new all-time high of 3057 USD per ounce before pulling back. By March 22nd, gold prices had fallen for two straight trading days, briefly touching 2999 USD per ounce. However, dip-buying activity helped recover some of the losses.
From a technical perspective, the 5-day and 20-day moving averages remain in a bullish alignment. However, the price has deviated significantly from these averages, indicating a need for a technical correction.
Gold may continue its adjustment early next week, with support levels to watch in the 3000-3030 USD range. If geopolitical tensions do not escalate significantly, spot gold prices could test support near 2993 USD, though the likelihood of breaking below 3000 USD is low.
If gold prices fall below the 5-day moving average, they may further test the 20-day moving average support (2950.00-2942.00 USD). If the recent consolidation range is broken, the resistance levels to watch are the previous high of 3057 USD and beyond.
I will share trading signals every day. All the signals have been accurate for a whole month in a row. If you also need them, please click on the link below the article to obtain them.

XAUUSD/GOLD WEEKLY BUY PROJECTION 23.03.25Gold's recent bullish trend is largely driven by factors like geopolitical uncertainty, inflation concerns, and central bank actions, which lead investors to seek the perceived safety of gold as an asset.

Golden Strategy Perfect HitWalk together and witness the harvest! In the ups and downs of the trading market. With the trust and persistence of my trading strategies and trading plans, everyone successfully pocketed the fruits of victory. Sometimes you don't even need to know how to trade. Having an accurate and precise analysis guide is crucial and is the basis for profit. Similar accurate signals are available every day. Traders don't know when to enter the market? Then you can follow me. When the opportunity comes, I will promptly release more accurate signals in my trading center. Welcome everyone.

Profit again, follow-up operation strategyBrothers, as I mentioned in my last opinion, gold is facing support below 3030-3020, so I still prefer to go long on gold in terms of trading. Today, we went long on gold near 3023 according to the strategy of short first and long later. Just when gold rose to around 3038, I manually closed my long position and easily made a profit of 140 pips again.
Today, Friday, gold hit the highest level of 3047 in the morning and started to fluctuate and fall. As of now, gold has hit the lowest level near 3021 and started to rebound. The 3025-15 line below is also the support position we have been talking about. Here we can find opportunities to intervene in long orders. We must be cautious in operation on Friday. All profits have been made this week. Since the announcement of the US interest rate decision, gold has been running all the way and has set a new record high again. Again, don’t chase gold at high levels, look for opportunities to go long when it falls back, and the operation is mainly to go long when it falls back. If your current gold operation is not ideal, I hope I can help you avoid detours in your investment. Welcome to communicate with us!
From the 4-hour analysis, the short-term support of 3025-3015 is concerned, and the important support of 3000-05 is focused on. If it does not break, it will continue to be bullish. The upper target is to pay attention to the upper pressure. Before the daily level does not fall below the lower support, the main long rhythm will remain unchanged. I will inform you of the specific operation strategy in time, so please pay attention to it in time. Gold operation strategy: Gold will go long after stepping back on the 3025-3015 first line.

Will the gold trend peak in the evening?After the opening today, the upward sentiment continued and broke through the high again, reaching the 3056 line.Today, the main trend of gold trading is shorting at high levels, supplemented by long positions at low levels.
Strategy: The 3055 short position given at the end of yesterday's trading has been reached. If it touches 3060 during the day, cover the position once and do not decide on defense for the time being. If it touches around 3067 during the day, short once and cover the position once at 3072, defend at 3077, and target 3052-3047, then hold if it breaks down.

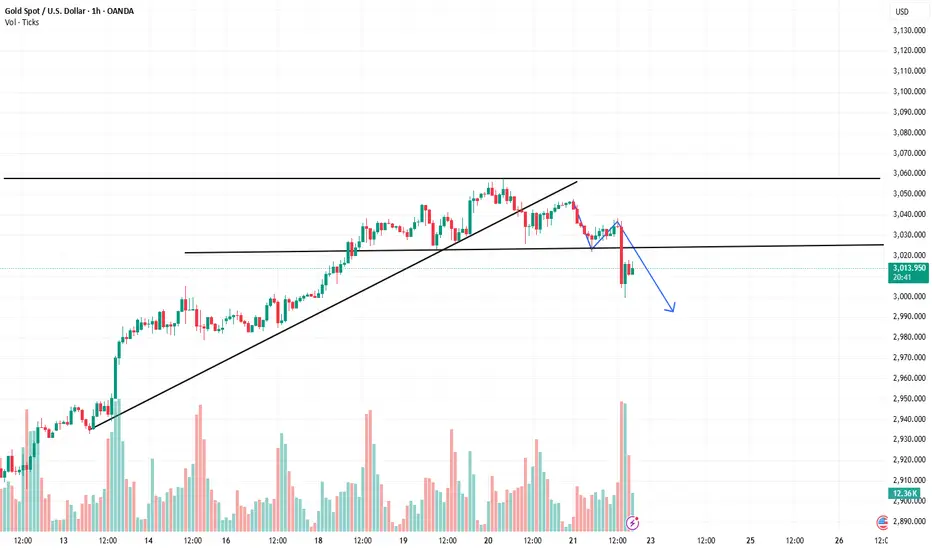
Golden High DivingThe 1-hour moving average of gold has begun to turn downward, and gold may open up room for decline. The 1-hour moving average of gold has now formed a head and shoulders top structure. Gold rebounds or continues to be short. The market is weakening, and the gold price has fallen below the 3,000 mark. The market direction has turned short, so the short-biased situation has been finalized. Long positions must be put aside first, because it is a short market now. You can continue to short after the gold price rebounds and adjusts. Pay attention to the 3020 line on the upper pressure level. You can go short directly when it rebounds! Overall, the short-term operation strategy for gold next Monday is to short on rebounds as the main strategy, and to go long on pullbacks as the auxiliary strategy.
Reference for gold operation strategy next Monday:
Short order strategy: Short 20% of the position in batches when gold rebounds to around 3020-3022, stop loss at 3055, target around 3010-3005, and look at the 3000 line if it breaks;
Long order strategy: Long 20% of the position in batches when gold pulls back to around 2998-3000, stop loss at 8 points, target around 3010-3015, and look at the 3020 line if it breaks;
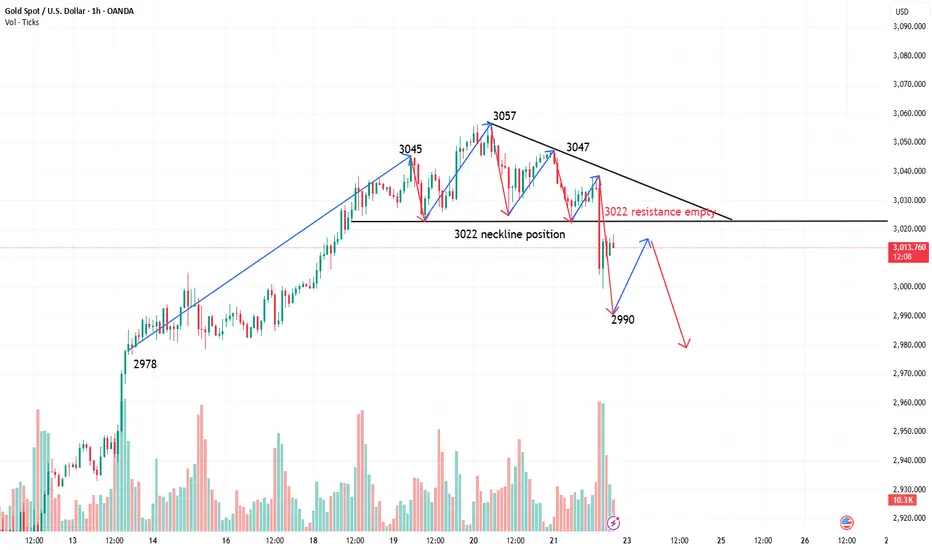
Gold is long or short at the end of the dayOn the 4-hour chart, gold has a minor support level near $3,022, which is also the neckline of the head and shoulders top pattern. Buyers are expected to intervene here and use the neckline as a risk control point, with the goal of pushing gold prices to new highs. On the contrary, sellers will focus on gold prices falling below this support to increase confidence and increase short selling, with the target of $3,006.The gold 1-hour moving average begins to flatten. If the gold 1-hour moving average turns downward, the strength of gold bulls will weaken. Now the gold 1-hour moving average has formed a head and shoulders top pattern. Gold is under pressure at the 3057 high point and continues to go short. At present, the support of the moving average needs to focus on the MA20 line, and the death cross signal of the MACD indicator should also be guarded against. The possibility of profit correction at the end of the weekly line cannot be ruled out. Therefore, it is recommended to rebound high and go short.
"XAU/USD Price Action Analysis: Targeting $3,063 or Reversal to Alright! Let's break down the chart analysis. 📊
🔹 Chart Overview:
Pair: XAU/USD (Gold vs. US Dollar)
Timeframe: 1-hour (H1)
Price Level: Current price at $3,030.44
Target Point: $3,063.97
🔥 Key Observations:
Supply and Demand Zones:
The highlighted blue zones suggest resistance (supply) where price was rejected twice (blue arrows).
The larger gray zones below indicate potential demand/support.
Double Top Formation:
The double blue arrows point to a possible double-top pattern, hinting at a bearish reversal. However, the price hasn't strongly broken below the neckline yet.
Scenario Analysis:
Bullish Scenario: If the price holds the current demand zone and breaks above the immediate resistance, we could see a rally towards the target of $3,063.97. 💹🚀
Bearish Scenario: If it fails to hold the support zone, it may drop to the lower demand area around $3,000. 🔻
📉 Conclusion:
Entry Idea: Long above the supply zone break with a target of $3,063.97.
Stop Loss: Below the current demand zone at around $3,020.
Risk Management: Watch for strong price action before entering.

XAUUSD must watchWith all the positive news gradually materialising, the upward momentum of gold has significantly slowed down.
Judging from the current trend, the resistance area around 3060 is quite crucial and exerts strong resistance. The support range remains at 3010-3020, but it is essential to closely monitor any changes in this support level, as the price might further decline to the secondary support level of 3000.
I suggest initiating short positions near the resistance zone today, which is relatively safe.
💎💎💎 XAUUSD 💎💎💎
🎁 Sell@3050 - 3060
🎁 TP 3030 3020
The market has been extremely volatile lately. If you can't figure out the market's direction, you'll only be a cash dispenser for others. If you also want to succeed,Follow the link below to get my daily strategy updates

Breakout Confirmed! Gold’s Next Target Could Be $3,500+Gold has reached a new all-time high (ATH), signaling strong bullish momentum. The breakout above the long-term rising trendline, which previously acted as resistance, indicates a shift in market structure.
The resistance zone has now turned into support, confirming buyers' dominance. A minor pullback or retest of this breakout level could be expected before a stronger continuation to the upside.
If the price sustains above this zone, potential targets lie at $3,100-$3,200 in the short term and $3,500+ in the medium term.
