XAU/USD 14 March 2025 Intraday AnalysisH4 Analysis:
-> Swing: Bullish.
-> Internal: Bearish.
Previous analysis was not met as price printed a bullish iBOS. Support in the rise of price is largely due to the trump trade and tariff war which is causing market jitters.
Intraday Expectation:
Price to indicate bearish pullback phase initiation by printing bearish CHoCH. Bearish CHoCH positioning is denoted with a blue dotted line.
Note:
With the Federal Reserve's dovish stance and persisting geopolitical uncertainties, heightened volatility in Gold is expected to continue. Traders should proceed with caution and adjust risk management strategies in this high-volatility environment.
Price could also be driven by President Trump's policies, geopolitical moves and economic decisions which are sparking uncertainty.
H4 Chart:
M15 Analysis:
-> Swing: Bullish.
-> Internal: Bullish.
Price has further printed a bullish BOS. Remainder of analysis and bias remains the same as yesterday's analysis dated 13 March 2025
Analysis and bias has not been met, largely due macroeconomic events, particularly the Trump trade tariff war, which is causing uncertainty within the markets which is supporting Gold price.
Price has printed a bullish iBOS.
Within the structure following the iBOS, price has printed a several bearish CHoCH's with very minimal pullbacks before continuing bullish.
In order not to distort internal structure range I will apply discretion and not classify bearish CHoCH without considerable pullback.
Intraday Expectation:
Await for price to print Bearish CHoCH which is supported by a pullback relative to recent price action.
Note:
With the Federal Reserve maintaining a dovish stance and ongoing geopolitical tensions, volatility in Gold prices is expected to remain elevated. Traders should exercise caution, adjust risk management strategies, and stay prepared for potential price whipsaws in this high-volatility environment.
M15 Chart:
Xauusdupdates

Gold Bulls Mid Term, Long Term Trade Direction (Buy/long)Gold is trading around 2857.xx
The bullish momentum continued with trump unexpected policy shift of trade and war and technically if this momentum continued, we could see bullish continuation towards 3000 - 3085 by May 2025.
Mid to long term stance is buy on dips.

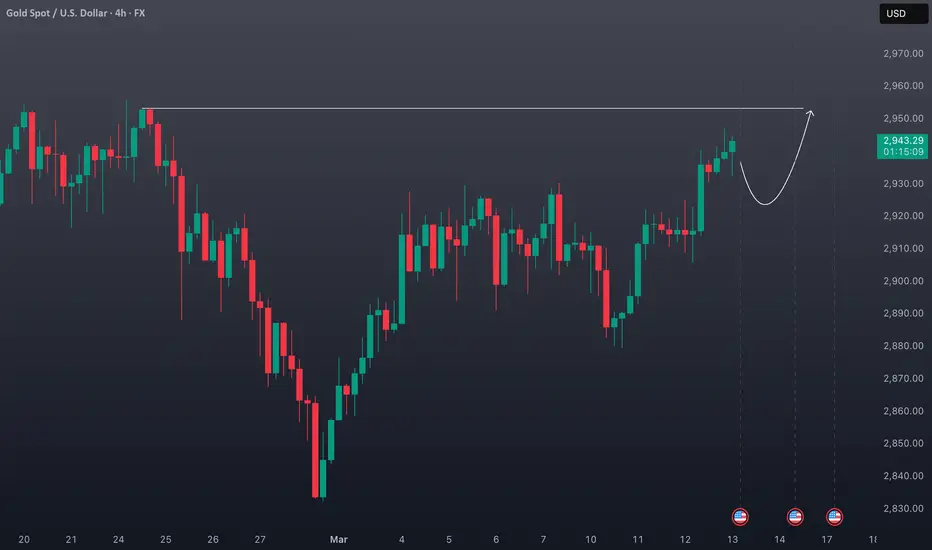
XAUUSD Showing Strength on the 4H Chart📈 XAUUSD Gold 🟡 has been demonstrating strong resilience, maintaining a clear bullish trend on this 4H timeframe. Price action continues to align with an upward trajectory, with my target set at the previous high marked on the chart 🎯.
A pullback is expected, potentially offering an opportunity to enter at a discount before a continuation toward the target zone 🚀.
⚠️ Not financial advice—always manage risk appropriately!
Gold bulls are close to reaching 3,000After gold broke through the 2830-35 line, it started a bullish trend. I have always been bullish on gold. Friends who follow my articles can see that gold directly broke through the historical high last night and set a new historical high. Gold fell back and continued to rise. Gold is only one step away from 3000. The hourly moving average of gold continued to form a golden cross and diverge upward in a bullish arrangement. After gold broke through on Wednesday night, gold bulls were even better. Gold has now broken through its historical high. If gold falls back to the last high of 2956, it is an opportunity to buy on dips. However, strong markets often have a large decline. If the decline is too large, gold will weaken instead. Then gold can buy on dips when it falls back to 2965-70. The current decline of gold is an opportunity to buy. Gold 3000 is within reach, and it is expected to test and break through 3000 today.
From the analysis of the 4-hour gold trend, we focus on the support of 2956-65 below and the suppression of 3000 above. In terms of operation, we can follow the trend to go long. Once a breakthrough occurs, we can continue to follow up in the later stage. In the middle position, we should watch more and do less, and follow orders cautiously, and wait patiently for key points to enter the market.
Gold operation strategy:
1. Buy more when gold falls back to 2965-70, and buy more when it falls back to 2956, stop loss at 2949, target 2995-3000, and continue to hold after breaking through.

Gold 100% Profit SignalGold prices rose, hitting another record high as heightened tariff uncertainty and bets on the Federal Reserve's loosening of monetary policy kept the metal attractive. Spot gold rose 1.46% to $2,972.80 an ounce at press time, reaching an intraday high of $2,978.33, surpassing the previous record high of $2,956.15 set in February. Gold prices could soar to an unprecedented $3,500 an ounce in the third quarter as investors flock to safe-haven assets amid heightened geopolitical tensions. It is predicted that gold prices could average $3,150 an ounce between July and September. Concerns about a possible shutdown of the U.S. federal government also weighed on the market as Senate Democrats failed to agree on a temporary funding bill on Wednesday, adding to uncertainty.
Meanwhile, the weakening of US inflation data further reinforced the market's expectations of a rate cut by the Federal Reserve. The US CPI data for February released on Wednesday showed that the overall inflation rate fell from 3% in January to 2.8%, lower than market expectations; the core CPI (excluding food and energy) rose 3.1% year-on-year, also down from 3.3% in January. This data boosted the market's confidence in the Fed's loose policy, and some traders even expected the Fed to cut interest rates by 25 basis points in June, July and October respectively. The rising expectations of rate cuts directly depressed US Treasury yields. Although the US dollar index rebounded slightly from its low since October 16, it still lacked strong momentum for a strong counterattack overall. This environment provides significant support for non-interest-bearing gold.
Technical analysis of gold: On Thursday, gold in the U.S. market pushed upward and broke through the high. The price broke through the high of 2956 and then accelerated to rise. The current high is 2978. This position is 100% of the previous round of rise and expansion, which belongs to the resistance area. Pay attention to whether it can suppress the bulls. The amplitude after breaking the high is larger than expected. After gold broke through 2930 yesterday, gold bulls were strong, and no longer the same volatile market as before. Gold bulls began to exert their strength, and gold began to go long in reverse. Gold was directly long at 2933 today, and the article also directly and publicly suggested going long at 2933. Gold rose and harvested. Gold fell back to around 2940 in the U.S. market and continued to go long. Gold rose again and harvested. Gold went long in reverse and won three consecutive victories.
In the short term, the current increase of more than 40 US dollars throughout the day is obviously very risky. Going long is also against the trend. The trend belongs to the bulls. The 1-hour moving average of gold continues to cross upward and the bulls are arranged and divergent. The gold bulls are in high spirits. Today we have been emphasizing that gold falling back to 2930 is an opportunity to buy on dips. The gold bulls will become more and more fierce. Gold will rise directly when it falls back to 2939 in the US market. The US market directly breaks the historical high of 2956. Then gold will continue to buy when it falls back to 2956 in the future. Gold is likely to hit a new record high again and go to 2985. Gold has now broken through the shock range, so there is obviously a trend change. Then the only way is to follow the trend and go long. Going with the trend is light and fluttering, and going against the trend is messy. On the whole, the short-term operation strategy of gold today is recommended to focus on callbacks and short rebounds. The short-term focus on the 3000-3010 resistance line on the upper side and the short-term focus on the 2975-2965 support line on the lower side.
Strong rise to test 2956 again?Before gold broke through the suppression of 2930 yesterday, gold fluctuated, but we have always emphasized that the fluctuation should follow the previous trend. It is also difficult to fall, and every fall is an opportunity to go long! Will there be a new rise today? The low point of 2880 on Monday this week has temporarily become a long defense position, no matter from which angle. If you are bullish, you must rely on this position to defend and look up. The daily line is a big sun, but there are still two mountains to climb, one is to break through the high point of 2956, and the other is to go out of the continuous trend
Today, we need to pay attention to when the price will retreat to give us a chance to get on board, and whether it can break the high when it rises again. This is also the key to judging whether the bull market can continue. If the price fails to break the high next time it rises, but it still rises, it will fall into a high-level consolidation. We will make arrangements for this after we go long later. As for today, if the price does not change much, then the 2956 high point suppression is the key point, followed by the support of the top and bottom conversion of 2930!
2956 does not break the air, defend 2962, and the target is 2935-30! For long orders, look at the support near 2930 to enter the market at an appropriate time!

Gold market trend analysisGold trend analysis: Gold price broke through the suppression level of 2930 last night, and there was a correction in the early morning. The correction was also above 2930 and then rose. As of the time of writing, the gold price was trading around 2941. Although the previous shock range broke upward, today we need to pay attention to whether the gold price can test the previous high of 2956, and secondly pay attention to the support of the resistance-to-support level of 2930, mainly because the recent rhythm is that there is no continuity in the rise and fall.
From the hourly level, the gold price broke down to 2880 at the end of Monday, and recovered the decline at the opening of Tuesday, and crossed the previous day's high, so this upward breakthrough also needs to pay attention to the situation of the correction. After 2930 is broken, the next resistance can refer to the previous high of 2954. The short-term support below is 2930, followed by the position of 2906, which has been repeatedly corrected on the way up. Since the gold price has broken upward, today's trend will be extended to wait for the correction to go long, and the second is to go short after touching the previous high to see a wave of correction. If the European session directly corrects and falls below 2930, then adjust the thinking to execute the high short to see 2906.
1. In the early trading, if the price falls back to around 2828, take a long position with a light position and look at the upside, protect the position of 2820, and target around 2945;
2. If the price fluctuates around 2940 in the early trading, then you can directly go long in the European trading and look at the upward trend, protect 5 points, and target around the previous high of 2956;
3. If the upward trend continues in the early trading, short at 2956 and look for a retracement, protect 5 points, and target 2940;
4. If the price falls below 2920 in the European trading, then adjust the thinking to rebound and short, and analyze this in the future market.

XAUUSD Today's strategyThe Trump administration's capricious trade policy has triggered market concerns about global economic growth, opening a new front in the global trade war, leading to increased financial marekt uncertainty, investors' risk aversion is high, and they have put money into gold, driving gold prices up.
The world continues to increase its gold reserves with relatively large efforts, providing a solid bottom support for the gold price. Data from SPDR Gold Trust, the world's largest gold ETF, shows that its gold holdings in February were at the highest level since 2023. From February 27 to March 13, the holdings also increased. The strong demand for gold investment has driven up the gold price.
BUY:2965-2975
SL:2960
TP:2995-3005
We will share various trading signals every day. Fans who follow us can get high returns every day. If you want stable profits, you can contact me.

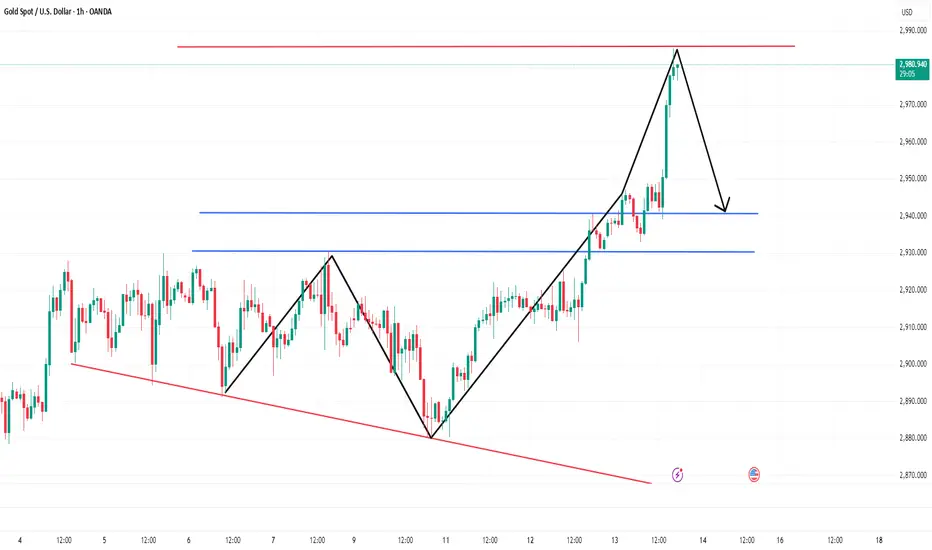
Be wary of black swans appearing on Friday!On Thursday, gold continued to rise in the US market. Driven by the uncertainty of tariff policies and the expectation of interest rate cuts by the Federal Reserve, the safe-haven appeal of gold remains undiminished. As of press time, the highest gold price has reached near 2985. After the CPI on Wednesday, gold seemed to have activated the rising button, and it started to rise all the way from the CPI low of 2905. After the initial jobless claims today, it hit a new record high again.
You can see that I have already drawn the 4-hour top range here
I think the top of 2990 is almost a potential top position, and tomorrow is Black Friday. Why did gold dare to go up so quickly on Thursday? There is only one reason, then there may be a big move tomorrow, Friday. It is very likely that in the early morning or tomorrow Friday morning, a wave of suppression near 2990 will be tested, and then the possibility of a rapid retracement will appear.
Therefore, I definitely do not recommend that you chase more in the future, there is no doubt about this. On the contrary, there are many people chasing more in the market at present. Seeing that gold has risen so much, they must think of retreating and going long. Therefore, tomorrow Friday, I suggest that you pay attention to the area around 2990. As long as this position can show a top structure signal in the Asian session, then don't hesitate to go short directly. Without saying too much, the first target can be seen at 2940-2930, or even 2920-2910.
You can read bottom signals, interpret daily market trends, and share real-time strategies, so you no longer blindly follow the trend.

Gold accelerates to the top! The plunge alarm has soundedThe gold market has reached a critical point! Driven by the strong risk aversion sentiment, the price of gold has soared all the way, quickly breaking through many resistances and accelerating to the vicinity of 2985. However, if you look closely at the K-line chart, you will find that this round of rise is mainly stimulated by news, and there is strong resistance in the vicinity of 2985. Fortunately, we have already made arrangements. We have set the number of transactions reasonably before shorting. The current margin level is sufficient to support us in dealing with the current situation. At this time, it is a good time to increase positions. We can boldly increase positions and short in the 2977-2983 area, appropriately increase the number of transactions, lower the average price, and wait for gold to fall back to the 2940-2930 area. All positions will be decisively closed to achieve a turnaround, secure the bag, and lock in profits.
You can read bottom signals, interpret daily market trends, and share real-time strategies, so you no longer blindly follow the trend.
XAUUSD buy-and-profit trading signalGold news analysis: The latest data released on Thursday (March 13) showed that the US producer price index stagnated due to falling service costs, and the number of initial claims in the United States fell slightly, still close to pre-epidemic levels. At the same time, driven by demand for safe-haven assets due to tariff concerns and US inflation reports that reinforced expectations of future rate cuts, gold prices approached historical highs but failed to break through. As of press time, spot gold rose 0.5% to $2,946.68 per ounce. The number of initial jobless claims in the United States fell last week, but the government's sharp spending cuts and escalating trade wars threaten the stability of the labor market. The U.S. Department of Labor reported on Thursday that the number of initial jobless claims fell by 2,000 to 220,000 after seasonal adjustment in the week ending March 8. Economists surveyed by the agency had previously expected the number of initial jobless claims to be 225,000 last week. In late February, the number of applications for unemployment benefits soared due to seasonal fluctuations around the winter blizzard and the President's Day holiday, which made it difficult to adjust the data. Although the labor market remains solid, the Trump administration's policies pose downside risks.
Gold's 1-hour moving average is still a golden cross with upward bullish divergence. After breaking through the box and oscillating, gold continued to rise in the morning today and has basically stabilized at the 2930 line. Gold's retracement to 2930 is an opportunity to buy on dips. Gold can buy more first when it retraces to 2933 in the afternoon. If gold does not fall below 2930 again, then gold bulls will have further momentum to rise. Gold bulls are now ready to go and are expected to be even better. In the end, gold bulls have the upper hand in the oscillation, so follow the pace of the bulls. Whether gold can break through the historical high again, we will wait and see! Overall, recommends that the short-term operation of gold today is mainly long on pullbacks and short on rebounds. The short-term focus on the upper side is the resistance of 2985-2990, and the short-term focus on the lower side is the support of 2938-2928.
Trading is risky, so control your position reasonably. If you don't know when to enter the market, please follow the real-time signal announcement of my trading center or leave me a message, so that you can get rid of trading problems and realize profits as soon as possible. PEPPERSTONE:XAUUSD OANDA:XAUUSD CAPITALCOM:GOLD TVC:GOLD FOREXCOM:XAUUSD

All units pay attention to gold 2975 directly short 2800 seePrepare for a sharp drop
Gold is ready to plummet, and the notification has been in place. The current price in the 2970-2975 area is short, and it is ready for a sharp drop. This sharp drop will be below 2800. I have told you in advance
The crazier gold is, the more it will plummet. The whole network is bullish. What are the dealers doing? It must be an unconventional trend. Enter the market at a short speed
You can read bottom signals, interpret daily market trends, and share real-time strategies, so you no longer blindly follow the trend.

Gold is about to fall, and the secret behind itFrom the hourly chart, the gold price rose rapidly from 2932 to 2946 in the morning, showing the strong power of the bulls. But in the afternoon, the situation suddenly changed, and the price quickly fell back from 2946 to 2932, and the bulls and bears played fiercely. In the European session, gold once again exerted its strength and climbed from 2932 to 2948. Combining the characteristics of the Asian and European sessions, it is not difficult to find that gold has a tendency to go back and forth in a certain range again. Looking back at the rebound from 2880 to 2948, it is very similar to the trend of the early March. That is, after a wave of short-term continuous positive pull-ups, it will enter a box-shaped oscillation state and last for several hours, and then start a short-term continuous positive pull-up again, and then fall into a box-shaped oscillation cycle again. The pressure formed by the upper rail of the channel 2951-53 line. If the gold price is under pressure here, there is a high probability that it will fall back repeatedly, and the target area is 2930-2920. Even reaching the 2910 area.
You can read bottom signals, interpret daily market trends, and share real-time strategies, so you no longer blindly follow the trend.

XAU/USD 13 March 2025 Intraday AnalysisH4 Analysis:
-> Swing: Bullish.
-> Internal: Bearish.
Analysis/Bias remains the same as analysis dated 07 March 2024.
Price has printed a bullish CHoCH according to analysis and bias dated 28 February 2025.
Price is currently trading within an established internal range.
Intraday Expectation:
Price is now trading in premium of 50% internal EQ where we could see a reaction at any point. Price could also target H4 supply zone before targeting weak internal low, priced at 2,832.720
Note:
With the Federal Reserve's dovish stance and persisting geopolitical uncertainties, heightened volatility in Gold is expected to continue. Traders should proceed with caution and adjust risk management strategies in this high-volatility environment.
Price could also be driven by President Trump's policies, geopolitical moves and economic decisions which are sparking uncertainty.
H4 Chart:
M15 Analysis:
-> Swing: Bullish.
-> Internal: Bullish.
Analysis and bias has not been met, largely due macroeconomic events, particularly the Trump trade tariff war, which is causing uncertainty within the markets which is supporting Gold price.
Price has printed a bullish iBOS.
Within the structure following the iBOS, price has printed a several bearish CHoCH's with very minimal pullbacks before continuing bullish.
In order not to distort internal structure range I will apply discretion and not classify bearish CHoCH without considerable pullback.
Intraday Expectation:
Await for price to print Bearish CHoCH which is supported by a pullback relative to recent price action.
Note:
With the Federal Reserve maintaining a dovish stance and ongoing geopolitical tensions, volatility in Gold prices is expected to remain elevated. Traders should exercise caution, adjust risk management strategies, and stay prepared for potential price whipsaws in this high-volatility environment.
M15 Chart:

Gold fake breakthrough, 2939--2945 is open shortBecause it is not a unilateral trend at the moment, it does not have the momentum for continuous rise. Without the promotion of events, it is extremely difficult to break the historical high. The market has the 80/20 rule. Before 2910-2920, many analysts asked you to short gold at a high position, but you were slapped in the face by the surge in gold. Now many analysts also suggest that you should go long after a decline. Today, gold will definitely plummet and slap you again. The bookmakers have also figured out the order-making methods of such analysts, and these analysts have been reduced to fish meat. Only a few people can judge clearly that gold will continue to fluctuate at present. This position is a false breakthrough, which is a bait thrown by the dealer to trap a group of people.
In the 4-hour cycle, the gold price is in the shape of a trumpet. Today's high point just touches the pressure line. Without saying too much, the opportunity is given to enter the market quickly to short in the 2939-2945 area.
Now let's witness the market being controlled by us.
You can read bottom signals, interpret daily market trends, and share real-time strategies, so you no longer blindly follow the trend.

XAUUSD Analysis todayHello traders, this is a complete multiple timeframe analysis of this pair. We see could find significant trading opportunities as per analysis upon price action confirmation we may take this trade. Smash the like button if you find value in this analysis and drop a comment if you have any questions or let me know which pair to cover in my next analysis.

The downward trend is clear at a glanceCPI inflation in February recorded the slowest growth in four months, bringing a slight relief to the stagnation of the anti-inflation process in the past few months. According to data released by the U.S. Bureau of Labor Statistics on Wednesday, after a sharp increase of 0.5% in January, the CPI in February increased by only 0.2% month-on-month, lower than the expected 0.3%, the lowest since October last year, and the year-on-year growth slowed to 2.8%, the lowest since November last year, lower than the previous value of 3% and the market expectation of 2.9%. After the data was released, gold once stretched to around $2,920, and then fell again to a low point near 2,905-06. After touching 2,905, it returned to support and then rebounded. As of now, the highest point is the rebound to around 2,940. It can be seen that the rise from 2,832 to the present is basically in the abc rising wave shape. At present, the upper 2940 is the 618 suppression point. If it cannot effectively stand at 2940, there must be a consolidation, and it must fall back. Secondly, 2920 was the high point of gold in the early stage. After breaking through, 2920 has become a support position. Therefore, if it cannot break through 2942, there is a high probability that there will be a wave of support 2920. Even lower 2900 area.
You can read bottom signals, interpret daily market trends, and share real-time strategies, so you no longer blindly follow the trend.

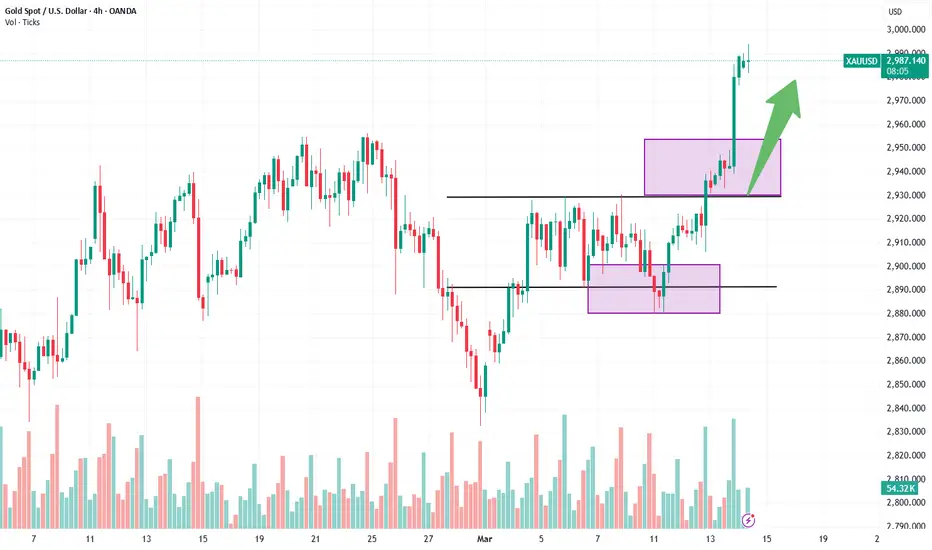
Gold Breaks Out: Is a New All-Time High on the Horizon?Finally, after a week of range-bound trading and a false downside breakout, Gold has found direction and surged to the upside.
As expected, the inflation data served as the catalyst. With the reported figure coming in lower than anticipated, traders are now pricing in potential rate cuts.
Technically, as mentioned, the price broke above the 2930 resistance level and reached a high at 2947 just shy of the all-time high.
Currently, Gold is undergoing a normal correction, which should present traders with an opportunity to buy at lower levels. The ideal buy zone is between 2920 and 2930, with the bullish outlook negated if the price falls back into the previous range.
In terms of targets, the old ATH acts as resistance, but I wouldn’t be surprised if Gold pushes higher and sets a new record above the 2960 zone.
Disclosure: I am part of Trade Nation's Influencer program and receive a monthly fee for using their TradingView charts in my analyses and educational articles.

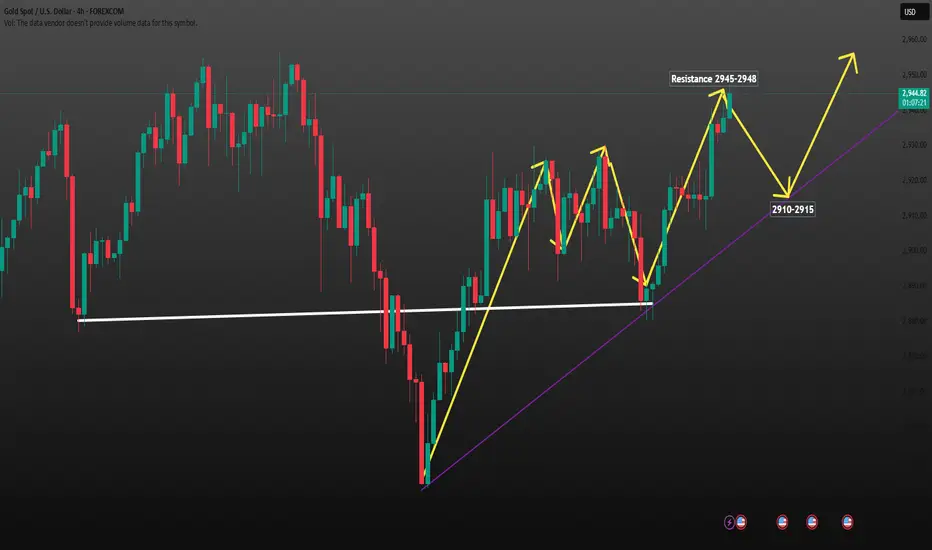
How to continue to short (2)As in my last analysis, currently XAUUSDXAUUSD is about to hit that 2945-2948
Operation policy reference:
Short Position Strategy
1:XAUUSD sell@2945-2948 20%Transaction of funds , tp:2930-2920-2910
2:XAUUSD Buy@2910-2915 20%Transaction of funds , tp:2930-2945-2955
The Signals have timeliness , if you also need to get accurate signals every day,follow the link below to get my daily strategy updates
If your account is still in the red, you need to pay attention to whether the resistance is valid. If the resistance is valid, there may be a decline. You can close your order on the decline and trade in the right direction again
Gold Top Trading SignalsThe first definition of trend is continuity. So if the market turns bearish, then it will continue to fall today. It is best to break below 2880 to be a bearish trend. If it rebounds during the day, it is still a shock. As long as the low point of 2880 is not broken, gold has just changed to a shock range. There is little point in being bearish, because the position of 2880 itself is also a support.
There is also a key support of 618 golden ratio at 2870 and a strong support at 2860. If these are broken, it will be difficult to hold the previous low of 2832, and there may be further declines. Therefore, gold will not go straight up and down here at present, and it is more likely to run in a volatile and bearish market, accumulating upward momentum before rising.
Because, from an overall perspective, the current position of gold is where it rebounded after a sharp rise in the previous period. It is not appropriate to be overly bullish or overly bearish on gold at the moment. Let it move for a while, and it will naturally come out in time. We need to be more patient.
For today, we can first see the European session continue to fall, focusing on the pressure at the 2900 line. The watershed is at 2910, and the support below is at 2880-2870, with strong support at 2860. If the rebound in the European session is too strong, then it will still be volatile.
In terms of trading, gold still fluctuated sideways within the range yesterday. We took a cautious wait-and-see attitude. It is not easy to act rashly when the direction is unclear, not to mention that it is still running in the middle of the range. Therefore, we waited until the evening to go short at 2905, held overnight, and took profit at 2884 this morning, earning 21 US dollars.

Gold Top Analysis StrategyGold, yesterday the bears finally broke the recent range of shocks, and stopped after touching the lowest level of 80, and rebounded again after opening in the morning, touching the 00 position, and this position is also the effective point of the previous top and bottom conversion, which was also mentioned in the previous period. Once this position is broken, we will still choose to follow up and look at gold. At present, it continues to rebound near this position, which is also an ideal point for us to continue to arrange short orders. From the daily line, the current big Yinxian pattern has broken down, and the short-term moving average has reversed to form a suppression system, and the moving average position is concentrated above. The middle track position gives suppression, while the support below is maintained at yesterday's point 80, which is basically equivalent to the previous rising position. Since the bears have already formed a downward break, we still choose to follow up the short order in the short term and wait for the second pullback. We can directly short gold near 98-99 during the day. This position is also the key pressure point of the daily line, and the target is around 80-70. If the European session continues to be weak, then the US session can continue to short, and if it stands above 00 for a while, you can consider withdrawing and exiting, and it is very likely to rise again.
Gold is shorted at around 98-99 during the day, with a target of around 80-70, and a stop loss of 0.55

Today's Gold Trading StrategyTechnical analysis of gold: The daily positive line of gold recovered and recovered the losses of the previous day's negative line, returning to the previous range of fluctuations, and the lowest point was 2880 without breaking. The European and American markets recovered the losses. The weak downward trend of the US dollar still limits the short-term adjustment space of gold prices. It returned to the 2890 range and saw again. It is currently close to the upper track. The upper focus is on the 2930 high point. If this position is not broken, the fluctuation will continue. The daily line closed with a big positive line with a lower shadow slightly longer than the upper shadow line. After this pattern ended, gold currently only looks at the oversold rebound trend. Today, gold focuses on the upper resistance at the 2920 US dollar line. The rebound relies on the high altitude below the resistance here. The lower side looks at the 2900 US dollar level. If it falls below, look at the 2890 US dollar level!
In the 4-hour chart, a wave of consecutive positive lows directly hit the upper rail, and the lower rail stabilized and rebounded to the upper rail. Yesterday's rebound paused slightly at 2922, which is close to the pressure area of the upper rail. At the same time, the upper rail of the Bollinger Band is also near 2930, and it is still closing in parallel. In the short term, before breaking through the range, it is better to look at the suppression when approaching the upper rail. Adjust the thinking after the breakthrough. Sawback and repeated short-distance running are the main ideas at present. Since gold is still oscillating, don't chase more easily now that the gold price has rebounded to a high level. After all, gold is still rebounding under risk aversion, not a reversal of bulls. Since it is still in the oscillation range, continue to go short at the rebound high. Go short directly at 2915 in the early trading. On the whole, I suggest that today's short-term operation strategy for gold is mainly to go short on rebounds, supplemented by going long on pullbacks. The short-term focus on the upper side is the 2920-2922 resistance line, and the short-term focus on the lower side is the 2880-2890 support line.
Short order strategy:
Strategy 1: When gold rebounds to around 2915-2918, short (buy short) in batches, 20% of the position, stop loss 8 points, target around 2900-2890, break to 2880
Long order strategy:
Strategy 2: When gold falls back to around 2880-2883, buy long positions in batches (buy up) with 20% of the position, stop loss 8 points, target around 2900-2910, break the position and look at the 2920 line

Gold Top Trading SignalsGold fell the day before and seemed to have fallen below the bottom of the range at 2890, but it quickly recovered the losses yesterday and rebounded quickly, with European and American markets continuing to strengthen. This means that the market is still hidden with bulls, don't be covered by appearances.
The bottom faces dense support at 2880-2870-2860. If it really goes down, then the previous low of 2832 will also be difficult to hold, and the market will really turn bearish.
The current gold oscillation time is too long. Generally speaking, in the trend market, the oscillation sideways time is 3-4 days, and then there will be a clear direction. The longer the oscillation time, the less clear the direction; as the accumulated energy becomes stronger, once a break is formed later, the greater the force of the market explosion will be.
At present, gold is still in a rhythm of more fluctuations. It is easy to rise but difficult to fall. Even if there is a decline, it will be quickly covered by the rebound.
Therefore, for gold today, we can first look at the continuation of the rebound. The focus of the day is on the support of 2910-2906. The watershed is at 2900. The upper pressure is at the top of the range at 2930. If it breaks, look at the high point of 2945-2956.
If there is no increase during the day, the European session suppresses the sideways decline, then look at the decline in the evening, and it will still fluctuate in the range.
In terms of trading, yesterday's intraday 2901 long order stopped at 2910. In the evening, the strategy was adjusted according to the intraday trend. The callback was directly long at 2908, and the profit was successfully stopped at 2920. The reverse hand was taken at 2919 and the short was stopped at 2914; a total of three orders were operated to earn 8 US dollars. All our transactions are based on evidence. We do not make orders randomly or frequently. Right is right and wrong is wrong. We treat every friend seriously. Trust comes from strength. Trading focuses on profit. There is no shortage of opportunities in the market. It is never too late to start over.
