GoldXAUUSD ( Gold / U.S Dollar )
Key Points :
1. Consolidation Phase
2. Resistance Level
3. Elliot Waves
4. RSI - Divergence
5. Change of Characteristics
Xauusdupdates

XAUUSD Today's strategyYesterday, the highest price of gold was 2922 and the lowest price was 2880. It fluctuated between $2890 and $2915
There have been sporadic exchanges of fire in the Palestinian-Israeli region, and Trump has declared that "new sanctions on Iran will not be ruled out." The uncertainty of geopolitical risks has provided support for gold prices, which has increased investors' safe-haven demand and has a certain driving effect on gold prices.
On March 12, during the Asian trading session, retail investors increased their holdings of gold by 8.2 tons through ETFs. The inflow of funds directly promoted the rebound in gold prices. However, on March 11, the net long position of COMEX gold futures decreased by 12%. Some hedge funds chose to take profits, and the long-short game between institutions and retail investors made the trend of gold prices uncertain.
From the perspective of the daily level, gold has shown the characteristics of repeated fluctuations. On March 11, the daily line closed a long negative line with a lower shadow, suggesting that the power of bears is gradually exhausted; on March 12, the price of gold successfully broke through the key resistance level of $2,900, and the short-term moving average began to turn upward. The green column in the MACD indicator continued to shorten, and there were technical signs of further gains.
Overall, the overall price of gold on March 12 showed a high and volatile trend, and there was a certain game between long and short forces. Under the combined effect of factors such as geopolitical risk uncertainty, economic stagflation concerns, and technical bullish signals, gold prices have continued to rise. However, factors such as the weakening of the Federal Reserve's interest rate cut expectations brought about by the strong US job market and the profit-taking of some institutions have suppressed prices to a certain extent. If the US CPI data released today is higher than expected and inflationary pressure further increases, it may strengthen the anti-inflationary demand of gold and drive up prices. If the data is lower than expected, it may ease the market's concerns about inflation, weaken the attractiveness of gold, and lead to a price correction
buy:2905-2910
tp:2920-2930
If you don't know how to do it, you can refer to my transaction.

Exposure of golden selling points, missed blood lossOn the daily chart, gold prices closed with a volatile cross star in the 2880-2915 range. The MACD indicator completed a "false golden cross" above the zero axis and the momentum quickly decayed, suggesting that the short-term long and short forces have entered a dynamic balance stage. It is worth noting that the 2880-2875 area has formed three effective tests, and its support strength has significantly increased compared with the previous two weeks. However, the combined pressure zone of the MA5 moving average turning down and the 2900 integer mark is forming a 15-dollar wide long-short game zone. In terms of key resistance levels, 2915 and 2930 (March rebound peak) constitute a double technical barrier, and any one of them must be broken to open up the upward space.
The H4 cycle shows that since the rebound from the low of 2865 in February, the gold price has completed 7 oscillations in the 2850-2930 box. The current RSI (14) indicator is horizontally oscillating in the 45 neutral area, and no obvious overbought/oversold signals have appeared. The Bollinger Bands continue to narrow to a width of $12, indicating that there will be directional choices in the short term: if the 2900 mark is stabilized, the upper track of the H4 Bollinger Bands at 2925 may be broken; if the 2880 support is lost, the lower side will test the previous transaction concentration area of 2850-2830.
Gold operation suggestions: Continue to short around 2920-2925, target 2905-2900
You can read bottom signals, interpret daily market trends, and share real-time strategies, so you no longer blindly follow the trend.

Gold (XAU/USD) Technical Analysis – March 11, 2025Gold is currently trading near 2920 , showing bullish momentum after a strong recovery from recent lows. Price action suggests buyers are in control, but key levels must hold for continued upside.
🔍 Key Observations:
✅ Bullish Structure: The price has formed a bullish flag , signaling potential continuation toward liquidity above 2930.3 (swing high).
✅ Fair Value Gap (FVG) 2907 - 2900: This zone should act as support. If price stays above it, we could see bullish continuation.
✅ Bullish Order Block (OB) 2891 - 2880: If price retraces, this area could serve as a high-probability buy zone for another push higher.
📈 Key Levels to Watch:
🔹 Support Zones:
2907 - 2900 (FVG, 4H) – Ideal for bullish continuation.
2891 - 2880 (OB, 4H) – Stronger demand zone if a pullback occurs.
🔹 Resistance & Targets:
2930.3 (Swing High) – Liquidity target for buyers.
A breakout above 2930 could trigger further bullish momentum.
⚠️ Possible Scenarios:
📌 Bullish: A break above 2920-2925 could send price toward 2930+ liquidity.
📌 Bearish Pullback: A drop into 2907-2900 may present a buying opportunity before moving higher.
🛑 Final Thoughts:
The trend remains bullish , and as long as price stays above key FVG and OB zones, further upside is likely. Keep an eye on these levels for potential trade setups!

Shorting gold is a big win, and lower points are in sightLast week's non-agricultural data still did not show a big direction, and it is still moving around the high range. At present, short-term operations are still the mainstream. Don't blindly wait for a big drop. The high point last night is gradually lowering. The point of entering the range can be slightly adjusted according to market changes. The current upper resistance is mainly concentrated in the 2922-2926 area, while the lower side is strongly supported by the 2894-2890 range. If it rebounds above 2918-2925, continue to increase your position and short, with a target of 2910-2900.
You can read bottom signals, interpret daily market trends, and share real-time strategies, so you no longer blindly follow the trend.
Bearish and falling, the trend of gold is under your controlThe trend of the gold market is just as we expected, fluctuating around 2920. We decisively arranged a short position in gold and have already made considerable profits. The market is bearish, and all signs indicate that the price of gold is expected to further drop to around 2895. We will pay close attention to market dynamics and grasp the subsequent market in time.
You can read bottom signals, interpret daily market trends, and share real-time strategies, so you no longer blindly follow the trend.
xauusd Next 28% profit signal opportunity
Short-term XAUUSD trading signal analysis shows 2882 support for long positions, with tp reaching the target of 28%.
If you don’t know when to buy or sell, please pay close attention to the real-time signal release of the trading center or leave me a message, so that you can quickly realize the joy of profit. TVC:GOLD ICMARKETS:XAUUSD FOREXCOM:XAUUSD OANDA:XAUUSD

Go short first and then go longAnalysis of the latest trend of gold market:
Analysis of gold news: On Tuesday (March 11), spot gold rebounded slightly in the European session and is currently trading around $2909.09/oz. Overnight, the price of gold fell by 0.79%, falling below the $2900 mark. During the session, it once refreshed a low of nearly a week to $2880.19/oz. Zelensky visited Saudi Arabia, and the United States was optimistic about the talks between U.S. and Ukrainian officials. The market's concerns about the geopolitical situation have cooled down; in addition, the market value of the U.S. stock market evaporated by $4 trillion, increasing investors' demand for holding currency, further promoting gold bulls to take profits. This trading day focuses on the vacancies of the U.S. JOLTs in January. In addition, U.S. and Ukrainian officials held talks in Saudi Arabia
Technical analysis of gold:
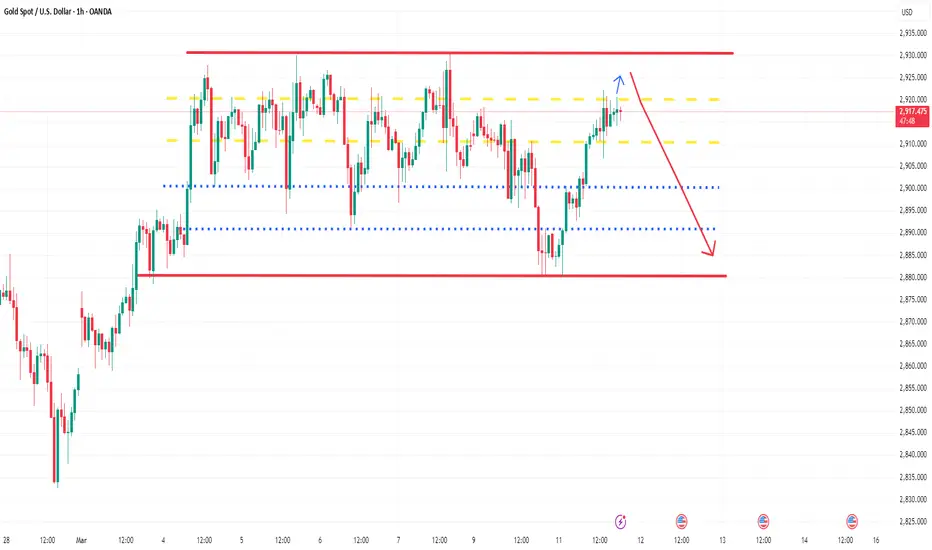
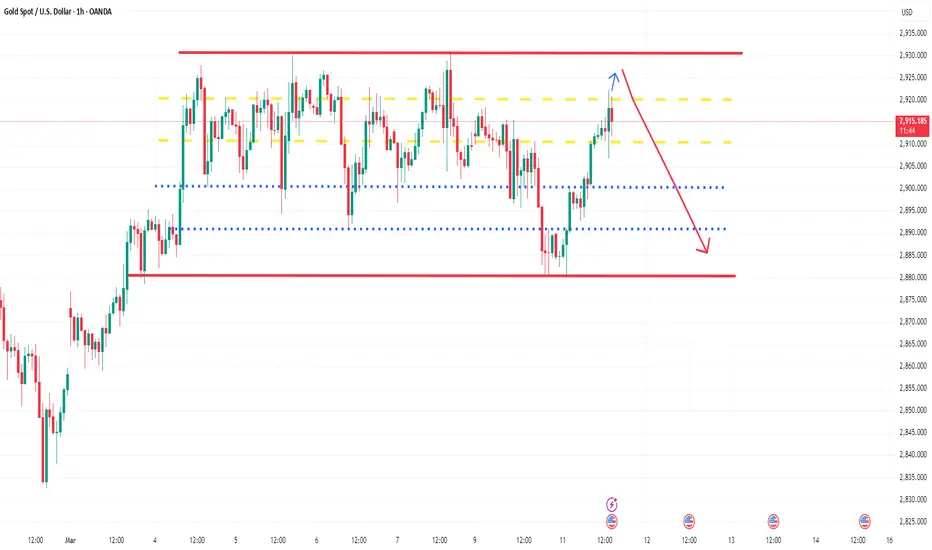
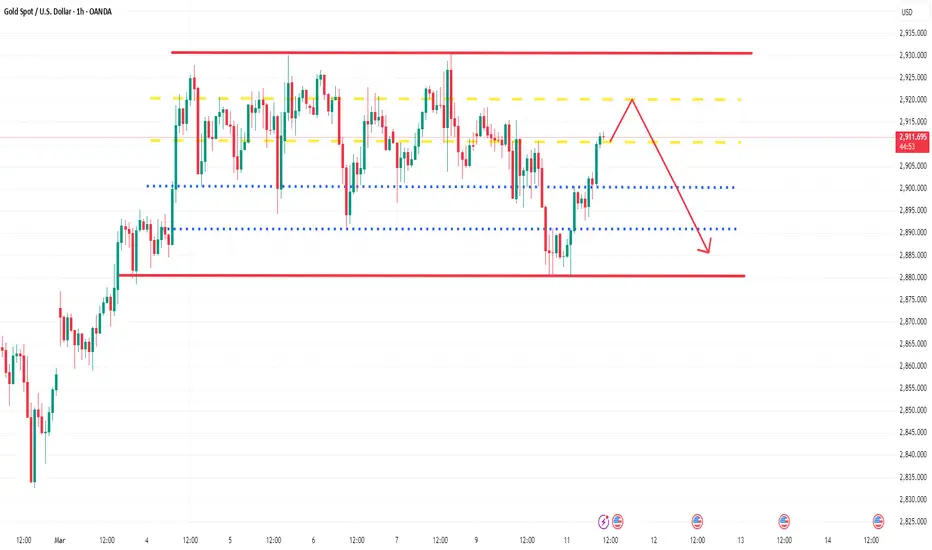
Gold rebounded after testing the support area near 2880 yesterday, and is currently touching around 2910. Gold looks relatively strong. However, gold has not been able to break through the 2920-2930 area for a long time recently. This area has formed an absolute suppression in the short term. In the process of testing support, gold has fallen below 2900 and even 2890 many times. It can be seen that the support below is not solid, and after repeated testing and breaking, the strength of the support below is gradually weakening.
Therefore, after gold rebounds to the 2910-2920 area, the rebound strength may weaken again, and after facing the previous short-term resistance, gold may fall again. Therefore, in short-term trading, we can still short gold in the 2910-2920 area. It is expected that gold will retest 2900-2980. If gold falls below this area during the test, it may even reach the 2870-2860 area.
You can read bottom signals, interpret daily market trends, and share real-time strategies, so you no longer blindly follow the trend.
XAUUSD, Expecting sell from 2913.3XAUUSD, I am Expecting sell from 2913.3 with lowertime frame confirmation of 1 minute with the targets of 2900 & 2885.
good luck

XAU/USD 11 March 2025 Intraday AnalysisH4 Analysis:
-> Swing: Bullish.
-> Internal: Bearish.
Analysis/Bias remains the same as analysis dated 07 March 2024.
Price has printed a bullish CHoCH according to analysis and bias dated 28 February 2025.
Price is currently trading within an established internal range.
Intraday Expectation:
Price is now trading in premium of 50% internal EQ where we could see a reaction at any point. Price could also target H4 supply zone before targeting weak internal low, priced at 2,832.720
Note:
With the Federal Reserve's dovish stance and persisting geopolitical uncertainties, heightened volatility in Gold is expected to continue. Traders should proceed with caution and adjust risk management strategies in this high-volatility environment.
Price could also be driven by President Trump's policies, geopolitical moves and economic decisions which are sparking uncertainty.
H4 Chart:
M15 Analysis:
-> Swing: Bullish.
-> Internal: Bearish.
Analysis and bias remains the same as analysis dated 03 March 2023.
As mentioned in my analysis dated 28 February 2025, whereby price printed a bullish CHoCH but stated I would continue to monitor price.
On this occasion I have marked the previous bullish CHoCH in red as price did not pull back deeply enough to warrant internal structure breaks, additionally, there was minimal time spent .
Price has printed a further bullish CHoCH which is now confirmed. Price is not trading within an established internal range.
Intraday Expectation:
Price to continue bullish, react at either premium of internal 50% EQ, or M15 supply zone before targeting weak internal low priced at 2,832.720.
Note:
With the Federal Reserve maintaining a dovish stance and ongoing geopolitical tensions, volatility in Gold prices is expected to remain elevated. Traders should exercise caution, adjust risk management strategies, and stay prepared for potential price whipsaws in this high-volatility environment.
M15 Chart:

XAUUSD, expecting sell from 2912.5XAUUSD, i am expecting sell from 2912.5 from M15 OB + LTF confirmation with targets 2900 & 2985

XAUUSD Strategy AnalysisCurrently, the overall gold market is on the weaker side. However, we should by no means chase short positions at low levels. Instead, we should wait for a rebound and look for opportunities to trade.
Resistance levels: 2925
Support levels: 2886
I will share accurate trading strategies every day, and the accuracy rate of the trading signals reaches 90%. Click on the link below the article to obtain the accurate signals.

XAUUSD Today's strategyAnalyzing from the current market situation, in terms of the daily chart, it closed down on Monday, effectively breaking through the support of the middle Bollinger Band. However, currently, the daily Bollinger Band is narrowing, and there is no obvious tendency of strength or weakness in the market. This means that the daily chart may not necessarily continue to close down today. If the daily chart closes up, the market may reverse and rise today; if the daily chart closes down again, forming three consecutive negative lines, then it may drop to a low of 2860 at the lowest, and then the possibility of long - short conversion can be explored. In the daily cycle, the key highs above are 2915 and 2930.
In the H4 cycle, after the decline on Monday, the Bollinger Band opened. Although the current market shows a certain pattern of unilateral weakness, attention should be paid to the cyclical changes today. If the price can stabilize above 2900 during the Asian and European sessions, the H4 cycle may form a low - level rebound, and the Bollinger Band will narrow again. At that time, the upward movement will be the main trend today, and the target above can be seen at the high of 2915 on Monday. If it fails to stand above 2900, the price of gold may continue to be weak and keep falling. In the unilateral weak market, it may drop to 2860. Therefore, the key to judging the strength or weakness of the market today lies in the gain or loss of the 2900 level.
From the perspective of the small cycle, the market tends to rise. As mentioned before, the bulls are still the main theme of the market at present. Therefore, the decline is an opportunity to go long. The hourly Bollinger Band is narrowing, and the 2880 level has not been broken after several tests. Then, opportunities to go long can be found above 2880. In the European session, it is expected that the price will rise above 2900, and in the American session, it is expected to hit the target of 2915.
Overall, in the short - term operation of gold today, it is recommended to focus on buying on dips and selling on rallies. Pay attention to the resistance level of 2920 - 2930 in the short - term above, and the support level of 2890 - 2880 in the short - term below.
XAUUSD sell @2915-2920
tp: 2880-2890
XAUUSD Buy @2880-2890
tp: 2915-2920
Traders, if you liked this idea or if you have your own opinion about it, write in the comments. I will be glad
If you also aspire to achieve financial freedom,Follow the link below to get my daily strategy updates
Market profits and losses fluctuate, and profits finally landHowever, with accurate judgment and reasonable decision-making, I closed the existing long positions in time to lock in profits when I arrived at the area. In the end, the overall result was still satisfactory profit. It was a victory in grasping the trend. Friends who followed me to do long positions in the 2880-2910 area many times, although they did not achieve the expected results, were still profitable overall. I earned more than 16k in this long position, which is a good trading result. It has been proven to be effective. Others are still waiting and watching, and I directly hit hard and did long gold many times. What if the market did not go completely according to the script? Relying on my years of market analysis and bold operations, I still made a lot of money, and my strength crushed the doubts! For trading strategies for subsequent markets, you can read my previous article. I hope to help everyone and provide you with a clear direction.
You can read bottom signals, interpret daily market trends, and share real-time strategies, so you no longer blindly follow the trend.

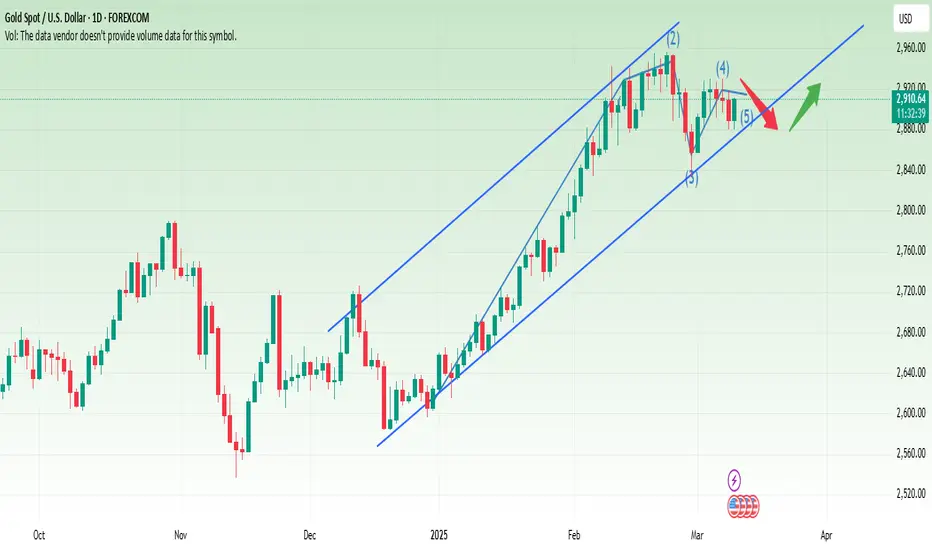
The medium- and long-term bullish trend of gold remains unchangeThe daily chart shows that the non-farm payroll data that was lower than expected has strengthened the market's expectation that the Fed will slow down the pace of interest rate hikes, pushing the gold price to form a staged bottom support. The current short-term moving averages (such as the 5-day and 10-day moving averages) tend to stick together and fail to effectively guide the direction, while the MACD indicator has entered a correction cycle, and it may be difficult to quickly expand the gains in the short term. In terms of operation strategy, it is recommended to adopt the idea of "pullback and long". If the gold price falls back to the 2890-2885 range, long orders can be arranged, and the target is above 2920. It should be noted that if the previous high point is not effectively broken through, it may trigger the risk of a second bottoming out. If the target area reaches the 2903-2905 area, we can close the existing long positions first and lock in profits in time. On the whole, although there is a certain adjustment pressure on the short-term technical side, the medium- and long-term bullish trend has not changed fundamentally. Geopolitical risks and expectations of a shift in the Fed's policy still provide solid support for gold prices.
You can read bottom signals, interpret daily market trends, and share real-time strategies, so you no longer blindly follow the trend.

GOLD MARKET OUTLOOK – MORE DOWNSIDE BEFORE A MAJOR MOVE?🔥 GOLD BREAKS SUPPORT – IS A FURTHER DROP COMING? 🔥
📌 Market Overview
As expected in our previous analysis, Gold has broken below its key range, confirming a bearish momentum. The current price action suggests another potential drop toward the 285X zone, before any major rebound. For now, the focus remains on SELL setups as long as this breakdown holds.
👉 Market sentiment remains cautious as investors take profits and reduce risk exposure ahead of crucial U.S. inflation data.
📊 FUNDAMENTAL FACTORS DRIVING GOLD
💡 Trump’s Tariff Policies & Market Uncertainty
U.S. President Donald Trump introduced a 25% tariff on imports from Mexico & Canada on March 4th, along with additional tariffs on Chinese goods.
Just two days later, he partially reversed his decision, suspending tariffs on Mexican imports and select Canadian products for one month.
This inconsistency in policy is adding uncertainty to the markets, reinforcing Gold as a safe-haven asset.
💡 Investors Awaiting U.S. Inflation Data
Traders are holding back from taking aggressive positions before the release of key U.S. inflation figures.
Higher-than-expected inflation would strengthen the USD, pushing Gold lower.
Weaker inflation data could trigger renewed bullish momentum in Gold, potentially driving it toward new all-time highs.
📉 TECHNICAL ANALYSIS – KEY LEVELS TO WATCH
🔹 Major Resistance Levels:
2,905 - 2,912 - 2,919 - 2,927
🔻 Major Support Levels:
2,866 - 2,858 - 2,845 - 2,825
🎯 TRADE SETUPS FOR TODAY
🔵 BUY ZONE: 2,846 - 2,844
📍 SL: 2,840
🎯 TP: 2,850 - 2,854 - 2,858 - 2,862 - 2,866
🔴 SELL ZONE: 2,825 - 2,827
📍 SL: 2,830
🎯 TP: 2,820 - 2,816 - 2,812 - 2,808 - 2,800
⚡️ CONCLUSION
📌 Gold remains in a downtrend after breaking key support – watch for further downside before a potential bounce.
📌 Investors remain cautious ahead of inflation data, while Trump’s trade policies add more volatility to the markets.
📌 Stick to TP/SL strategies to manage risk and protect your capital!
📢 Do you think Gold will drop further before a rebound? Share your thoughts below! 🚀🔥

Choppy Gold Price Action: Bearish Bias, But With CautionIn my post yesterday, I mentioned that Gold would likely break below the 2900 support zone.
Indeed, after multiple tests and annoying price action, the price finally dropped below this level, reaching an intraday low of 2880. However, it quickly reversed and is now trading back around the same level.
To be honest, while my outlook remains slightly bearish, this kind of choppy movement is not ideal.
In conclusion, my strategy remains to sell on rallies—but with caution and lower volumes.
Disclosure: I am part of Trade Nation's Influencer program and receive a monthly fee for using their TradingView charts in my analyses and educational articles.

Gold is still expected to hit the 3,000 markFrom the analysis of gold trend, we focus on the 2880-2870 first-line support below and the 2930-35 first-line suppression above. In terms of operation, we still focus on stepping back and doing long. In the short term, we can continue to do long around this range. Once a breakout of 2930-2935 occurs, gold will inevitably touch the previous high, or even reach 3000.
The fluctuations in the gold market are like a long journey. It has not yet reached its peak, but please believe that every hibernation is for a more powerful take-off. Patiently hold, the harvest often belongs to those who can keep calm, hold on, and victory is ahead.
You can read bottom signals, interpret daily market trends, and share real-time strategies, so you no longer blindly follow the trend.

The trend of gold is all within my predictionThe market fluctuated and was complex, but gold responded accurately to my prediction. It rebounded quickly after reaching the area around 2980, and every step was performed as expected.

XAUUSD: +410 Pips From Last Idea, Further Drop Expected! As we had anticipated price to drop, it did exactly that. Price dropped from our order block area with 410+ extreme drop. We now expect further drop. Read the chart for more information.
Thank you!
❤️

XAUUSD: $2905 TO $2800 A thousand pips move! One not to miss! Gold is currently in distribution phase and is likely to drop further since price currently testing the supply area and might drop from the area that we have shown. Like and comment for more.
Want more then like and comment our ideas which will encourage us to post more.❤️

Seize the opportunity to go long on goldTechnical indicators send strong signals, and the gold rising channel has been opened. At this moment, you should decisively go long and follow the trend, so that your wealth can ride on this wave of gold bull market and soar all the way.
You can read bottom signals, interpret daily market trends, and share real-time strategies, so you no longer blindly follow the trend.

RSI is oversold, suggesting a bottom-picking signalAlthough the unexpected cold non-farm data last Friday failed to push gold prices above the key resistance of $2,930, the logic of gold's rise has not been shaken - the five core supporting factors of global central banks' increased holdings, continued inflows of ETFs, surge in demand for physical gold, deepening of the U.S. debt crisis and excessive money supply are constantly consolidating the long-term bull market foundation of gold. From a technical perspective, the daily MACD maintains a golden cross and the energy column expands. The weekly big positive line has established a medium-term upward trend. 2,990 is only the first target, and 3,000 or even higher may become the new normal.
The short-term market is in a volatile adjustment, but this is a necessary accumulation stage for a healthy rise. The current gold price is repeatedly pulling back in the range of 2,918-2,890, which is essentially a process of digesting previous profit-taking and waiting for new catalytic events. If it can effectively stand firm at the key support of $2,890, it is expected to restart the upward trend and challenge the historical high. It is worth noting that against the backdrop of the continued rise in expectations of the Fed's interest rate cuts, the spillover of geopolitical conflict risks and high global inflation, the dual attributes of gold's "anti-inflation + safe-haven" will continue to attract capital inflows. The general trend is still mainly to go long after falling back to lows.
Gold strategy suggestion: continue to go long after falling back to around 2900-2910.
