GOLD BULLISH MOMENTUM SOONGold recently touched its all time high 3500 but it reversed immediately
so we expecting gold to go bullish it surpass the highlighted supply zone and bearish if its below it
Xauusdupdates
#XAUUSD: Major Update 01/05/2025, Read Description! Gold has dropped over 700 pips since yesterday evening, suggesting further price correction. This is primarily due to strong US dollar data indicating potential correction in DXY Index prices. Additionally, there are speculations that the US has reached out to China for trade talks, although this has not been confirmed. Today and tomorrow are major trading days, with significant news expected to shape gold prices.
For now, you can monitor the prices or take entry if they reach your chosen risk management area. The decision to enter or exit is entirely up to your analysis.
Good luck and trade safely!
Thank you for your unwavering support! 😊
If you’d like to contribute, here are a few ways you can help us:
- Like our ideas
- Comment on our ideas
- Share our ideas
Team Setupsfx_
❤️🚀

Gold’s short trend intensifies! Main empty follow up.📌Fundamentals:
📊Technical aspects:
Gold, the price of this round has fallen from the historical high of 3500. After the first round of selling to 3260, it rebounded and repaired 3370; it rebounded to 3358 during the week and then weakened again. The Asian market opened with a rapid sell-off below 3260 and is now trading around 3234; the short position in each cycle is good, and the pre-non-agricultural market continues to be bearish. The target is adjusted to the parallel attack and defense range of 3193-3168.
Short-term resistance 3235-3240, strong resistance 3246-3250, 3260 is not expected to arrive; short-term support 3220, strong support 3210-3194.
🎯Practical strategy:
Recommendation to short on rebound: short around 3240-3250, target 3220-3200.

How to trade when ADP comes?The selling opportunity was announced earlier. XAUUSD successfully reached TP3306 and 3280.
It is predicted that the market will reach 3250 again. So now is a good time to sell.
When ADP is bullish. Continue to short after the rebound. If it is bearish. Then go short. The target is 3250-3230

No Bottom Yet: Gold’s Technical Targets Point LowerSince Monday, I’ve been saying that Gold hasn’t finished correcting, and the price action is now confirming that view. The drop continued with breaks below two key levels: the 3300 figure and the 3270 support, which was the recent low.
After some sideways action (a bit of a limbo), we finally got the clean breakdown. At the time of writing, price sits at 3248, having just bounced slightly from the 3240 support, which aligns with mid-April’s ATH.
Now comes the big question: Is Gold done correcting?
In my opinion, not yet – and here’s why:
Technical reasons for further downside:
1. The break below 3270 is significant and opens the door to deeper correction.
2. We now have two measured targets:
📉 Measured range target: ~1000 pips → puts price below 3200.
📉 First leg down: ~2500 pips → could push price closer to the 3000 zone.
Trading Plan:
The strategy remains unchanged: sell the rallies. As long as price stays below 3270-3290 zone, downside continuation is the base case.
A move towards at least 3200 looks very probable – and deeper levels can't be ruled out.
Don’t rush to call a bottom – let the market show when the correction is really done. Until then, the bias stays bearish. 🚀
P.S: Expect great volatility to remain
Disclosure: I am part of Trade Nation's Influencer program and receive a monthly fee for using their TradingView charts in my analyses and educational articles.

Gold key resistance not broken, Continuation of weak shock!📌 Pattern analysis and attention:
📊Technical aspects: The current golden week maintains a range of 3260-3360 fluctuations, showing a weak oscillation pattern of falling first and then rising, but with stronger downward momentum. Technical aspects show that 3360 is a short-term long-short watershed. If it cannot be broken through, it will maintain low-level fluctuations; 3340 is the core key position. If it stands firm, it will turn into a strong oscillation, otherwise it will continue to be weak. The first two days of the week closed below 3320, confirming short-term weakness.
🎯Practical strategy: Short sell when it rebounds to 3320-3325 area, target 3310-3300.

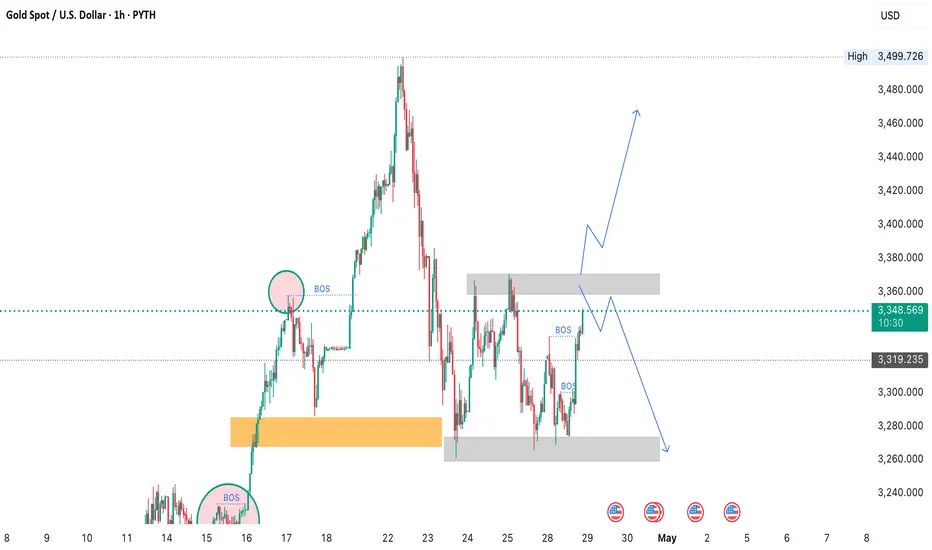
(XAUUSD) against the U.S. Dollar on a 1-hour timeframe.Chart Details:
Instrument: Gold Spot (XAUUSD) vs. US Dollar.
Timeframe: 1-hour (1H).
Date/Time: Chart taken around April 28, 2025, 18:22 UTC.
Current Market Price (CMP): About $3,339.72.
Spread: Bid at $3,339.64 / Ask at $3,339.94 (small spread = good liquidity).
Key Features:
Trend Before: Recent sharp downtrend (visible on the left) — price dropped significantly from a previous high.
Current Structure:
After the fall, the price seems to have stabilized in a sideways range (accumulation).
Small higher highs and higher lows have started forming (early signs of reversal).
Zones Highlighted:
Reversal Zone at the bottom (around $3,246) — suggesting strong support.
Entry Range: Around $3,337–$3,339 (where the price is currently consolidating).
Stop-Loss Area: Below $3,289.
Target Areas:
First Target (TP1): around $3,379.63.
Final Target (TP2): around $3,500 (just below ATH).
Projected Path (marked with arrows):
A small dip toward support (near $3,289).
Then a strong rally upward, breaking current resistance levels.
Technical Interpretation:
Type of Setup: Buy (Long).
Risk-Reward Ratio: Very favorable — small stop loss compared to a large upside potential.
ATH (All-Time High): If price breaks $3,500, it would be entering price discovery mode (no historical resistance).
Other Observations:
Candlestick Pattern: Small bullish candles with wicks indicate buying pressure.
Volume: Not visible here, but volume would ideally confirm the breakout.
Indicators: No moving averages, RSI, or MACD are shown — purely price action based.
In short:
The trader is expecting a short pullback, then a bullish continuation toward a new all-time high (ATH).

Gold Key Points Summary How to grasp the end of the monthly line📌Fundamentals:
Trade policy easing and dollar rebound
Economic data and Fed policy game
Russia-Ukraine conflict and Middle East situation
📊Technical aspects:
From the 4-hour analysis, the upper side continues to focus on the short-term suppression of the 3328-35 line, focusing on the 3345-56 first-line suppression. During the day, the counterattack relies on this position to continue to bearish and continue to fall. The lower support is around 3290-85, and the short-term long-short strong and weak watershed is the 3260-65 first-line mark. Before the daily level does not fall below this position, we will continue to see long and short shocks, and the high-altitude low-multi cycle will mainly participate.
🎯Practical strategy:
1. Go short when gold rebounds at 3328-35, and cover short positions when it rebounds at 3343-52. Target 3310-3315, and look at 3275-80 if it breaks;

3265 is a strong support level for the current price of gold3265 is a strong support level for the current price of gold
Before today's data release, the market situation was in line with our previous analysis, and the trading strategy was still mainly focused on short selling. The previous market trends have shown that the price level of 3,265, as a strong support level, has been verified as effective on multiple occasions. When the price approaches around 3,265, and at the same time, favorable news emerges, which aligns with the support level we have analyzed, we should quickly seize the opportunity and decisively execute long positions ⏱️. We must always maintain a keen sense of observation to be able to flexibly respond to the rapidly changing market fluctuations
⚡️⚡️⚡️ XAUUSD ⚡️⚡️⚡️
🚀 Sell@3330 - 3320
🚀 TP 3300 - 3280
🚀 Buy@3265 - 3275
🚀 TP 3300 - 3310
Accurate signals are updated every day 📈 If you encounter any problems during trading, these signals can serve as your reliable guide 🧭 Feel free to refer to them! I sincerely hope they'll be of great help to you 🌟
XAUUSD: Gold Once Again Back To $3270 Region, What Next ? Gold has once again backed to the 3270 region and rejected it, currently trading at 3280$. The main question is whether gold will hold on to this level. If not, we could see a strong sell-off taking the price to 3130. This is because the sellers’ presence has increased, and the price has been volatile due to mixed news and economic data, further strengthening the bears’ position in the market.
Despite this, we remain optimistic that gold will continue its bullish move upwards. There’s a strong reason for this: we may see all-out war happening in Asia, although this is purely speculative. For now, you may decide to continue monitoring the price or even take a swing buy, which could be risky.
Given the volatility of gold, we recommend trading cautiously and taking extra precautions while trading gold.
Wishing you good luck and safe trading!
Thank you for your support! 😊
If you’d like to contribute, here are a few ways you can help us:
- Like our ideas
- Comment on our ideas
- Share our ideas
Team Setupsfx_
❤️🚀

#XAUUSD: 676+ Pips Since Our Last Entry! Comment Your Views! As we explained in our previous chart, the price will retouch 3270$ and then continue the bullish movement. The price did exactly that, with a 674+ increase from our last idea. It’s now on the way towards $3500 or beyond. Get ready for a big move on gold this week, but be extra cautious as the price can be volatile.
Good luck and trade safely!
Thank you for your unwavering support! 😊
If you’d like to contribute, here are a few ways you can help us:
- Like our ideas
- Comment on our ideas
- Share our ideas
Team Setupsfx_
❤️🚀

XAUUSD: Intraday Bullish Move Up To $3400! The OANDA:XAUUSD price has shown strong bullish momentum, indicating it will likely continue to rise above $3400. However, the price is currently volatile and is likely to remain so.
Good luck and trade safely!
Thank you for your unwavering support! 😊
If you’d like to contribute, here are a few ways you can help us:
- Like our ideas
- Comment on our ideas
- Share our ideas
Team Setupsfx_
❤️🚀

Gold continues to fluctuate widely, mainly long at low levelsAs gold broke below the 3300 mark in the European session, the market once again tested the 3270 first-line support, which is the edge of the lower track of the channel.
rading idea: Go long gold near 3270, with a strict stop loss of 3267 and a target of 3300

Shock ahead for data treats goldGold opened this week in a volatile market. It opened high and fell on Monday. The US market rose above the high opening position. It fell in the Asian market on Tuesday. The European and American markets fluctuated and adjusted. The main reason is that the data this week was concentrated in the second half of the week. From the past market, this week's rebound did not reach 3370, so it cannot be treated as strong. It did not fall below the bottom support of 3260. The overall trend is a convergent and volatile trend. Now the technical indicators are in a sticky posture, and the three lines of the Bollinger Bands are also closed. The Asian market mainly focuses on the continuation of the volatility. The upper side focuses on the resistance of the hourly Bollinger Band upper track 3330, and the lower support is at 3300.

GOLD Locally Overbought!
HI,Traders !
GOLD is trading in a
Strong uptrend but the
Pair is locally overbought so
After the retest of the
Horizontal resistance level
Of 3350.56 from where
We will be expecting a
Local bearish correction !
Comment and subscribe to help us grow !

Gold Plan: Waiting for the 1000 Pips Drop UnderwayYesterday, I highlighted that the 3280 support zone looked fragile and warned of a potential breakdown.
However, once New York opened, bulls stepped in aggressively, pushing Gold above Friday’s close and triggering my stop loss along the way.
Key Question:
Has the bullish momentum changed the bigger picture?
Why I Still Expect a Drop:
- Despite yesterday's green close, the broader structure remains bearish.
- The 3370 resistance zone is still intact, and Gold is vulnerable under it.
- My target remains a move under 3280, aiming for the 3200 area.
T rading Plan:
I will continue to look for selling opportunities, especially on spikes toward resistance zones, targeting a 1000 pips move down.
Final Words:
The market needs to confirm the plan, but patience and discipline will bring the 🚀 in the right direction!
Disclosure: I am part of Trade Nation's Influencer program and receive a monthly fee for using their TradingView charts in my analyses and educational articles.

XAUUSD Analysis todayHello traders, this is a complete multiple timeframe analysis of this pair. We see could find significant trading opportunities as per analysis upon price action confirmation we may take this trade. Smash the like button if you find value in this analysis and drop a comment if you have any questions or let me know which pair to cover in my next analysis.

XAUUSD quick BUY tradeHi fellow traders, XAUUSD will be ready to make a move higher from the blue box after completing the correction. Target the 3334.67 level. Good luck and trade safe!

Gold Stuck in Limbo- Sell Rallies, Ride the DropAfter the explosive rally that pushed Gold up to the 3500 area, the market quickly reversed with a sharp sell-off on April 22–23, dropping almost 2500 pips.
Since then, price has entered a consolidation phase.
Initially, the range was between 3270 and 3370, but since yesterday, the range has started to tighten — a classic sign that a breakout is approaching.
Looking at the structure, we’re dealing with a blow-off top followed by a range with clear support and resistance levels. In this context, I lean toward a downside breakout.
The key support is now at 3300 — and a break below it would likely expose 3270 again.
However, I don’t expect the move to stop there. If 3300 is broken, a continuation toward the 3200 zone becomes very likely.
🔹 Trading Plan:
As long as price stays below the 3360–3370 resistance zone, the strategy is to sell rallies, especially when price approaches the upper boundary of the range. Entries can be taken on rejection candles or confirmation patterns near resistance, with stops just above 3370. If 3300 breaks, watch for continuation setups toward 3200.
Only a sustained breakout above 3370 with strong bullish momentum would invalidate the bearish scenario and call for a reassessment.
Disclosure: I am part of Trade Nation's Influencer program and receive a monthly fee for using their TradingView charts in my analyses and educational articles.

XAU/USD 30 April 2025 Intraday AnalysisH4 Analysis:
-> Swing: Bullish.
-> Internal: Bullish.
Analysis and bias remains the same as analysis dated 23 April 2025
Price has now printed a bearish CHoCH according to my analysis yesterday.
Price is now trading within an established internal range.
Intraday Expectation:
Price to trade down to either discount of internal 50% EQ, or H4 demand zone before targeting weak internal high priced at 3,500.200.
Note:
With the Federal Reserve's dovish stance and persisting geopolitical uncertainties, heightened volatility in Gold is expected to continue. Traders should proceed with caution and adjust risk management strategies in this high-volatility environment.
Price could also be driven by President Trump's policies, geopolitical moves and economic decisions which are sparking uncertainty.
H4 Chart:
M15 Analysis:
-> Swing: Bullish.
-> Internal: Bearish.
Analysis and Bias remains the same as analysis dated 24 April 2025.
Price printed as per my note yesterday whereby I mentioned that we should be surprised if price printed a bearish iBOS as all HTF's require a pullback.
Price subsequently printed a bearish iBOS which confirms internal structure.
Intraday Expectation:
Price has traded up to just short of premium of internal 50% EQ where we are seeing a reaction. Price could potentially trade further into premium of 50%, or H4/M15 nested supply zone before targeting weak internal low priced at 3,260.190.
Note:
With the Federal Reserve maintaining a dovish stance and ongoing geopolitical tensions, volatility in Gold prices is expected to remain elevated. Traders should exercise caution, adjust risk management strategies, and stay prepared for potential price whipsaws in this high-volatility environment.
Trump's tariff announcement will most likely cause considerably increased volatility and whipsaws.
M15 Chart:

Gold is still on a volatile downward trendGold continues to fluctuate in the 1-hour chart, and the amplitude of fluctuations is beginning to narrow, which indicates that a change is getting closer. As for gold's current fluctuations, it is still in a downward trend.
Trading idea: short gold near 3318, stop loss 3330, target 3300

Gold price up or down?Gold has been fluctuating at the bottom in recent days. The large range is obviously 3260-3370, and the small range changes every day. On Tuesday, it was 3352-3300. The overall trend was first falling and then rising, but the decline was stronger than the rise. For the time being, gold is still weak. On the upside, pay attention to the break of 3370. If 3370 breaks, look at 3420-3500. The operation idea remains unchanged. Today, we still look for low points to go long. The support below the small cycle is around 3300-3280. These two supports are necessary points for going long today.

XAU/USD: Accumulating Strength and Awaiting a BreakthroughFrom the perspective of intraday trading rhythm, gold has continued its recent pattern. It rose sharply in the morning and then declined, fluctuated during the European trading session, and stabilized and surged during the US trading session. Based on this rhythm, today we can mainly focus on the effectiveness of the support level at $3,300. If this support level can still hold after the fluctuations in the European trading session and the price stabilizes at this level during the US trading session, one can consider going long on dips. As the consolidation period continues to lengthen and the trading range keeps shrinking, it indicates that the market is about to break the current volatile pattern. After the impact of Trump's tariff policies gradually fades away, the market is re-pricing gold, and it is inevitable that the trend will be erratic during this process.
Regarding the subsequent trend, we should focus on how gold tests the resistance levels above. Once it breaks through $3,330 and even further breaks through $3,352, it will signal that the bottom structure is becoming more stable. The current repeated fluctuations are actually about constructing a new upward support platform, laying a solid foundation for the subsequent upward trend.
Overall, there is no need to be overly concerned about the short-term fluctuations, as the overall upward rhythm of gold has not changed. Investors can closely monitor the breakthrough of key levels and seize trading opportunities.
XAUUSD
buy@3290-3300-3310
tp:3300-3340-3350
I am committed to sharing trading signals every day. Among them, real-time signals will be flexibly pushed according to market dynamics. All the signals sent out last week accurately matched the market trends, helping numerous traders achieve substantial profits. Regardless of your previous investment performance, I believe that with the support of my professional strategies and timely signals, I will surely be able to assist you in breaking through investment bottlenecks and achieving new breakthroughs in the trading field.
