Bitcoin's Graceful Elliott Wave Dance: Dips, Peaks, and Twists!Dive into our captivating Elliott Wave analysis for Bitcoin, as we unravel the complex journey from a staggering $69k peak to a potential dramatic fall. Discover how we navigate the intricate waves, predicting a short-term dip to FWB:25K before surging to $35k-$40k. But brace yourself – we're foreseeing a massive plunge to $3k- FWB:250 as the grand finale! Don't miss this eye-opening forecast and learn how the unfolding 2nd wave could impact your crypto investments.
And this is my harmonic analysis it have the same view.
Xbt

RWA narrative
Real-world assets, is heating up more and more. BlackRock CEO says RWAs will be a major usecase for crypto
If you want to start exploring this niche, this sampling will help you a lot.
Here you will find links to the Twitter accounts of the RWA projects highlighted in the panorama.
Messari PRO recently released an interesting mini-report outlining how RWAs are invading the classic financial sector.
Over the past few months, traditional funds and asset issuers have launched alternative asset tokenization programs via public crypto-networks. Recent asset releases have revived interest in real-world asset portability (RWA) onchain and opened up new revenue opportunities within decentralized finance (DeFi).
Private equity firm Hamilton Lane has partnered with Securitize, a digital asset release platform, to tokenize part of its $2.1 billion flagship equity fund on the Polygon network. The fund requires a minimum investment of HKEX:20 ,000, well below the typical minimum buy-in (fund entry) of HKEX:5 million for private investors.
Hamilton Lane is one of the largest private wealth managers, investing more than HKEX:37 billion in private markets in 2021. It manages SWB:824 billion in assets.
Similarly, the Monetary Authority of Singapore (MAS) announced Project Guardian, a pilot program to tokenize bonds and deposits that can be used in various DeFi strategies.
A bank participating in the program will be able to tokenize bonds and deposits that can be used in permitted liquidity pools. This capital can be lent in DeFi applications such as Aave and Compound to earn interest or as collateral to access credit. The pilot has attracted JPMorgan, DBS Bank and Marketnode as initial partners.
Broader Context
Since the first DeFi protocols began gaining momentum in 2020, they have been a driving force in attracting users and traders into the crypto space. DeFi experiments have enabled innovative financial applications such as decentralized automated market makers, stackablecoins, credit, insurance, swaps, synthetic assets, and derivatives.
Total locked-in value (TVL) in DeFi applications, conventionally translated as the amount of capital under management, has skyrocketed to a peak of HKEX:248 billion in December 2021 as asset prices rise and new users are attracted. TVL is supported by liquidity mining programs in which protocols drive growth by temporarily increasing returns by offering users rewards in the form of native protocol tokens, such as Compound rewards lenders with COMP tokens.
These returns have been volatile as token prices have fallen and overall interest in crypto has declined during the 2022 bear market. Historic USDC Stablecoin credit rates peaked in December 2020 at 18% for Aave and 8% for Compound. Those yields fell to 0.75% and 1.62% today, respectively.
As the yield on one-year U.S. Treasuries is around 5%, investors have rushed into safe government securities. Treasury bond yields rose sharply as the Federal Reserve abandoned its zero interest rate policy, with the one-year bond up from the 0.3% yield in December 2021.
As the risk-free interest rate in traditional finance has risen and DeFi yields have declined, investor participation in the latter has declined significantly in recent months, with TVL down more than 75% from its December 2021 high to HKEX:52 billion today.
To attract new capital, DeFi protocols are beginning to use RWAs as a source of collateral or new investment opportunities, providing more stable returns for investors.
Tokenization of real assets, such as real estate, commodities, private equity and credit, bonds and art, is a concept that has been quietly seeping in since 2018. RWAs take advantage of blockchain technology for the on-chain introduction of traditional assets.
Key quote:
"RWA tokenization offers tangible benefits, including lower minimum investment and increased access through shared ownership, increased trading of previously illiquid assets, increased transparency and security as blockchain records an unchanging record of transaction history, and automated ownership management and compliance."
Key statistics:
When the seven largest private credit blockchain-RWA protocols are combined, the historical loan value is $4.2 billion and active loans are HKEX:456 million. These protocols use DeFi to provide private loans to businesses and include Maple, Centrifuge, Goldfinch, Credix, TrueFi, Clearpool and Ribbon Lend. They offer an average APR of 12.63%.
Outlook and Implications
DeFi must offer higher returns than traditional investments to remain competitive and attract capital. DeFi applications such as Maple Finance, Goldfinch and Centrifuge pool cryptocurrency holders' funds and lend them to generate income through different strategies.
Maple Finance is a platform for institutional borrowers to leverage the DeFi ecosystem for loans with insufficient collateral. Pool Delegates are loan officers who create and manage pools on the platform and find institutional borrowers by structuring terms for each loan pool. Lenders can then contribute crypto funds to the pools they want to support by lending their assets in exchange for income. To date, Maple has made cumulative loans of nearly $1.8 billion.
Goldfinch is in the business of making loans to real businesses in emerging markets. Borrowers must be audited to determine their loan eligibility. Once approved, they can create pools and determine loan terms such as interest rate, loan amount, term and late fees. Lenders can grant capital to individual pools at their discretion and be the first to bear capital losses on impaired loans, thereby earning higher profits. Alternatively, liquidity providers can provide capital that is distributed to all pools of borrowers, earning lower returns with less risk of capital loss.
While Maple and Goldfinch focus on private lending, Centrifuge allows more forms of real assets, such as real estate loans and freight accounts, to enter the DeFi ecosystem. On a Centrifuge trading platform called Tinlake, the creator converts a real asset into a non-transferable token (NFT) and includes the appropriate legal documentation. Asset pools are created using NFTs as collateral representing RWAs. Investors can then provide capital to pools that match their risk preferences.
Real asset tokenization allows DeFi to enter some of the largest financial markets. Global real estate was valued at HKEX:327 trillion in 2020 and non-financial corporate debt at more than HKEX:87 trillion in 2022. These are colossal markets to which tokenization could bring increased liquidity and new investors.
Decision Points
When evaluating income opportunities, investors should examine the track record of existing DeFi-applications that use real assets. Have they defaulted? What is the underwriting and due diligence process and how do they manage risk? Underwriters that require borrowers to over-collateralize, have access to insurance, or have support mechanisms in place in the event of default may perform better over time.
Notably, Maple Finance had a HKEX:36 million loan default in December 2022 in one of its loan pools. The borrower, Orthogonal Trading, suffered a loss because of the FTX collapse. In response, Maple launched version 2.0, which introduced a faster default and liquidation process for loans that failed. This points to the need for better risk parameters and sector diversification among borrowers for credit DeFi platforms with insufficient collateral, such as Maple.
Instead of lending capital directly, investors can also bet on the success of DeFi-oriented RWAs by buying their own tokens. The prices of these tokens will correlate with the rest of the crypto market, but may show greater value for winning platforms.
What's causing this boom? Many protocols that previously offered volatile yields have now reduced yields, and as the government offers more attractive yields through bonds, there is a shortage of new capital. By offering RWAs as a source of collateral, DeFi is opening its doors to the broader financial market of non-cryptocurrency natives. Having assets backed in part by RWAs also reduces risk for cryptocurrency lenders.
We can expect more and more institutions to adopt tokenized RWAs ), as seen by JPMorgan executing its first real-time trade using tokenized yen and the Singapore dollar at Polygon in November. Hong Kong Central Bank is now offering tokenized green bonds, and other investment banks such as Credit Agricole CIB and SEB are collaborating to develop a platform for digital bonds.
If you have read this far you are wondering what will happen to bitcoin, we are close to the dates I said in November 2022. I was talking about April-May correction. it is really going to happen, just like a rock we are unlikely to fall before we have to liquidate most of the short positions. so i expect a slight correction upwards 29200-30050 area
Best regards EXCAVO

Bitcoin Bearish Divergence AnalysisBTC/USDT 4H Chart Analysis: Bearish Divergence Indicates Possible Retracement
Bitcoin is currently trading at $30500 against the USDT. A 4-hour chart analysis indicates the possibility of a retracement due to the bearish divergence and RSI bearishness. This article will provide a detailed analysis of the 4-hour chart and highlight the support and resistance levels to watch out for.
4H Chart Analysis:
The 4-hour chart of BTC/USDT shows bearish divergence, indicating a potential retracement. The last 4-hour candle has also closed, indicating a possible continuation of the retracement. The Relative Strength Index (RSI) is also bearish, adding to the probability of a downtrend.
Support and Resistance Levels:
Based on the 4-hour chart analysis, the support levels to watch out for are $29929 and $29071. On the other hand, the resistance level is at $30650. These levels should be monitored closely as they will determine the direction of the market.
Takeaways:
The 4-hour chart analysis of BTC/USDT shows bearish divergence.
The RSI is bearish, supporting the possibility of a downtrend.
The support levels to watch out for are $29929 and HKEX:29071 , while the resistance level is at $30650.
Conclusion:
In conclusion, the 4-hour chart analysis of BTC/USDT indicates the possibility of a retracement due to the bearish divergence and RSI bearishness. Traders should closely monitor the support and resistance levels provided and exercise caution when trading. As always, it's essential to have a stop loss in place to mitigate potential losses.
Hey, it's CryptoPatel here!
I'm passionate about providing you with the latest insights and analysis on the world of cryptocurrencies.
If you enjoy my content and want to show your support, please like, share, and follow me for more high-quality updates.
Thank you for your support, and let's continue to stay connected for more exciting content!
LIKE
Share
Follow

Bitcoin time analysis cycle based on machine learningcycle Analysis this Should Happen in the Coming Years i will update it every week until the cycle in black color end good luck .

Why I Believe BTC and The Crypto Market Is Heading HigherHello all!
As I was recording this video, BTC has made a new yearly high!
Hope you all enjoy!
Thanks!

[Bitcoin] ready to rise againDespite the FTX affair wich caused a new low, I believe BTC is ready to rise again due to bullish technical factors:
- many bullish divergences in W, 3D, D, 4h
- end of the big falling wedge (throwback completed)
- new small falling wedge (dashed lines)
- historical technical supports (Price, MACD, Disparity index)
- blue pill (Hash Ribbons indicator)
- bottom found (Puell Multiple indicator)
- reversal signal (Network Value to Transactions ratio)
Of course, in the event of another major crisis, BTC will fall sharply again.

Bitcoin 2nd Break out Soon?Bitcoin has been in a downtrend for some time now, recently been moving upwards and now it has encountered a second resist in my book, it broke out the downtrend from ATH line but now we have a candle close break-out pending. Once this break out, I am measuring last major touch on line led to a strong move downwards, i will use that same line to put towards the breakout giving me a idea where price might head to from the breakout.
Not a insane target lol, not a crazy prediction… Just Wizard TA.
Thank you and i wish all you good health.
Target i say is 57-58k ish

[Bitcoin] Christmas gift 🎁Despite the FTX affair which caused a new bottom, I believe BTC is ready to rise again due to bullish technical factors:
- many bullish divergences in W, 3D, D, 4h
- end of the big falling wedge (throwback completed)
- historical technical supports (Price, MACD , Disparity Index, RSI)
- blue pill (Hash Ribbons indicator)
- bottom found (Puell Multiple indicator)
- reversal signal (Network Value to Transactions ratio)
Of course, in the event of another major crisis, BTC will fall sharply again.

Bitcoin Chart Analysis#BTCUSDT Chart Analysis:-
#BTC Still Trading in Parallel Channel.
Trading between $26550-$28700
Targets are Ready after the breakout.
Support:- $26550/$24000
Resistance:- $28700/$31700

Bitcoin Bull Market Target $200k ?Bitcoin Log Chart Analysis
- The author believes that the correct fit for Bitcoin's growth is a square root function in a logarithmic chart, suggesting that growth will slow down on long timescales.
- The author is a long-term Bitcoin bull, but remains realistic about the potential for exponential growth.
- The author attributes Bitcoin's growth cycles to halvings, which cause a supply shock and subsequent rally.
- The author estimates that the long-term goal for Bitcoin in 2025+ is around $150k USD, which they believe to be the final asymptotic price.
- Based on historical data, the author believes that Bitcoin could be around $35k going into the next halving.
- The author hopes that their chart helps people understand the long-term growth dynamics of Bitcoin, but acknowledges that these ideas are only probabilistic.

Tradingview Decided to Remove XBT from the front pageInteresting, they replaced XBT with Volatility s&p500...
Someone must be pulling the strings XD

Bitcoin Descending Triangle Pattern UpdateBitcoin LTF Chart Update: Descending Triangle Formation and Potential Breakout
Bitcoin (BTC) has been forming a descending triangle pattern on its lower time frame (LTF) chart, indicating a potential breakout in the near future. Traders should keep a strong eye on the support and resistance levels as they could signal a significant move in the market.
Currently, the downward sloping trendline of the descending triangle is acting as a strong resistance level around $27850, while the horizontal support line is located near $26800. Traders should wait for a confirmed breakout before making any trading decisions, as trading blindly can be detrimental to your portfolio.
If BTC breaks out above the resistance level, we could see a potential upward movement of around 16% from the breakout point, leading to a target of $32000. However, if BTC breaks down below the support level, we could see a potential downward movement of around 16%, leading to a target of $22500.
It is important to keep in mind that trading involves risk and it is advisable to trade after confirming the breakout. Traders should never make any trade blindly without proper analysis and risk management.
In conclusion, the descending triangle formation on the BTC LTF chart indicates a potential breakout in the near future, and traders should keep a close eye on the support and resistance levels to make informed trading decisions. Remember to trade with caution and always use risk management strategies to protect your portfolio.
Follow us For More Quality Updates.
Thank you

Bitcoin update before FED Funds rate 22.03.2023
Fed Funds rate.
There is an
88% chance of a 0.25%
11% chance of a 0.0%
Fed rate hike at tonight's meeting.
The Fed is in a situation where they can't raise the rate and can't not raise the rate, so it's more likely we will see 0.25 today. More important is Jerome Powell's rhetoric as always.
It is hard to make predictions from his speech. Most likely, he will again try to calm everybody and say that everything is fine. We are more interested in his comments on inflation and the banking crisis.
I think it will be one of the most important meetings this year, after which the market will decide the further outcome of the move.
If all is OK, then we expect continued growth until May.
If all is bad, then we go to test 25k and after 23
I think that we will have the second scenario. after the calm and positive we will see growth, the removal of liquidity from above to the area of 29.1 + and then go down because the banking crisis has not disappeared - it remains
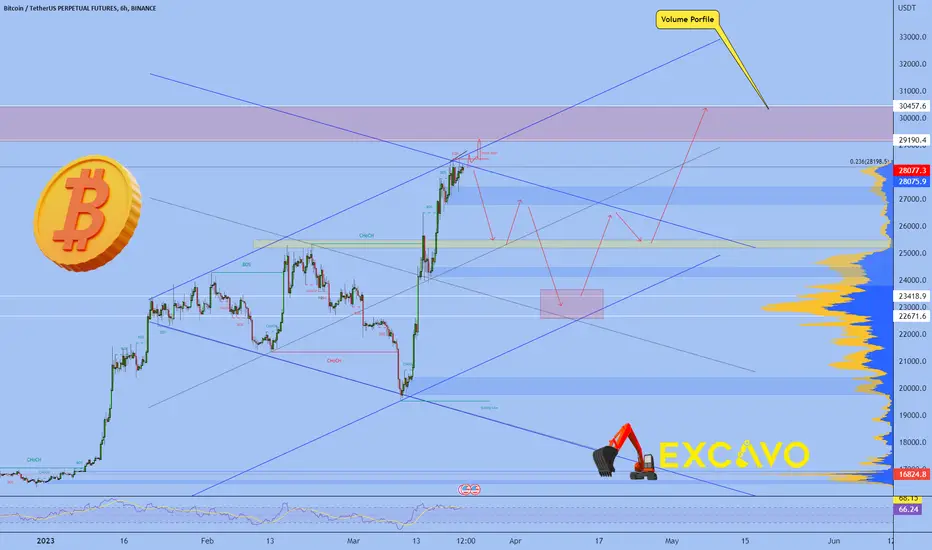
Waiting for correction
Several factors why bitcoin should show a correction
1. Volume profile - in the area of 29-30.5
2. A huge amount of long positions on different tokens (to be liquidated)
3. Slowdown in growth
4. Exponential movement
5. Overbought on many indicators
6. Potential collection of liquidity zones below (blue boxes - liquidity zones)
P.S. My scenario is to collect stop losses above 28.5 and then go down
Best regards EXCAVO
Bitcoin Weekly Chart Analysis ( All Time high Also Predict )Bitcoin Weekly Chart Analysis: Price Expected to Rise to $32,000
Bitcoin (BTC) has been on a bullish trend in recent weeks, with the cryptocurrency printing the biggest weekly candle in its entire history. As of now, BTC is trading at $28,000 and has broken through the weekend resistance, trading above the old resistance level of $25,000. The high time frame suggests that BTC is still bullish, and we can expect the price to reach around $32,000 in the coming days.
However, the $32,000 level is a strong resistance level, and there is a high chance that BTC could reject from there. It is also possible that there could be a retest at the $25,000 level before the price moves upward.
Looking forward, it is highly probable that we could see a new all-time high in 2025, with the price expected to reach between $150,000 and $180,000. It is essential to note that this is just a prediction and is subject to change depending on various factors.
In terms of support and resistance levels, the $25,000 and $20,000 levels are considered strong support Levels.
And $32000 is Strong Resistance Level.
Please Like and Follow us for more Quality updates.
Thank you

Bitcoin Dump After FOMC Meeting#Bitcoin wild ride post-FOMC announcement proves once again the importance of caution in volatile markets.
The downside breakout hit its target before a fakeout upward swing.
so it's best to stay away from such volatility.
Don't let FOMO cloud your judgment.
invest wisely.

Bitcoin CME Gap $28740 has been Filled what Now..?#Bitcoin #CME Gap Chart:
Recently, the Bitcoin CME gap at $28,740 was filled within 24 hours after a post about Bitcoin.
However, a new CME gap has opened at $27,155, and it remains to be seen whether it will be filled after the FOMC news.
Currently, there are two more CME gaps that remain unfilled, one at $35,180 and the other at $20,330.
It is difficult to predict which gap will be filled first.
#BTC #BTCUSDT #FOMC #crypto #cryptocurrency #Alts #Altcoins #cryptosignals #Bitcoin2023

Bitcoin CME Gap Chart AnalysisBitcoin CME Gape Chart Analysis:-
Bitcoin CME Gap at $28,740 remains unfilled, leading to speculation about when it will be filled. In addition, there is anticipation for the next CME Gap at $35,180. However, many are wondering about the status of the $20,330 CME Gap.
The $20,330 CME Gap refers to a price discrepancy on the Chicago Mercantile Exchange (CME) Bitcoin futures chart that occurred when the cryptocurrency experienced a significant price drop in March 2020. The price fell from around $9,000 to below $4,000, causing the CME Gap to form.
Currently, Bitcoin is trading above the price range of the $20,330 CME Gap, leading some to believe that it may never be filled. However, it's worth noting that historically, Bitcoin has filled the majority of its CME Gaps, which means there's a chance that this one could be filled as well.
While it's impossible to predict exactly when the $20,330 CME Gap will be filled, market analysts believe that it may happen in the future if Bitcoin experiences a significant drop in price. In any case, traders and investors should keep an eye on this CME Gap and be prepared for potential market movements if and when it is filled.

🅱️ Bitcoin | Let's Go Back To Basics (1, 2, 3)Let's go back to basics in order to determine where is Bitcoin at right now.
#1 Break of major downtrend
You can use either the linear (arithmetic) or logarithmic scale and both will yield the same result.
Bitcoin is now out of a major downtrend.
BTCUSD W Log:
BTCUSD W Linear:
#2 Accumulation phase
After moving out of the downtrend, Bitcoin enters accumulation from November 2022 to January 2023.
BTCUSD W Accumulation phase:
#3 Bullish breakout
After accumulation Bitcoin undergoes a bullish breakout.
BTCUSD W Bullish breakout:
- This bullish breakout produced the highest prices in more than 8 months.
- Bitcoin prints4 green candles for the first time since August 2021.
- Bitcoin produces the highest buy volume in years and also moves above EMA10 and EMA21.
- This bullish breakout is also supported by the strongest RSI in many years.
These are the basics.
- Additional signals can be found by looking at the MACD, it is the first time it goes bullish coming from a new low since May 2020.
- A higher high after more than a year of lower lows.
- No new lower low since 21-November 2022.
Conclusion
Technically speaking, Bitcoin is now within the January 2023 bullish breakout.
This is the most recent and relevant move for this Cryptocurrency, the rest is past history.
As long as Bitcoin remains within a higher low compared to November 2022, a higher high is expected next.
This is basic technical analysis based on price action.
Thank you for reading.
Namaste.

Bitcoin 15 Minute Chart Analysis ( Ascending Triangle Pattern )Analysis of #BTCUSDT 15 Minutes Chart:
After careful observation of the 15-minute chart of #BTCUSDT, we can identify an ascending triangle pattern forming. This pattern is a bullish chart pattern that indicates that the buyers are becoming increasingly bullish, and the sellers are losing their grip on the market. However, as with all chart patterns, we should always remember to exercise caution and wait for the breakout point before entering any trades.
Therefore, we recommend waiting for the price to break out of the triangle pattern before entering any trades. The upside breakout point is at $28350, while the downside breakdown point is at $27750. Waiting for the breakout point can help to ensure that we avoid false breakouts and potentially save us from making a costly mistake.
It is also essential to keep an eye on both levels and monitor the price action closely. Once the price breaks out of the triangle pattern, we can set our targets at 4%-5% after the breakout. This will allow us to take advantage of any potential gains while minimizing our risks.
In conclusion, chart pattern analysis can be a valuable tool for traders looking to make informed trading decisions. However, it is crucial to exercise caution and wait for the breakout point before entering any trades. By doing so, we can potentially reap the benefits of a bullish market while minimizing our risks.
Thank you for taking the time to read our analysis. Please follow us for more quality updates.

Bitcoin Exclusive Bull Run Technical Analysis: A Comprehensive GBitcoin Exclusive Bull Run Technical Analysis: A Comprehensive Guide By CryptoPatel
Introduction:
Bitcoin, the world's leading cryptocurrency, has been on a rollercoaster ride for the past few years, experiencing extreme highs and lows. In this comprehensive guide, we will take a closer look at Bitcoin's past bull runs and analyze the current market scenario to predict its future price movements. The analysis is based on the technical expertise of CryptoPatel, a renowned cryptocurrency analyst. So, let's dive into the details and explore Bitcoin's future prospects.
Bitcoin's Past Bull Runs:
As per the weekly chart, Bitcoin's previous bull run occurred in 2017, where it hit an all-time high of $19660. However, after the peak, Bitcoin experienced a dangerous dump and hit a bottom of $3120, which was 84% down from its all-time high. This downturn made many investors panic and assume that Bitcoin's target would be $1000. Still, Bitcoin made a strong bounce from the $3120 level, and many investors who used high leverage got liquidated.
After the 2017 bull run, Bitcoin again rose and reached $13875 in 2019, which was a 0.786 Bearish Fibonacci retracement level. However, it again experienced a 67% dump after being rejected from the 0.786 Bearish fib retracement level. This time, it went down till $3913, which was also a 0.786 Bullish fib retracement of the bull mode from the bottom $3120 level. This 0.786 Bullish fib bounce was insane and hit Bitcoin's new all-time high of $68,991.
Bitcoin's Current Scenario:
Bitcoin's last bull market all-time high was $68,991, but it then experienced a hard dump till $15470, which was approximately 77% down from its all-time high. In the current bear market scenario of 2022, Bitcoin tested a new bottom of $15470, and many investors accumulated Bitcoin at this level, as suggested by CryptoPatel, which was their first entry.
Bitcoin has now surged 75% from the current bear market bottom, and CryptoPatel predicts that Bitcoin will hit $42000-$49000 in October 2023, which will be the first exit point. This exit will be the 0.786 Bearish fib retracement from the year 2021 top to the year 2022 bottom.
After the first exit, investors can wait for the second entry around $20,000-$24,000, which might occur in March 2024, near the Bitcoin halving months. This entry will be the 0.786 bullish fib retracement at this point.
After the second entry, investors can hold their Bitcoin till October 2025, where Bitcoin is predicted to hit $150k-$180k, which might be the top of the next bull run.
Conclusion:
Based on the technical analysis of CryptoPatel, it is suggested that investors never sell their Bitcoin until the year-end of 2025. Bitcoin has been on a rollercoaster ride, experiencing extreme highs and lows, and CryptoPatel's analysis provides an excellent roadmap for investors to navigate through Bitcoin's future prospects. However, it is important to remember that investing in cryptocurrencies involves high risks, and This is not Financial Advice so investors should always conduct their research and invest wisely.
Hey, it's CryptoPatel here!
I'm passionate about providing you with the latest insights and analysis on the world of cryptocurrencies.
If you enjoy my content and want to show your support, please like, share, and follow me for more high-quality updates.
Thank you for your support, and let's continue to stay connected for more exciting content!
LIKE ❤️
Share ⏩
Follow

🅱️ Major Development, 1st Buy Signal Since July 2021 | BitcoinThis is the first "buy signal" the Renko system gives for Bitcoin on the weekly timeframe since the major bear-market.
For confirmation, the week needs to close above $24,000 which is almost a done deal.
This would confirm a change of trend, Renko-wise.
We also have a harmonics pattern and many more signals can be extracted from this chart.
We have a long-term higher low when comparing June 2022 to October 2020.
If we were to activate some indicators, the bullish reversal signals would show up in large quantities.
A change of trend doesn't mean that Bitcoin must necessarily go up but if you use the Renko system it would mean "buy".
✔️ Each time you get a green brick = buy.
✔️ Each time you get a red brick = sell.
That's the Renko strategy simplified.
Looking at past history you can see how successful this system can be.
Very simple... It can be used with other charts as well.
It is a great tool for trend change confirmation, for long-term traders and can also be used on shorter timeframes.
Namaste.

BTC/USDT 30 Minutes Chart Analysis: Waiting for Breakout PointsBitcoin:-
Bitcoin (BTC) continues to be a popular cryptocurrency for traders, and its recent movements have been of great interest to investors. In this article, we will examine the BTC/USDT 30 minutes chart and look at the possible breakout points and targets to help traders make informed decisions.
BTC/USDT 30 Minutes Chart Analysis:
As of the time of writing, BTC is trading at $27,100 level and has been moving in a Bull flag pattern. However, it is important to wait for a breakout rather than gambling on the market.
New Breakout Points:
The new breakout points for BTC are:
Upward Breakout: $27,450
Breakdown Point: $26,750
Upside Target After Breakout:
If the upward breakout occurs, the upside targets are between $29,500-$31,500.
Downside Breakout Targets:
In the case of a downside breakout, the targets are around $25,600/$24,700.
Conclusion:
It is always advisable to wait for the breakout before making any trading decisions. By following the new breakout points for BTC and keeping an eye on the targets, traders can make informed decisions and avoid gambling. Happy trading!
In conclusion, traders must always exercise caution and do their due diligence before making any trading decisions. The new breakout points and targets outlined in this article can help traders make informed decisions based on the current market trends. Stay alert and keep an eye on these levels for potential trading opportunities.

Bitcoin breakout of 8 month accumulation Bitcoin breakout of 8 month accumulation while there is a banking crisis. COINBASE:BTCUSD
