A GIFT VIP SIGNAL TRADE 💸💎BREAK OUT CONFIRMED !!!
take a part safely✌
⚠️ future tarde ⚠️ (x5)
✅ Buy: 7 - 7.35 ✅
🎯TARGETS:
1- $ 7.66
2- $ 8.50
3- $ 9.25
4- $ 9.92
5- $ 10.5
💵 Trade Size: 5-7% of Portfolio
🚫Invalidation(SL): daily candle close below $ 6.41
Please click LIKE button and Appreciate my hard work.
Must follow me for latest crypto real time updates.
Thank you.
Xtz

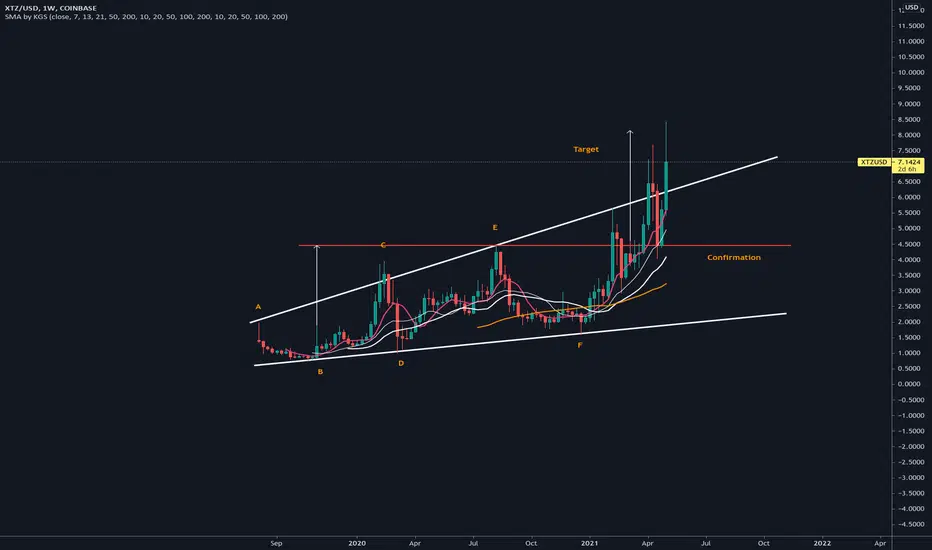
MY MINIMALIST CHART ANALYSIS FOR $XTZ$XTZ TEZOS ON A DAILY CHART
5.10.21 1058H +8 PACIFIC
MY PRACTICE MINIMALIST ANALYSIS
ENTRY AND EXIT POINTS FOR A SWING TRADE
USING RANGE BOXES AND FIBS (NO INDICATORS)
Note:
Run your Fibs to verify
price action corrections and extension
levels. The Range boxes by themselves are
used as confluence to The Dynamics of
the Market.
Check pattern formations and candlestick
formations if you wish.
This is not a piece of financial advice.
I am just a student and still learning.
Adjustments will be made in
accordance with The Dynamics of the
Market along with Trading Psychology.
Postings are most often delayed, as it
takes time for me to finish several
assets in my portfolio.
Updates will be posted religiously if time
permits.
TEZOS (XTZ/USDT) - Potential BullHi All,
New to Tradingview, never have published any charts before, so i though i would take a shot with Tezos.
Bullish Scenario:
- Potential Cup & Handle on the 4 hour.
- Falling wedge (possible handle).
- MACD on the 4 hour bull has a bullish divergence (signaling a bullish cross).
- RSI on the 4 hour has been stagnant (sitting around 50).
- Still above EMA's on the daily chart.
- If volume increases, a break out of the falling wedge is likely.
Bearish Scenario:
- BTC dumps dragging most of the market down with it.
- Everything is the market has had a decent run up as of lately, possibly overheating,
- Daily RSI has a bearish divergence (sitting around 60).
- Daily MACD has a bearish divergence (signaling a potential bearish cross).
- Needs more volume.
To Long or not to long?
Short term targets if bullish breakout occurs - $7.3832.
Long term targets if Cup & Handle play out - $8.41 and above.
If dump - looking at support around $6.24 or even lower at $5.79.
Trade wisely and keep your eye on Papa Bitcoin.
Thanks! :)

$XTZ, 25% up over the last 24/48hs$XTZ
It's a Long Way to the Top... 😋
25% up over the last 24/48hs
UCTS bullish across HTFs
A long term trade that may work out
#XTZ


Tezos $10 by JuneAssuming a stable broader market, Tezos is poised to continue its surge. While the USD chart is at all time highs, the xtz/btc chart is at a crucial resistance level. Expecting some churn over the coming weeks before exploding.

XTZ Token Final Call, Rocket Is Ready To LaunchXTZ token price traded at $7.77 with a gain of % over recent 24-hour and an increase of % in the weekly period. Besides, XTZ price action is way above the EMA Ribbon, leading to soaring in future trading sessions. In contrast, the market capitalization increases to $5.85 billion. Technically, investors can see testing at the resistance of $7.78. The Stochastic RSI index features a flat slant and values in an overbought region. Additionally, the price movement can be above the resistance of $14 in future trading sessions.
Resistance: $7.80, $10.0, $12.35, $14.50
Support: $3.90


WRX vs XTZ 🔥Hello, traders♥️
Let's compare price movements of WRX (that already at the moon with XTZ, that still with us on the Earth)🤣
Breakout of a falling wedge is an excellent buy signal, that confirms by MA's crossed🔥
Try to put take profits levels at time at some levels 🤑
My previous analysis on both coins 👇
Thanks for attention🙏
If you liked my chart, don't forget to click LIKE, it's not difficult for You, but I'm pleased ♥ ️
Also subscribe for not get lost😉
Always sincere with You♥️
Your Rocket Bomb🚀💣

XTZ bullish trendXTZ / USDT
Is a good example for bull market
Bulls still strong.. providing higher highs and higher lows
However we can see how 4$ is critical area for bulls
Only if bulls lost this area we will bearish
Good luck


Tezos (XTZ) Massive Jump Coming Soon...Here we have another one of my original, and also classic, signal.
The black line on the chart stands for MA200, again, and this one is trending down strong.
As MA200 trends down... Prices trend up.
We are likely to see XTZBTC Trezor trading pair starting to grow.
Above MA200 we go super bullish with the doors open for strong moves, 50%, 100%, 200% and more.
Below MA200, we can see additional consolidation, even a another retrace before prices go up.
The markets are always changing... We can see a break of MA200 today or it can take 3 days, 1 week or more... It all depends on the daily candle close, the entire market, Bitcoin and all the factors that affect these markets.
Since prices can go down just as they can go up...
When we are trading, we simply set our targets, buy and hold.
If prices go below our stop, we close at a loss... :(
But if prices go up, we collect the profits and enjoy... :)
We don't do anything in-between.
There is nothing to do ever... We simply wait!
If you are patient, later you can enjoy the results.
We are in the green on this one.
Thanks a lot for your support.
Namaste.

XTZ approaching resistance, hasn't pumped yet.$XTZ is approaching a resistance vs $BTC on the weekly chart. If we can confirm above and bounce off, it should flip very bullish and fly for weeks/months.


Xtzusdt Breakout expected for ath 🎊Hi welcome to my new idea on xtz. Xtz is in uptrend channel and recently it recovered this trend and also it has broken the downtrend channel it formed . Now as it is moving in uptrend it has a big resistance once it clears that good entry for long is best and will see ath after that.
Waiting for breakout!!!!
Let me know your ideas 💡 in comments
Please like and follow me for more ideas
Thanks

XTZ $10 is comingXTZ breakout the $5.5 resistance and now retesting it. There is also a double bottom pattern on 1-hour chart. There is a lot of accumulation happened in XTZ and a rally is pending. Grayscale is buying XTZ and we see a huge rally in XTZ.
Buy Zone: $5.35 - $5-55
Target: $6.1 - $6.75 - $7.3 - $7.95 - $8.8 - $9.75 - $10.6 - $11.5 - $12.8

XTZUSDT Crypto 30/04/21 Analysis 4H ChartBINANCE:XTZUSDT Current analysis for the crypto pair "XTZUSDT"
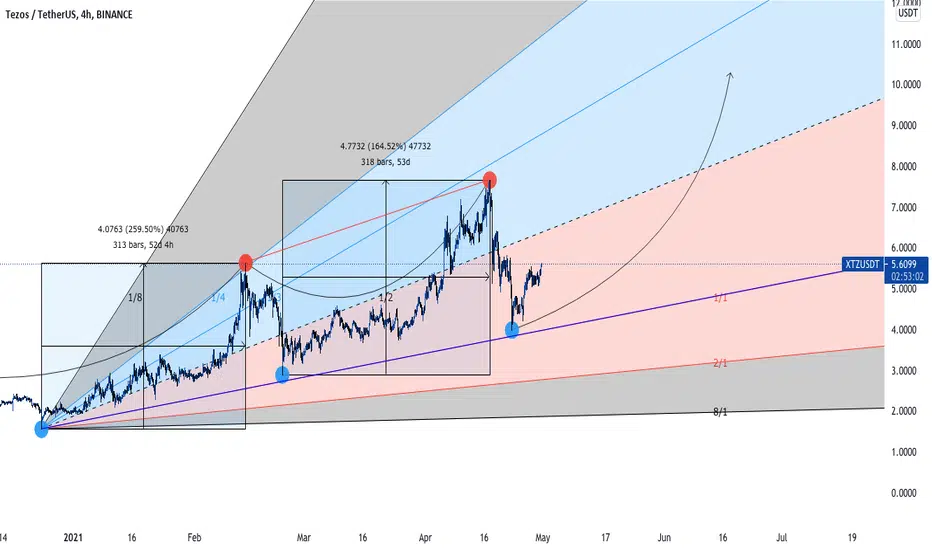
TEZOS (XTZ) - 6h. Buyers have started a new test attempt of $10If we look at the situation on the XTZUSDT market globally, we see how difficult it is for buyers to take control of the global range of $3.9-4.5:
The first attempt by buyers to gain a foothold above this range was back in February 2020. After the tragic events of March 13, 2020 across the entire crypto market, buyers rallied themselves. And on August 20, we again saw the test of this range. However, even large trading volumes did not allow the price of Tezos (XTZ) to gain a foothold above this liquid zone.
The current attempt by buyers to take control of $3.9-4.5 looks successful. Although buyers were unable to hold onto their initiative on February 21, the main trend line that buyers have held from January 2021 is holding firmly.
At the moment, after updating the historical high, buyers managed to keep the range of $3.9-4.5 and declare their readiness to continue the upward trend.
If you look at the local situation , the first liquidity zone on the way to the renewal of the high is in the range of $5.5-5.6. After fixing above it, you can buy XTZ with lower risks than now. It will be possible to buy this coin after breaking through the range of $6.1-6.3 . Considering the fact that the price of XTZ did not fall outside the black growth channel, the probability of growth above $10 remains high.
___________________________
We create both short-term ideas (for a local understanding of the market situation) and medium-term forecasts of price movements.
Subscribe to us and get daily concise analytics!


XTZBTC Head and shoulders patternThere might be a bullish head & shoulders pattern. wait for breaking neck for confirmation.

XTZUSDT : What Will Happen?!Current Price : $5.2
Strong Support : $3.8
Strong Resistance : $7.6
Targets : $8.8 | $10.11 | $11.78
