ZEC - From Exhaustion to Expansion!!!📉ZEC spent days trapped in a clear bearish phase on the left side of the chart, forming lower lows and lower highs. But everything changed once price tapped the major swing low, where buyers stepped in aggressively.
📈Since then, ZEC has been respecting a new rising channel , shifting the market structure from bearish to bullish. As long as price remains inside this channel, the bulls remain in control.
We will be looking for longs around the intersection of:
- the lower blue trendline, and
- the most recent higher-low zone
🏹This is where buyers have consistently reacted before, and where the next bullish impulse could start.
If this structure holds, ZEC may push toward the upper boundary of the channel once again.
Do you think ZEC is gearing up for another leg up? Let me know below 👇
⚠️ Disclaimer: This is not financial advice. Always do your own research and manage risk properly.
📚 Stick to your trading plan regarding entries, risk, and management.
Good luck! 🍀
All Strategies Are Good; If Managed Properly!
~Richard Nasr
Zec

ZEC: Showing Strong Money FlowHey guys, ZEC is consolidating after an explosive +17.32% rally that took price from $332 to $425 in 24 hours. Now trading at $407.75, we're watching to see if bulls can digest these gains and push for another leg or if we're due for a retracement.
The technical setup leans bullish with strong trend confirmation. ADX at 69.4 signals legitimate momentum, MACD shows a bullish crossover, and price sits above all major EMAs (EMA20 $388, EMA50 $369, EMA200 $378). RSI at 69.1 approaches overbought but still has room, while MFI at 76.9 shows strong money flow despite current volume sitting below average.
Key levels to watch: immediate support at EMA20 $388.31 backed by BB middle band $384.02, with critical support at EMA50 $369.27. Resistance comes in at the 24h high $425.00, then BB upper band $432.08. The 52.6% upper wick signals rejection near $425, making that our key breakout level.
Trading setup: entries $400-$410 zone, stop below EMA20 at $388, targets $425/$445/$465 offering 2.1:1 to 4.2:1 risk/reward. The trend structure shows higher lows (bullish) but also lower highs (bearish), creating compression that typically resolves with a strong move. With 80% confidence and strong buy signals, this looks like a solid momentum continuation play if $388 support holds. How are you playing this move?

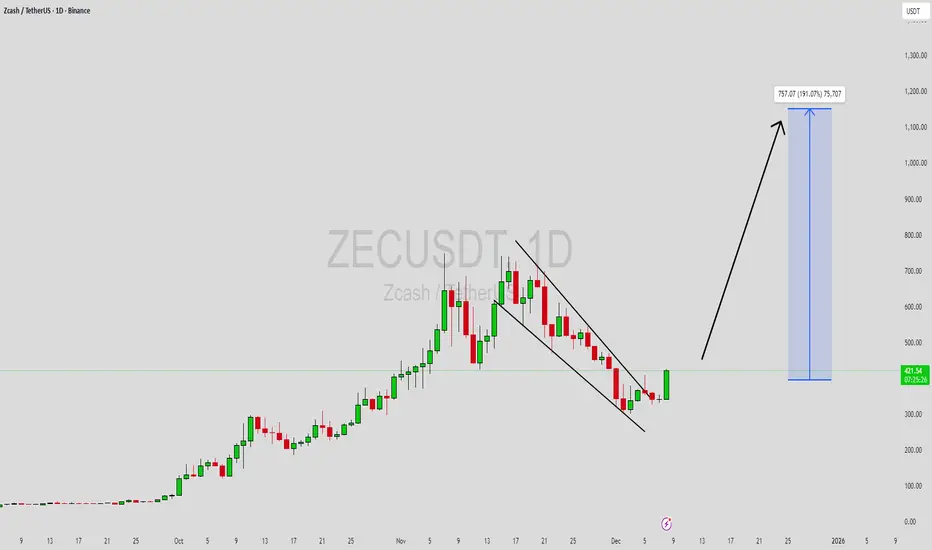
ZECUSDT Forming Falling WedgeZECUSDT is forming a clear falling wedge pattern, a classic bullish reversal signal that often indicates an upcoming breakout. The price has been consolidating within a narrowing range, suggesting that selling pressure is weakening while buyers are beginning to regain control. With consistent volume confirming accumulation at lower levels, the setup hints at a potential bullish breakout soon. The projected move could lead to an impressive gain of around 140% to 150% once the price breaks above the wedge resistance.
This falling wedge pattern is typically seen at the end of downtrends or corrective phases, and it represents a potential shift in market sentiment from bearish to bullish. Traders closely watching ZECUSDT are noting the strengthening momentum as it nears a breakout zone. The good trading volume adds confidence to this pattern, showing that market participants are positioning early in anticipation of a reversal.
Investors’ growing interest in ZECUSDT reflects rising confidence in the project’s long-term fundamentals and current technical strength. If the breakout confirms with sustained volume, this could mark the start of a fresh bullish leg. Traders might find this a valuable setup for medium-term gains, especially as the wedge pattern completes and buying momentum accelerates.
✅ Show your support by hitting the like button and
✅ Leaving a comment below! (What is your opinion about this Coin?)
Your feedback and engagement keep me inspired to share more insightful market analysis with you!
ZEC Analysis (4H)The bullish and upward structure of ZEC appears to be completed, and from the point where we placed the red arrow on the chart, its bearish phase seems to have begun.
It now looks like we are in wave B of the bearish phase, and it is expected to drop from the red zone toward the targets marked on the chart.
The targets are clearly indicated on the chart.
A daily candle closing above the invalidation level will invalidate this analysis.
For risk management, please don't forget stop loss and capital management
When we reach the first target, save some profit and then change the stop to entry
Comment if you have any questions
Thank You

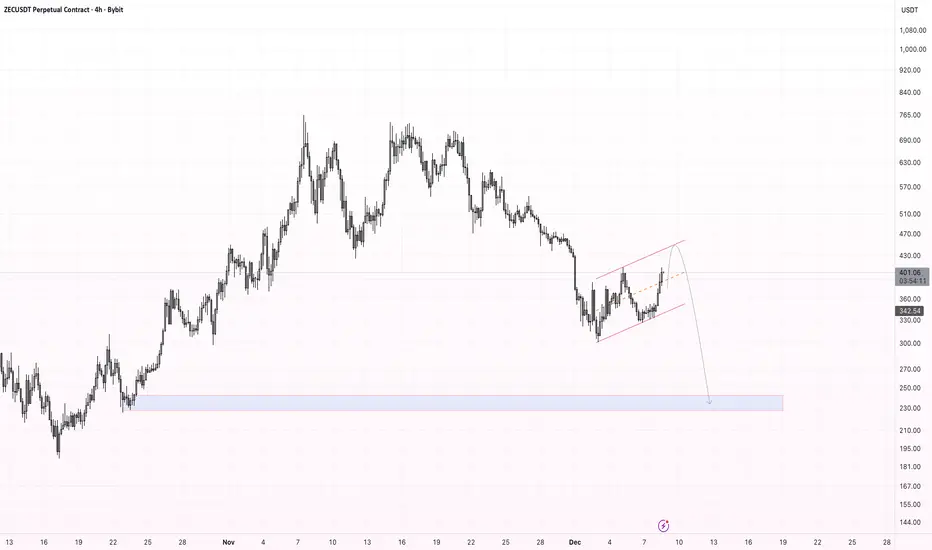
ZEC - forming a clear bearish flag on the 4H timeframe.After a strong impulsive sell-off, the price is consolidating inside an ascending channel, which typically acts as a continuation pattern in a downtrend.
There is still a chance that the market may retest the upper boundary of the flag, but as long as the structure remains intact, the bearish scenario is more likely to play out.
My main target for the next leg down is the $ 240–$230 demand zone, where previous liquidity and support levels are located.
Summary:
Structure: Bearish flag (continuation pattern)
Possible move: Retest of upper channel resistance before reversal
Bearish target: $240–$230
If the flag breaks downward with momentum, continuation of the larger downtrend becomes highly probable.
#ZEC/USDT – Potential Long Setup at Key Fibonacci Level#ZEC
The price is moving in a descending channel on the 1-hour timeframe. It has reached the lower boundary and is heading towards breaking above it, with a retest of the upper boundary expected.
We have a downtrend on the RSI indicator, which has reached near the lower boundary, and an upward rebound is expected.
There is a key support zone in green at 296. The price has bounced from this zone multiple times and is expected to bounce again.
We have a trend towards stability above the 100-period moving average, as we are moving close to it, which supports the upward move.
Entry price: 334
First target: 352
Second target: 386
Third target: 430
Don't forget a simple principle: money management.
Place your stop-loss below the support zone in green.
For any questions, please leave a comment.
Thank you.

$ZEC Pumps, $BTC Dumps — Classic MoveZcash has dropped nearly 54% from the November 15 analysis, when it was trading around $640. We anticipated the breakdown as it broke its parabolic curve, but despite the pullback, ZEC continues to show relative strength compared to the broader market.
A new proposal to replace its old static fee model with a dynamic system is driving renewed interest. This upgrade arrives alongside increased regulatory attention on privacy.
Developers are rolling out a congestion-fee mechanism, and Grayscale is working to transition its ZEC Trust into an ETF — a shift that could attract more institutional flows. With institutions revisiting privacy tech, the key question is whether ZEC can maintain its edge under growing scrutiny.
Technically, whenever ZEC rallies, BTC tends to dip — almost a perfect inverse correlation at times, and price is now hovering around $430. A push toward $460–$470 looks likely, and if it can defend the $380 zone, a retest of $520–$550 is still on the table. If $380 fails, downside opens toward $350–$330.

ZEC Update: The Expected Chop Is Finally Showing UpZEC Update: The Expected Chop Is Finally Showing Up
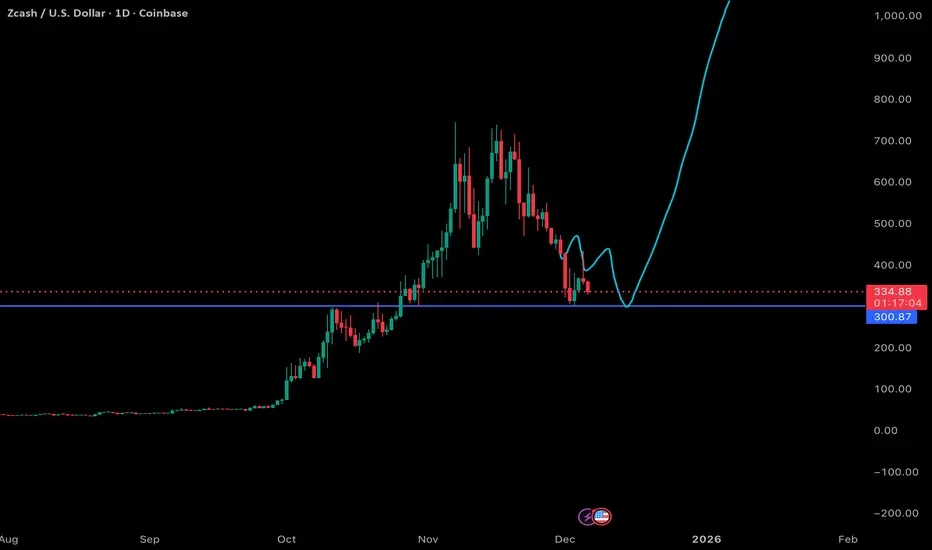
ZEC is now giving us the slower, choppier price action that I originally expected before the clean tag of 300. After that sharp bounce, price is rotating back down toward the same support zone, and this controlled drift is completely normal when a market is trying to build a base.
What I’m watching now is simple:
- ideally we form a higher low somewhere above the previous wick (around the 300 region)
- a bounce from roughly 310ish would signal strengthening structure
- then a push into a higher high would confirm the reversal forming on the daily chart
This kind of back-and-forth is exactly how an accumulation zone builds. The violent reaction at 300 showed strong demand, but a trending reversal usually takes time and multiple attempts. As long as ZEC keeps defending the 300 level and begins carving out higher lows, the structure continues to lean bullish.
Monitoring closely for the next leg of the reversal.
ZEC - HYPE IS OVERPrivacy narrative Hype is over on CRYPTOCAP:ZEC 🚨
Money rotation ongoing & HTF momentum is shifting.
After the 2000%+ bull wave, Seeing Another 20 to 40% bearish correction wave looks more than realistic📉

ZEC - BEARISHI warned you many time for CRYPTOCAP:ZEC that the top was probably around the 720$! I shorted this level, also.
Money rotation ongoing -Current price is down 60% from the exact top! 😱
300$ level touched ✅ + That was also the lower level/support I shared in my stream!
What to expect then: 🔴
H4 --> Stuck in a Strong bearish downtrend 📉
Likely a bearish continuation - sell of might continue. (early buyers booking profits exiting liquidities/profits from the previous HYPE)📉
Daily breakout & retest confirmed - suggesting that the main trend shifted from bulls to bear
According to my lines, prices might continue to fall toward the 185 - 200$ level corresponding to the 0.786 fib level from the high to top of the previous 2000%+ bull wave!
🎯Key resistances to be break:
400$ - 410$ resistances & downtrend daily
🎯Lower key supports:
310 - 300$ --> 250 - 212 - 188$ - 180$

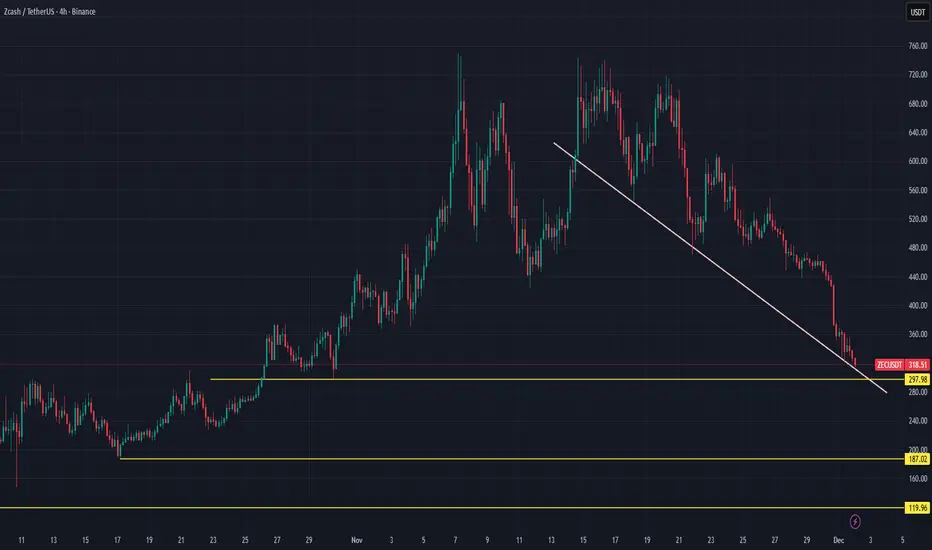
ZEC is dancing on thin support lineZec was not able to pass its yearly ATH level (750), with the market worries and privacy hype losing power dropped down below upper trendline and came to the downward trendline support, below the support price can retrace till to 220-230 usdt level. On the upside resistance zone will be around 400-410 level
ZECUSDT Forming Falling WedgeZECUSDT is forming a clear falling wedge pattern, a classic bullish reversal signal that often indicates an upcoming breakout. The price has been consolidating within a narrowing range, suggesting that selling pressure is weakening while buyers are beginning to regain control. With consistent volume confirming accumulation at lower levels, the setup hints at a potential bullish breakout soon. The projected move could lead to an impressive gain of around 90% to 100% once the price breaks above the wedge resistance.
This falling wedge pattern is typically seen at the end of downtrends or corrective phases, and it represents a potential shift in market sentiment from bearish to bullish. Traders closely watching ZECUSDT are noting the strengthening momentum as it nears a breakout zone. The good trading volume adds confidence to this pattern, showing that market participants are positioning early in anticipation of a reversal.
Investors’ growing interest in ZECUSDT reflects rising confidence in the project’s long-term fundamentals and current technical strength. If the breakout confirms with sustained volume, this could mark the start of a fresh bullish leg. Traders might find this a valuable setup for medium-term gains, especially as the wedge pattern completes and buying momentum accelerates.
✅ Show your support by hitting the like button and
✅ Leaving a comment below! (What is your opinion about this Coin?)
Your feedback and engagement keep me inspired to share more insightful market analysis with you!

Is ZEC in big trouble ? (part. 2)Update and continuation of my last idea.
A new dawn on that ZEC short im building
we are witnessing the biggest exhaustion since this run and more down should follow
note that, as I did for the last idea, I'll update often the post and my bias can change from bearish to bullish if ZEC give me the opportunity to do so
I opened the first short yesterday at 567 and wanted to wait the next days to post to be sure it was a good one, also was waiting for a last higher high but im not sure it will come. More positions should follow if bears stay presents.
Right now BTC is pumping with no volume (bearish) and ZEC can't follow (even more bearish), it was really tempting to publish that post
For now : if 470 fails we should just go to 380
Cheers
ZEC Update🚨📊 ZEC Update
ZEC is testing the red resistance zone 🔴.
If a breakout occurs, the next target will be the green line level 🟩🎯.

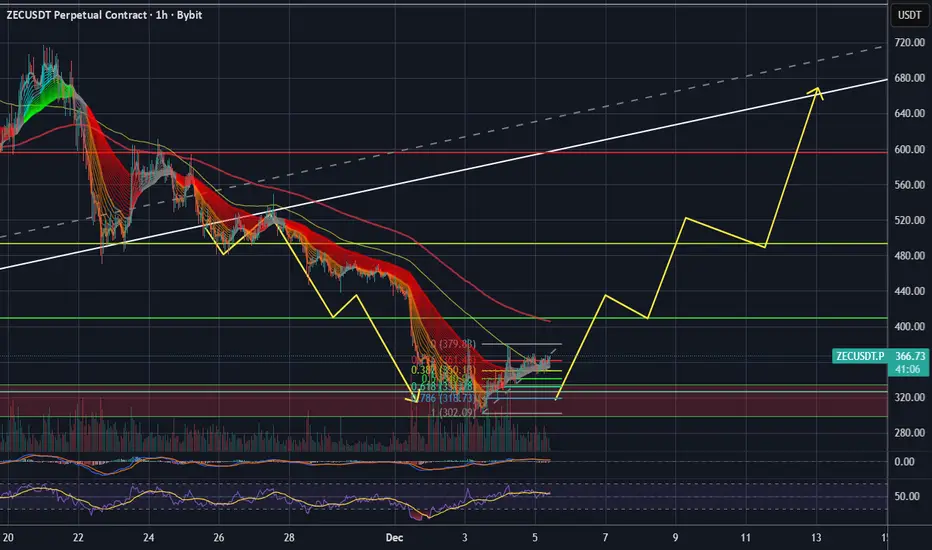
ZEC Golden Zone Reversal⚡ ZEC/USDT – The Golden 0.618 Reversal Zone?
BYBIT:ZECUSDT.P just tapped the 0.618 Fib around $326, right inside a strong support zone — classic golden pocket territory. 👀
The setup’s screaming potential reversal:
- RSI: Bullish divergence forming.
- MACD: Losing bearish momentum.
- EMA Ribbon: Flattening on 4H = trend shift brewing.
If bulls can reclaim $410–$490, I’m eyeing a push toward $650+.
Below $320, though — game over, next stop $207.
“Golden pocket bounces are where legends are born… or wrecked.” 💀➡️🚀
ZEC Reaction Update: Clean Tag of 300 and a Violent BounceZEC just delivered the exact reaction we were looking for at the 300 level. I kept the original teal projection on the chart for reference since the broader structure is still playing out, but price moved faster than expected. I anticipated a bit more chop and a slower drift into support, yet ZEC went straight down into the 300 zone and instantly snapped back with a strong, aggressive bounce.
This type of behavior reinforces how significant that 300 level is. Buyers were waiting there with size, and the immediate reversal shows clear demand absorption and a potential shift in short term momentum. Even though the path was steeper than projected, the core idea remains intact: 300 is major support, and the reaction confirms it.
Now we watch to see whether ZEC can build structure above this bounce and start forming higher lows. For now, the key takeaway is simple: the market respected the level perfectly, and the response was far more decisive than expected.

ZECUSDT – Move Up?Alright traders, simple idea today:
I’m expecting a move up in the next few days,
nothing crazy, nothing dramatic — just a clean setup with a nice 2:1 RR on the table.
Structure looks decent, momentum isn’t dead,
and ZEC finally seems ready to do something other than trolling us. 😅
Not much more to add —
take the trade, follow your plan,
and as always:
👉 manage your risk properly
👉 don’t force it
👉 secure the bag before ZEC changes its mind 😂
Good luck, legends! 🚀📈

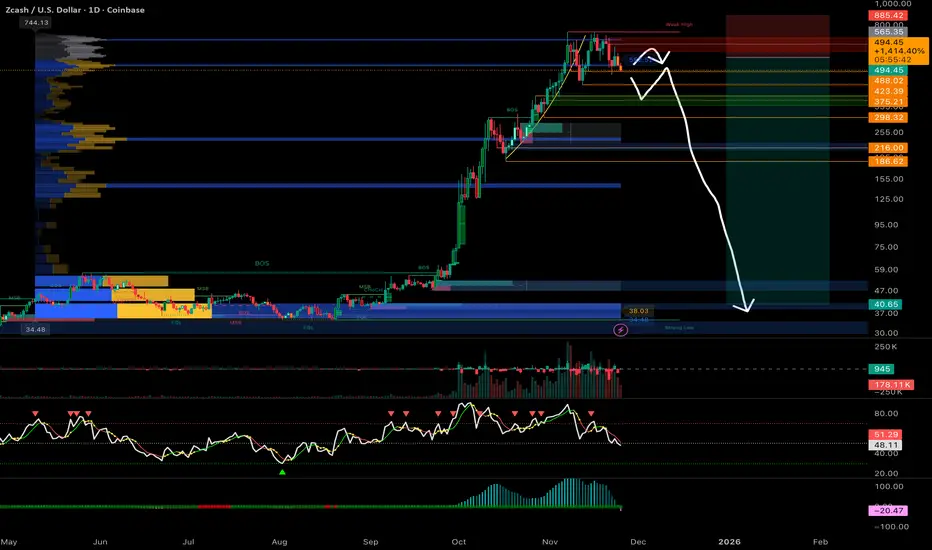
Check if it can rise above 422.80
Hello? Hello, traders.
If you "Follow" us, you'll always get the latest information quickly.
Have a great day.
-------------------------------------
(ZECUSDT 1D Chart)
After a sharp rise, the price is showing a sharp decline.
The key to a bullish turn is whether the price can rise above 422.80 and hold.
If the uptrend fails, we need to check for support around 216.60.
If it falls below 216.60, it's likely to take time to rise again.
Although the price is showing a short-term downtrend, falling below the M-Signal indicator on the 1D chart, it should be considered an ongoing uptrend because the M-Signal indicator on the 1D chart > M-Signal on the 1W chart > M-Signal on the 1M chart is arranged in this order.
Therefore, if the M-Signal indicator on the 1W chart declines, consider whether it can find support near the M-Signal indicator on the 1M chart and consider a response plan.
Therefore, the movement when the price falls to around 216.60 is crucial.
There is a possibility that the price will rise above the OBV High indicator, sustaining the price and indicating further upward movement.
However, since the OBV Low indicator is still above the OBV High indicator, a sideways movement seems likely.
-
Thank you for reading to the end.
We wish you successful trading.
--------------------------------------------------

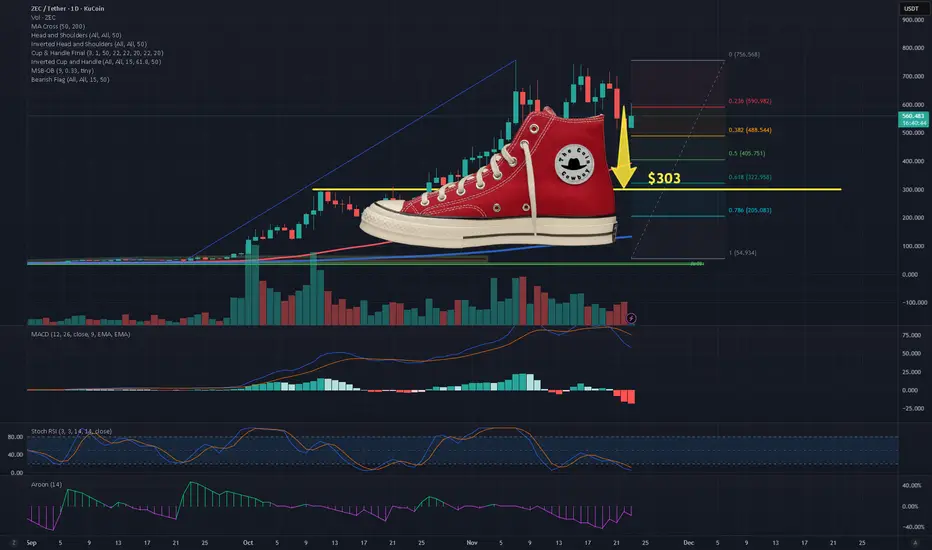
ZEC — The Shoe is About to DropMy 7 reasons why ZEC is about to drop to the heel of the shoe.
1. Price Rejected Hard at the 0.236 Fibonacci Level
The recent top at $752
Strong rejection at $582 (0.236 level)
Price tried to reclaim 0.236 multiple times and failed, which signals:
The bullish trend has lost strength and a deeper retracement is likely.
In most parabolic assets, 0.236 → 0.382 → 0.618 is the natural sequence when momentum dies.
ZEC already hit 0.382 around $476, and bounced weakly. Next logical magnet is 0.618 = $306.
2. The $548 Horizontal Level Was Lost (Key Breakdown)
$548 was:
former support
former demand zone
heavy volume node (visible on histogram)
Price closed below it, which makes it broken support → new resistance
Losing this floor confirms that buyers couldn’t defend the mid-range.
When a mid-range collapses, price usually moves to the next major liquidity pool, which here is:
👉 0.618 Fib at $306
👉 200MA cluster between $380–$400
3. Volume Profile Shows a Gap Below $480
Volume bars reveal high trading activity between $540–$620
A void / low-volume area between $470 → $380
Markets tend to fill low-volume gaps quickly because:
There is little historical demand to slow price down
This means once $480 breaks convincingly, price can accelerate rapidly toward:
📌 $380–$400
📌 $305–$330
4. MACD Bearish Cross With Increasing Bearish Momentum
MACD shows:
MACD line crossing below signal line
Histogram printing deeper red bars
MACD approaching the zero line
A MACD cross this high up (after a parabolic run) is dangerous
When MACD crosses down after a blow-off top, the retrace is usually 50–70%.
That places ZEC’s ideal retrace zone between:
0.5 Fib → $391
0.618 Fib → $306
Again, pointing toward the $300 range
5. Stochastic RSI Bottoming? Not Yet — Could Stay Oversold in a Downtrend
Stoch RSI is oversold, but this is misleading because:
In downtrends, Stoch RSI can remain pinned down while price continues falling.
This happens during macro trend reversals.
Oversold Stoch does not mean reversal—it often means continuation.
6. Aroon Indicator Shows Strong Downtrend Confirmation
Aroon indicator is down (purple) is dominating
Aroon Up (green) is completely suppressed
This means trend strength = bearish
Aroon tends to be a leading indicator, so with this reading:
Trend is already confirmed bearish. More downside is expected.
7. Market Structure: Lower Highs + Breakdown of Rising Structure
The chart clearly shows:
A lower high after the top (not a good sign)
Breakdown of the parabolic rising wedge
Failed retest zone around $600
Candle spreads widening on down moves (increasing sell pressure)
All of that is consistent with a distribution pattern after a massive run
Once distribution completes, assets typically retrace to:
📌 0.618
or
📌 the base of the breakout structure
The base of ZEC’s breakout...
→ $300–$350 area
$ZEC planWill try a long here. I have set my bids in the purple box. Around $295-280 with SL $259. I think the previous high could act as a support.
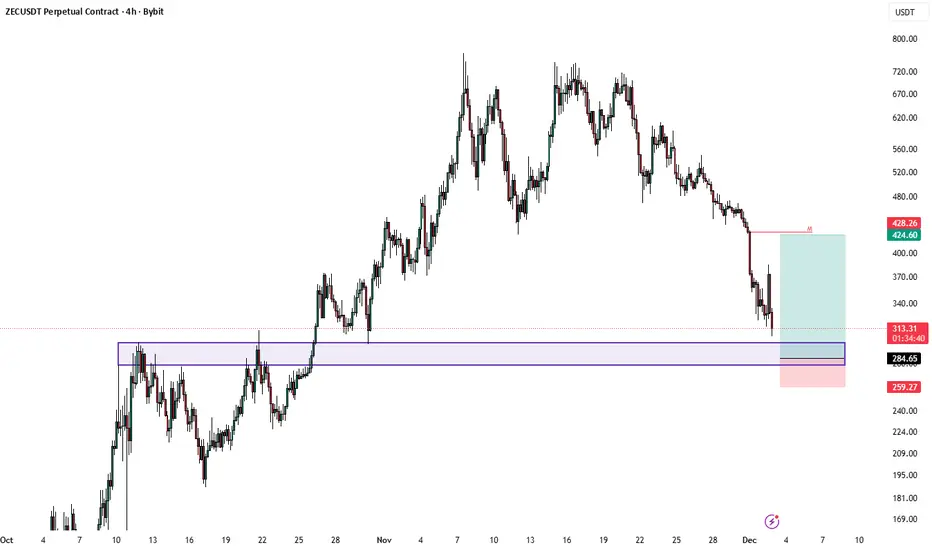
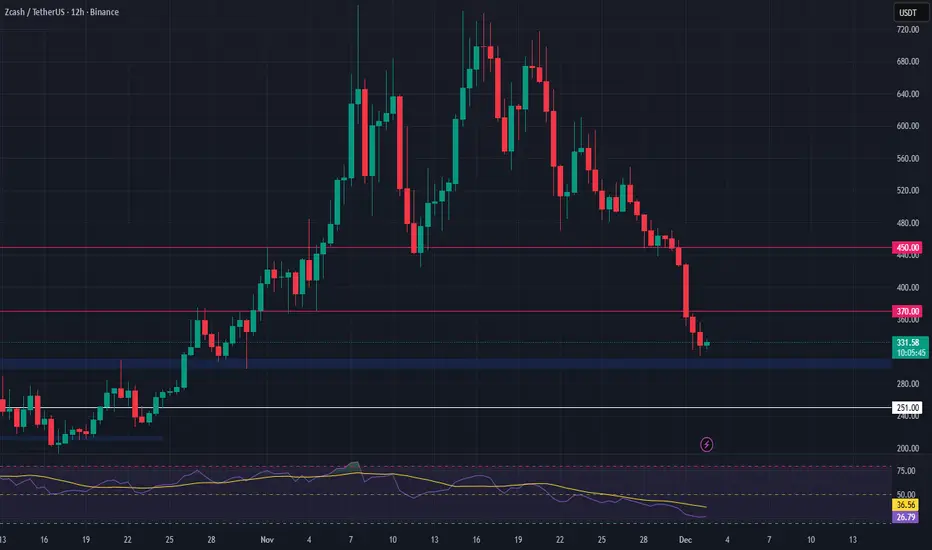
ZEC Breakdown or Bounce? Key Support in PlayAfter a strong multi-week rally, ZEC is now showing signs of exhaustion and appears to be breaking down from recent highs. Price is testing a critical support area, and how it reacts here could shape the next leg of the move.
We are watching the $300–$310 zone as a potential entry point if buyers step in. This area has previously acted as a consolidation range and could offer a clean bounce setup. If support holds, we could see continuation toward higher targets.
📈 Trade Setup:
Entry Zone: $300–$310
Take Profits: $370 / $450
Stop Loss: $251
ZEC Price Crashes 43% In A Week; Evokes This Critical QuestionZEC previously posted a massive 1,442% rally during the peak of the privacy-token narrative. That momentum faded at the start of November, and the altcoin has since crashed 56% from its highs.
A staggering 43% of that loss occurred in just the last week, pushing ZEC down to $323. If this trend continues, Zcash is likely to break below the $300 support level and fall toward $260, or even $204, erasing more of its earlier gains.
However, Arthur Hayes believes crypto markets follow distinct yearly narratives. According to him, 2025 revolved around AI-linked tokens and the rapid expansion of stablecoins, but 2026 will center on privacy. He says this pivot could spark renewed interest in privacy-driven cryptocurrencies and the underlying tech that supports them.
Thus if buyers return at these discounted levels, ZEC could attempt a bounce from the $344 area. A recovery toward $442 and eventually $520 would be needed to invalidate the current bearish outlook.

ZEC Update🚨📊 ZEC Update
ZEC is testing an important support level in blue right now 🔵.
If this support breaks down,
we could expect ZEC to drop toward the next major support zone
around $259, which is marked at the green line level 🟢.
This is a critical area —
a clean breakdown could trigger a deeper move.
