US 10Y TREASURY: heading higherTrade tariffs once again shaped market sentiment during the previous week. The US Administration announced the intent for introduction of 50% tariffs on goods imported from the European Union, which should become effective from 1st July this year. Market immediately reacted to this news, bringing US equities lower, and surging US treasuries. Another news that hit the market and impacted negatively US yields was that the US House of Representatives adopted a tax and spending bill, which is expected to add trillions of US Dollars to the US debt, as analysts are noting. The US has already been downgraded twice by rating agencies, last week by Moody’s, due to high concerns over the sustainability of the US debt.
The 10Y US benchmark reached the highest weekly value at 4,62%, but eased as of the end of the week to the level of 4,50%. This type of swings in the Treasury yields will most probably continue in the coming period. The market is currently extremely sensitive to fundamentals and any news regarding trade tariffs.
Government bonds
CANADIAN GOVERNMENT 10 YEAR BOND YIELD. CA10YThe Canada 10-year government bond yield (CA10Y) plays a significant role in influencing the Canadian dollar (CAD) in the forex market.the following are key take home .
1. Interest Rate Expectations and Monetary Policy Signaling
The 10-year bond yield reflects market expectations of future interest rates and inflation.
When the CA10Y rises (currently around 3.35%–3.38% in May 2025), it signals expectations of tighter monetary policy or higher inflation, which tends to strengthen the CAD as investors anticipate higher returns on Canadian assets.
Conversely, falling yields suggest easing monetary policy or weaker growth, putting downward pressure on the CAD.
2. Impact on Capital Flows
Higher 10-year yields attract foreign investors seeking better returns on Canadian government debt, increasing demand for the CAD to purchase these bonds.
This inflow of capital supports the Canadian dollar’s value relative to other currencies.
3. Relationship with US Treasury Yields and Interest Rate Differentials
The CAD is sensitive to the yield differential between Canadian 10-year bonds and US 10-year Treasuries.
When Canadian yields rise relative to US yields, the CAD tends to appreciate due to the more attractive yield environment.
Currently, the Canadian 10-year yield is around 3.38%, while the US 10-year yield is higher (~4.5%), which partly explains USD strength over CAD but also highlights potential for CAD appreciation if the differential narrows.
4. Economic Growth and Inflation Signals
The CA10Y incorporates expectations about Canada’s economic growth and inflation.
Recent data shows mixed inflation signals: headline CPI falling to 1.7% YoY but core inflation rising to 3.1%, suggesting the Bank of Canada may maintain a restrictive stance, supporting bond yields and the CAD.
Trade tensions and tariffs create uncertainty, but a resilient Canadian economy and narrowing trade deficit also help support yields and the currency.
5. Bond Prices and Yield Movements
Bond prices move inversely to yields. When yields rise, bond prices fall, which can cause volatility in fixed income markets.
Rising yields may reflect concerns about inflation or fiscal sustainability, but also attract investors, supporting the CAD through increased demand for Canadian assets.
Summary
Factor Effect on CAD
Rising CA10Y Signals tighter policy, attracts capital → CAD appreciation
Falling CA10Y Signals easing or weaker growth → CAD depreciation
Yield differential vs. US Narrowing gap supports CAD; widening gap favors USD
Inflation and economic outlook Mixed inflation supports restrictive policy → supports CAD
Trade and fiscal risks Increase uncertainty, may weigh on CAD
Conclusion
The Canada 10-year bond yield is a key barometer of monetary policy expectations, inflation, and economic health, all of which influence the Canadian dollar’s value. Rising yields generally strengthen the CAD by attracting investment and signaling tighter policy, while falling yields suggest the opposite. The yield’s interaction with US Treasury yields and broader economic fundamentals shapes CAD movements in current times .

Is US debt a threat to equity market recovery?Introduction: The equity market is marking time in the short term after a vertical uptrend since the beginning of April. There are many issues of fundamental concern, but one is currently front and center: the sustainability of US sovereign debt. Of course, it's far too early to talk about a US public debt crisis, but the new tax bill championed by the Trump Administration envisages raising the US debt ceiling by $4 trillion, putting short-term upward pressure on US bond yields on 10-, 20- and 30-year maturities. Is this a threat to the rebound in US equities since the beginning of April?
1) US bond yields reach macroeconomic warning zone
The Trump Administration's tax bill calls for tax cuts and, above all, an increase in the US public debt ceiling by US$4 trillion to allow the US federal government to continue its massive indebtedness.
The market is beginning to worry about this situation, as US debt is on the verge of surpassing the 1946 record when expressed as a percentage of US GDP. The annual interest burden on existing debt has reached US$880 billion, equivalent to the US defense budget.
Chart showing the evolution of US public debt as a percentage of US GDP
As a result, financial markets are expressing their concern with rising US bond yields on the long end of the yield curve.
Chart showing Japanese candlesticks in daily data tu 10-year US bond yields
Graph showing monthly Japanese candlesticks for the 30-year US bond yield.
2) The market is hoping for activation of the FED put to ease bond tension
This upward pressure on US bond yields may represent a risk for the equity market, as higher US federal government yields will have a direct impact on US corporate borrowing rates.
S&P 500 companies have solid balance sheets and should be able to cope, but long-term bond yields must not rise above 5/6%, as the financial situation of small and medium-sized US companies would then become problematic. This 5/6% threshold has been identified as the macroeconomic warning threshold for the majority of US companies. In such a scenario, the FED would be obliged to intervene directly on the bond market to relieve the pressure.
3) The S&P 500 is overheating in the short term, but the underlying uptrend is technically intact, and remains supported by the new record high in global liquidity.
At this stage, technical analysis of the financial markets suggests that the upward rally since the beginning of April is not under threat. The market was overheated in the short term and needed to breathe. For the S&P 500 index, the consolidation is short-term in scope, and the recovery remains intact as long as the major technical support zone of 5700/5800 points remains intact. The 200-day moving average, shown in blue on the chart below, passes through this price range.
Chart showing Japanese candlesticks in daily data for the S&P 500 future contract
DISCLAIMER:
This content is intended for individuals who are familiar with financial markets and instruments and is for information purposes only. The presented idea (including market commentary, market data and observations) is not a work product of any research department of Swissquote or its affiliates. This material is intended to highlight market action and does not constitute investment, legal or tax advice. If you are a retail investor or lack experience in trading complex financial products, it is advisable to seek professional advice from licensed advisor before making any financial decisions.
This content is not intended to manipulate the market or encourage any specific financial behavior.
Swissquote makes no representation or warranty as to the quality, completeness, accuracy, comprehensiveness or non-infringement of such content. The views expressed are those of the consultant and are provided for educational purposes only. Any information provided relating to a product or market should not be construed as recommending an investment strategy or transaction. Past performance is not a guarantee of future results.
Swissquote and its employees and representatives shall in no event be held liable for any damages or losses arising directly or indirectly from decisions made on the basis of this content.
The use of any third-party brands or trademarks is for information only and does not imply endorsement by Swissquote, or that the trademark owner has authorised Swissquote to promote its products or services.
Swissquote is the marketing brand for the activities of Swissquote Bank Ltd (Switzerland) regulated by FINMA, Swissquote Capital Markets Limited regulated by CySEC (Cyprus), Swissquote Bank Europe SA (Luxembourg) regulated by the CSSF, Swissquote Ltd (UK) regulated by the FCA, Swissquote Financial Services (Malta) Ltd regulated by the Malta Financial Services Authority, Swissquote MEA Ltd. (UAE) regulated by the Dubai Financial Services Authority, Swissquote Pte Ltd (Singapore) regulated by the Monetary Authority of Singapore, Swissquote Asia Limited (Hong Kong) licensed by the Hong Kong Securities and Futures Commission (SFC) and Swissquote South Africa (Pty) Ltd supervised by the FSCA.
Products and services of Swissquote are only intended for those permitted to receive them under local law.
All investments carry a degree of risk. The risk of loss in trading or holding financial instruments can be substantial. The value of financial instruments, including but not limited to stocks, bonds, cryptocurrencies, and other assets, can fluctuate both upwards and downwards. There is a significant risk of financial loss when buying, selling, holding, staking, or investing in these instruments. SQBE makes no recommendations regarding any specific investment, transaction, or the use of any particular investment strategy.
CFDs are complex instruments and come with a high risk of losing money rapidly due to leverage. The vast majority of retail client accounts suffer capital losses when trading in CFDs. You should consider whether you understand how CFDs work and whether you can afford to take the high risk of losing your money.
Digital Assets are unregulated in most countries and consumer protection rules may not apply. As highly volatile speculative investments, Digital Assets are not suitable for investors without a high-risk tolerance. Make sure you understand each Digital Asset before you trade.
Cryptocurrencies are not considered legal tender in some jurisdictions and are subject to regulatory uncertainties.
The use of Internet-based systems can involve high risks, including, but not limited to, fraud, cyber-attacks, network and communication failures, as well as identity theft and phishing attacks related to crypto-assets.

US10Y Technical Breakdown – Post-Moody’s DowngradeMoody’s has downgraded the US credit rating for the first time since 2011, citing rising debt levels and long-term fiscal challenges.
This move sends a clear warning signal about America’s fiscal path and adds fresh uncertainty to markets already navigating interest rates, inflation, and geopolitical risks.
Focus on the US 10-Year Treasury Yield as the market’s pulse on sovereign risk, inflation expectations, and future borrowing costs. Tracking its medium-term trend will provide crucial clues on market sentiment and risk appetite.
Medium-Term Market Analysis
(6-12 Months)
1. Structural Fiscal Risks
This downgrade highlights growing concerns over the US debt trajectory and political gridlock around spending and debt ceilings.
It’s less about an immediate crisis, more about long-term sustainability.
2. Rising Yields and Market Volatility
The 10-year Treasury yield could move higher, beyond 4.60% we could see rates possibly testing previous resistance of 4.80% (Jan 2025) or 5.00% (Oct 2023).
Higher yields mean increased borrowing costs, which can pressure interest-sensitive sectors like tech and real estate and add volatility to equities.
3. Federal Reserve’s Tough Balancing Act
With bond yields edging up, the Fed faces a dilemma: delaying cuts further could risk inflation climbing higher.
However, this downgrade raises the likelihood that the Fed could keep rates higher for longer than many investors expect.
4. Dollar and Capital Flow Shifts
While a credit downgrade may initially pressure the US dollar, its safe-haven status remains strong.
Global capital could increasingly look to alternatives like emerging markets or gold, leading to shifts in international financial flows.
Perspective
While Moody’s downgrade is a serious signal, it’s important to consider:
1) Political Leverage: Sometimes, rating agencies’ decisions can influence political negotiations. This downgrade may add pressure on US lawmakers to reach fiscal compromises. It’s a tool, not necessarily a verdict.
2) US Dollar & Debt Demand Resilience: Despite concerns, US Treasury securities remain the world’s primary safe asset, with global demand still robust. This could temper yield spikes and limit fallout.
Some could view the downgrade as “priced in” to a degree, given ongoing debt ceiling battles and past political brinkmanship.
If true, markets may react less dramatically than feared.
Watch
US 10-Year Yield: Key indicator to watch for shifts in risk sentiment and inflation expectations.
Equities: Prepare for increased volatility; consider defensive sectors and value plays.
Credit Markets: Monitor for widening spreads as risk aversion grows.
Policy Signals: Fed communications and US political developments will be critical catalysts.
This Moody’s downgrade isn’t just a headline, it’s a medium-term signal to recalibrate risk and position for a more uncertain fiscal backdrop.

The Bond Shark Attack.The bond yield has taken its first dive to the 0.88 level, and according to the ever-so-fishy harmonic shark pattern , we’re bracing ourselves for a dramatic tumble at the 1.138 level.
Now, what does this mean for the stock market? Well, think of it as a domino effect but with a flair for drama.
Investors might start sweating over higher borrowing costs, causing a ripple of caution through equities.

US GOVERMENT 10 YEAR BOND YIELD US10Y Among the US Treasury bond yields—2-year (US02Y), 10-year (US10Y), and 30-year (US30Y)—the 10-year Treasury yield (US10Y) generally reflects the strength of the US Dollar Index (DXY) most closely.
Explanation:
The US10Y yield is widely followed by currency traders and investors as a key indicator of market sentiment, interest rate expectations, and economic outlook. It balances short-term monetary policy effects and long-term growth/inflation expectations, making it a comprehensive gauge for the dollar's strength.
The correlation between the US10Y yield and the DXY is strong and positive: when the 10-year yield rises, the dollar typically strengthens, and when it falls, the dollar tends to weaken. This relationship is more consistent than with the 2-year or 30-year yields.
The 2-year yield (US02Y) is more sensitive to Federal Reserve policy changes and short-term rate expectations. While it influences the dollar, its impact is often more volatile and tied to immediate monetary policy shifts rather than broader economic trends.
The 30-year yield (US30Y) reflects long-term inflation and growth expectations but tends to be less reactive to short- and medium-term market dynamics that drive currency movements. It has a weaker and less direct correlation with the DXY compared to the 10-year yield.
Recent market observations (early 2025) show that the US10Y yield movements often lead or move in tandem with the DXY, while divergences can occur but are exceptions rather than the rule.
Summary Table
Bond Yield Correlation with DXY Notes
US 2-Year (US02Y) Moderate Sensitive to Fed policy, more short-term focused
US 10-Year (US10Y) Strong Reflects medium-term economic outlook, best DXY proxy
US 30-Year (US30Y) Weak to Moderate Long-term outlook, less impact on short-term DXY moves
Conclusion
The 10-year US Treasury yield (US10Y) is the best indicator among the three for reflecting the strength of the US Dollar Index (DXY) due to its balanced sensitivity to both monetary policy and broader economic conditions.
#DOLLAR #US #GOLD

The break-up (a must-watch chart)One of the most important—and unusual—developments in the market right now is the combination of rising US bond yields and a falling US dollar.
Normally, when bond yields go up, the dollar strengthens. It's similar to a high-interest bank account: if you can earn more by holding US assets, global investors tend to pile in, increasing demand for the dollar.
But that’s not what we’re seeing today.
Instead, yields are rising while the dollar weakens—something that’s more often associated with emerging markets facing debt concerns. It signals a deeper issue: despite higher returns on offer, investors are becoming wary of the underlying fundamentals.
In short, **America’s massive debt load and relentless money printing may be starting to catch up—**even with the world’s reserve currency. And the market is beginning to take notice.
This is important to all asset classes moving forward. Keep your eyes peeled on it.

JAPAN GOVERMENT 10 YEAR BOND YIELD JP10YJP10Y, Yen Strength, and Bond Price Correlation
Key Relationships
JP10Y (Yield) and Bond Price:
Inverse Correlation: Bond prices and yields move inversely. When Japan’s 10-year government bond yield (JP10Y) rises, bond prices fall, and vice versa.
JP10Y (Yield) and Yen Strength:
Positive Correlation (Typically): Rising JP10Y often strengthens the yen (JPY) by attracting foreign capital into Japanese bonds. Higher yields make yen-denominated assets more attractive, increasing demand for JPY.
Exception: If yields rise due to fiscal instability or inflation fears (e.g., Japan’s 2025 bond yield surge to 1.59%), the yen may weaken despite higher yields, as investors prioritize safety over yield.
Bond Price and Yen Strength:
Indirect Link: Falling bond prices (rising yields) can strengthen the yen if driven by improved economic confidence or hawkish Bank of Japan (BoJ) policies. Conversely, bond price declines due to fiscal risks may weaken JPY.
Factors Influencing Correlation
Factor Impact on JPY Strength Impact on JP10Y (Yield)
BoJ Rate Hikes Strengthens JPY Raises JP10Y (bond prices fall)
Foreign Demand for JGBs Strengthens JPY Raises JP10Y (bond prices fall)
Carry Trade Activity Weakens JPY (if yields low) Lower JP10Y (bond prices rise)
Economic Growth/Fiscal Health Mixed (depends on context) Rises if growth/inflation up
Global Risk Sentiment Strengthens JPY (safe-haven) Lower JP10Y (bond prices rise)
Recent Examples (2024–2025)
March 2025: Japan’s 10-year bond yields surged to 1.59% (highest since 2008), driven by BoJ rate hikes and reduced bond purchases. This initially strengthened the yen, but concerns about higher borrowing costs and economic stress later tempered gains.
February 2025: Declining JGB yields (due to BoJ’s dovish signals) weakened the yen, highlighting the sensitivity of JPY to yield fluctuations.
Summary Table
Relationship Typical Direction Exceptions/Caveats
JP10Y ↑ → JPY ↑ Positive (capital inflows) Negative if driven by fiscal risks
JP10Y ↑ → Bond Prices ↓ Inverse (fundamental) Always holds
Bond Prices ↓ → JPY ↑ Indirect (if yields signal strength) Weakens if yields reflect stress
Conclusion
The correlation between JP10Y, yen strength, and bond prices hinges on the underlying driver of yield movements:
Yield rises from BoJ tightening or economic optimism → JPY strengthens.
Yield rises from fiscal instability → JPY may weaken despite higher yields.
Bond prices and yields remain inversely linked regardless of context. Traders should monitor BoJ policy, global risk sentiment, and Japan’s fiscal health to interpret these dynamics accurately.

UK GOVERMENT 10 YEAR BOND YIELD The correlation between the UK 10-year gilt yield (GB10Y) and GBP currency strength is nuanced and influenced by multiple factors, as of May 2025:
Key Points on GB10Y and GBP Strength Correlation
The UK 10-year gilt yield recently rose to 4.77%, its highest since April 2025, driven by hotter-than-expected inflation data (CPI at 3.5% YoY, above forecasts) and reduced market expectations for Bank of England (BoE) rate cuts this year.
Typically, higher gilt yields attract foreign investment, increasing demand for GBP as investors buy sterling to purchase gilts, which tends to support GBP strength.
However, in early 2025, despite rising gilt yields (reaching 4.82% in January), the GBP weakened significantly against the USD, falling to a 14-month low. This divergence occurred because high gilt yields also signaled economic difficulties such as fiscal instability, higher borrowing needs, and inflation concerns, which weighed on sterling.
Thus, high gilt yields can have a dual effect:
Positively, by attracting yield-seeking capital inflows supporting GBP.
Negatively, by reflecting underlying economic or fiscal stress that undermines confidence in GBP.
Market reaction depends on which effect dominates. For example, if rising yields are driven by strong economic growth and tighter monetary policy, GBP tends to strengthen. If yields rise due to fiscal concerns or inflation fears, GBP may weaken despite higher yields.
Analysts note that the recent rise in gilt yields has been partly influenced by global factors (e.g., US Treasury yields) but also UK-specific inflation and fiscal issues.
The UK/US 10-year yield spread is also important: a widening spread (UK yields rising faster than US yields) tends to support GBP/USD appreciation, signaling relative UK economic strength.
Overall, the correlation between GB10Y and GBP is positive but not perfect and can be overridden by economic fundamentals, fiscal outlook, and geopolitical risks.
Summary Table
Factor Impact on GBP Strength Explanation
Rising GB10Y due to strong economy Supports GBP Attracts foreign capital inflows
Rising GB10Y due to fiscal/inflation concerns Weakens GBP Signals economic/fiscal stress
UK/US 10Y yield spread widening Supports GBP Indicates relative UK economic outperformance
Global risk-off environment Can weaken GBP despite yields Safe-haven flows favor USD or other currencies
Conclusion
While rising UK 10-year gilt yields generally support GBP strength by attracting investment, this relationship is conditional. If higher yields reflect inflation or fiscal instability, GBP may weaken despite rising yields. Traders and investors closely monitor inflation data, BoE policy signals, and the UK/US yield spread to gauge the net effect on GBP.
Here’s a direct comparison of the latest available 10-year government bond yields for JPY (Japan), GBP (UK), AUD (Australia), and USD (United States):
Country/Currency 10-Year Bond Yield (%) Notes
United States (USD) 4.54 Yields rising amid fiscal concerns, global bond sell-off.
United Kingdom (GBP) 4.77 Highest among the group; inflation data above forecasts, BoE cautious.
Australia (AUD) 4.53 Yield up after RBA rate cut; mirrors US yield trends.
Japan (JPY) 1.52 Yield at highest in over a month, but still much lower than peers.
Key Insights
GBP (UK) has the best performance on bond yield today, with the 10-year gilt at 4.77%.
USD (US) and AUD (Australia) yields are close, at 4.54% and 4.53% respectively.
JPY (Japan) lags far behind, with a 10-year yield of 1.52%.
Conclusion:
On May 21, 2025, the UK’s 10-year bond yield is the highest among GBP, JPY, AUD, and USD, making GBP the top performer in terms of government bond yield today

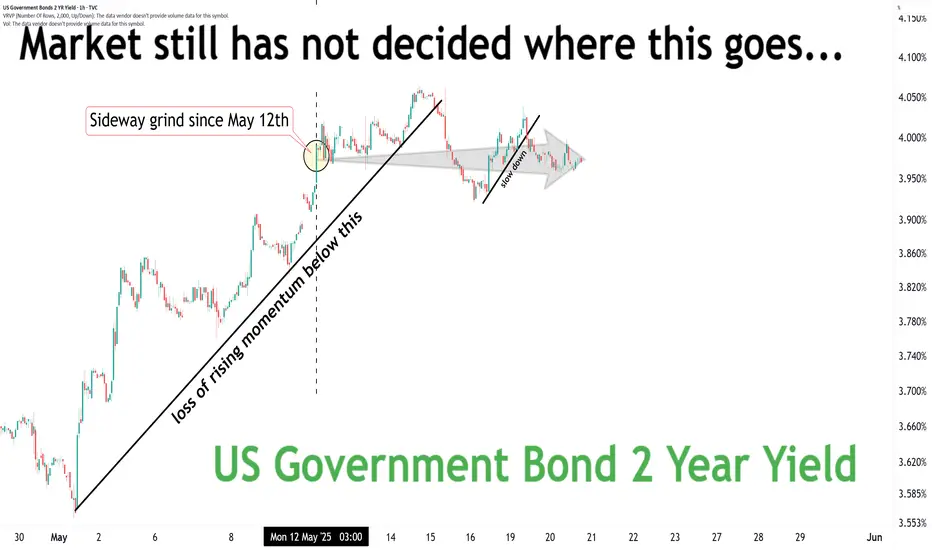
Short Term YieldsA very short term outlook on the short end of the yield curve...
This is a KEY chart to understand where the risks reside (recession or not).
Where do you think this goes next?
apan’s Bond Market Is Flashing Alarms – Carry Trade at Risk?🚨 Japan just witnessed its weakest 20-Year Government Bond auction since 1987, triggering a spike in long-dated yields:
📉 Bid-to-cover ratio at lowest since 2012
📉 Tail (spread between avg. & lowest accepted bid) was massive
📈 40Y JGB yield hit all-time highs
📈 30Y at highest since it was introduced in 1999
📈 20Y at highest level since 2000
This is a BIBLICAL move in the JGB complex.
📌 The implications?
Japan’s carry trade—a pillar of global liquidity—could be under pressure
Global bond markets may reprioritize risk
BoJ is walking a tightrope: intervene now or risk a credit crunch later?

RecessionsWatch what the aggregate of market participants are doing.
Above black= recession risk is lower
Below red = recession risk is higher
So no... the economy is not out of the woods yet.

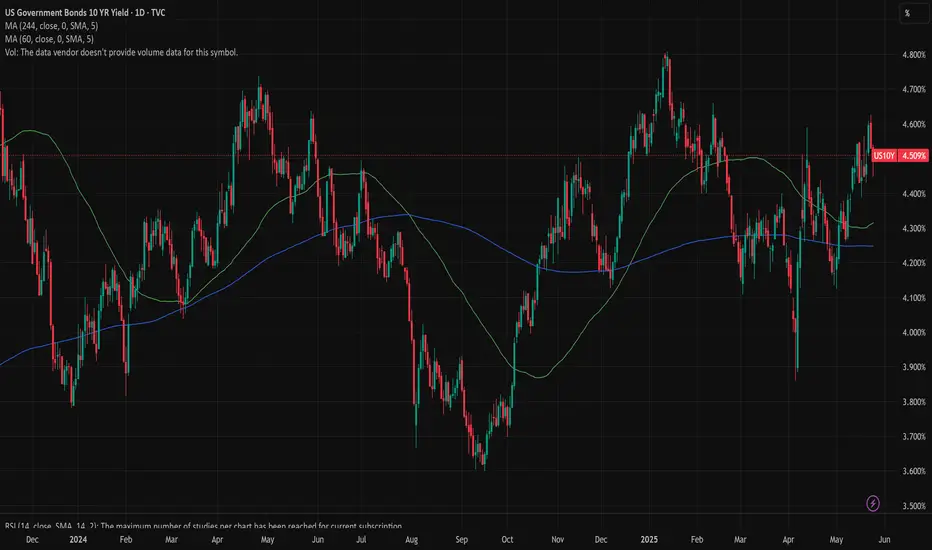
US 10Y OUTLOOK FOR THE WEEK MAY 19-23 (UPDATED DAILY)US 10y Treasury Outlook for the Week May 19-23,2025
May 19, 2025
Friday Fundamental Recap
U.S. Treasuries rose, with the 30-yr yield nearing its mid-January peak (5.005%). Gains followed Japan’s Q1 GDP contraction (-0.2%; expected -0.1%) and a strong eurozone trade surplus (EUR36.8 bln; expected EUR17.5 bln). Weak U.S. data—April Housing Starts and May Consumer Sentiment—limited gains and Moody’s U.S. credit downgrade from Aaa to Aa1 on May 16, citing $36 trillion debt, pushed yields higher.
2025 Downgrade (Moody’s, May 16, 2025):
• Immediate Reaction: Treasury yields rose after the downgrade, with 2-year Treasury yields accelerating their climb. This reflects investor demands for higher risk premiums due to perceived fiscal risks.
• Bond Prices: Higher yields correspond to lower bond prices, as investors sell off Treasuries to account for increased risk. The downgrade could lead to further price declines, especially for longer-dated bonds, if yields continue to rise.
• Market Implications: Higher borrowing costs for the U.S. government may exacerbate debt concerns, potentially leading to more volatility. Posts on X indicate expectations of “knee-jerk volatility” and a “risk-off tilt,” suggesting short-term selling pressure on Treasuries.
• Longer-Term Outlook: If investors rotate to defensive assets (e.g., gold), Treasury demand may weaken further, pushing yields higher. However, Treasuries remain the most liquid and relatively safe asset globally, which could limit the extent of yield spikes.
US Economic Calendar for the week
This week's high impact economic news will come on Thursday and Friday while the rest of the week are full of Fed speakers schedules www.myfxbook.com
Technical Outlook
Monthly
We are still trading within the April range and the closest level I could see as draw on yield is 4.59% if the weakness in price continues.
Weekly
Im a bit uncertain of the target for the week provided that we had a big news on credit down grade. If price continues to deteriorate with the news take note of previous week’s high of 4.548% to the monthly range high of 4.59% as a possible target. If market shrugs of the news look at 4.39% to be targeted.
Daily
To recap what I mentioned last Friday… “Its also important to note that market might target the Daily Volume Imbalance starting at 4.412% to 4.382%. If yield closes below 4.382% chances are price could continue to rally further. Also note the fib levels for possible key reversal points.
The news on US credit downgrade, it helped fuel the yield to rebound from our expected reversal zone. For today my bias is for yield to target previous day’s high of 4.497% if market decides to push the price lower on this news else still look at previous day low of 4.39% to 4.548%
DISCLAIMMER: This technical analysis is based on historical chart data, which may not predict future market outcomes. Any insights or interpretations I provide are for informational purposes only and should not be considered investment advice. Please conduct your own research and consult a qualified financial professional before making any investment decisions.

US 10Y TREASURY: US downgradeThere is no rest for US Treasuries. The minute the trade tensions between the US and China were settled, at least for the period of 90 days, a new storm hit the market throughout rising concerns over the sustainability of the US debt. At least as this sustainability is perceived by the rating agency Moody’s, which downgraded the US sovereign rating by one notch late Friday. This news had an negative impact on the investors sentiment, but the most volatility in the US Treasury yields occurred in an after-hours trading on Friday, when the news hit the market.
Regardless of the news about US sovereign downgrade, the higher volatility was evident also during the previous week. The highest surprise came from the University of Michigan inflation expectations, which reached 7,3% for this year and 4,6% in a period of five years. This was higher from the previous estimate and certainly was a reflection of the imposed trade tariffs between the US and China. The highest weekly level of the 10Y US benchmark was 4,54%, however, yields are ending the week at the level of 4,44% in an after-hours trading on Friday. For the week ahead, there is no significant macro data scheduled for a release, however, the volatility might continue, especially on Monday. The reaction on a downgrade news might impose some increase in yields, until the market finds the new equilibrium level. On the opposite side some modest relaxation is also probable, around 4,0%-3,8% level.

US30Y : Not perfect anymoreS&P in 2011
Fitch in 2023
Now Moody downgraded it from AAA to Aa1
The reason is clear. The market thinks debt and interest payments are not sustainable for the US, Europe, Japan, and elsewhere. Bottom line: Nowhere is safe. No government bond is safe.
If it keeps climbing, above 5.25%, the Fed will have to act. The only way is QE. However, this time US will print to save just itself. No more life line swaps for the rest. Tariff would be in place. No trade with uncle SAM anymore. If you reject the rule based order, where you recycle your surplus forex and petrodollar into UST, you can expect no help.
This is the chart to watch if you are playing XAU and BTC.
For DXY, dollar may fall. Just that the other currencies will fall FASTER.
Watch it:
a) go up above 5.25%
b) then watch if the FED goes into action.
Exit stocks like what M.Burry did a few days ago.
Good luck to all of us. This will not end well.

Treasury Yield 1 month.. US10Y, US20Y, US03MY, US01MYFunny things happen when you use a little reasoning...
don't need to explain more...but weird how the levels and the patterns just scream right at yah...

US10 YR Yield Weekly Chart Analysis: NFAUpdate: May 15, 2025
-As per my last update(April 5, 2025) about the gap between March 24th candle and March 31st candle that any candle body close above that gap will invert that gap from resistance to support and Upside target will be Jan 13, 2025 candle High
- We had a candle body close above that gap and now its acting like support.
-Now i am expecting the bullish trend to continue and long term upside target is Jan 13, 2025 candle High and Short term upside target is April 7, 2025 candle high

US10 YR Yield Weekly Chart Analysis: NFAUS10 YR Yield Weekly Chart Analysis: NFA
-After sweeping the previous swing high we retraced back to 50% Fib(Equilibrium)
-Expecting this Week's candle wick to sweep Sellside Liquidity-1 and bounce
-If we bounce from here, iFVG-W (red rectangle) will be our resistance zone
-Rejection from that level can send it back to sellside and our next target will be BISI-W(green rectangle)
If any of these Support/Resistance levels are invalidated i will update the idea next week.
**Major economic events can cause drastic moves and invalidate these levels**

"The President wants lower rates"On February 5th we heard the following from US Treasury Secretary:
“The president wants lower rates,” Bessent said in an interview with Larry Kudlow, “He and I are focused on the 10-year Treasury and what is the yield of that.”
Bessent has further stated:
“He wants lower rates. He is not calling for the Fed to lower rates,” Bessent said. Trump believes that “if we deregulate the economy, if we get this tax bill done, if we get energy down, then rates will take care of themselves and the dollar will take care of itself.”
“We cut the spending, we cut the size of government, we get more efficiency in government, and we’re going to go into a good interest rate cycle,” Bessent said.
Currently, the bond market is calling BS on the above.
IMO the only way the bond market will come down meaningfully is if and only if there is fiscal responsibility. At some point the government will understand what the bond market demands...until then we will stay higher for longer. I would not be surprised at all if the 10 year hits 5.3% this year.
A doubling of the move in the lower orange box should not surprise anyone....that puts the 10 year somewhere in the 5.4% range. IMO anywhere between 5.3 and 5.6 is certainly possible and maybe even probable.


US 10Y TREASURY: tariffs negotiationsAnother rollercoaster of US Treasury yields calmed down after the FOMC meeting held during the previous week. As expected, the Fed did not make any changes to the current levels of interest rates. However, in case that trade tariffs cause some harm to the US economy, the Fed is in position to react swiftly. The economy is still growing at a solid pace, as Fed officials see it, and the jobs market is relatively strong while the inflation is still on the target to reach gradually 2% in the coming period.
The 10Y US benchmark yields reached lowest weekly level at 4,26% and moved to the higher grounds in the after FOMC meeting trading. They have closed the week at the level of 4,39%. Markets will spend the week ahead by digesting the latest economic data and also April inflation which is due for the release on Monday. However, the US-China trade tariffs negotiations are expected to start soon, which might bring again some higher volatility and nervousness among investors and traders on the market. As per current charts, some relaxation in the 10Y yields is quite possible, however, the impact of news related to negotiations could impact moves to both sides.

US 10Y Monthly, Weekly and Daily Bias(note ill be using the charting tool Trading view for faster annotations for multi-timeframe analysis)
A. Please check relevant US Economic news that might influence price action {eco us }
May 13 US Cpi & Inflation day
May 15 Jobless Claims, Retail sales, PPI, Empire Mfg Index, Fed Powell Speech
May 16 Housing Starts
you may also access in the web and filter the high impact news feed (www.myfxbook.com)
B. Monthly Range
Price action is currently confined to April range high of 4.59% and range low 3.86%
C. Weekly Range
My Bias for the week is to target 4.43% possibly 4.489% if yield starts trading below 4.262% our bias would change.
D. Daily Bias (May 12) will try to update this daily
Previous day high has already been mitigated and I'm more biased to say the first weekly old high's 4.438% will be targeted

EWJ outperformance when?EWJ outperformance lately has been related to USD weakening against JPY which has been linked with increasing Japanese yields against US yields. Likely linked with repatriation and increase in foreign flows or decrease in outflows
