Mastering Order Blocks: How to Trade Like Smart MoneyIntroduction
Order Blocks (OBs) are one of the most critical concepts in Smart Money trading. They represent areas where institutional traders have entered the market with significant volume, typically leading to strong price movements. Identifying and trading Order Blocks gives traders an edge by aligning with the footprints of Smart Money.
What is an Order Block?
An Order Block is the last bearish candle before a bullish move for bullish OBs, or the last bullish candle before a bearish move for bearish OBs. These candles represent areas where institutions accumulated or distributed large positions, leading to a market shift.
Types of Order Blocks
A Bullish Order Block appears at the end of a downtrend or during a retracement just before the price moves sharply upward. It is typically represented by the last bearish candle prior to an impulsive bullish move. Price will often return to this level to mitigate institutional orders before continuing upward.
A Bearish Order Block, in contrast, forms at the end of an uptrend or retracement where price begins a downward reversal. It is characterized by the last bullish candle before a strong bearish move. Price tends to revisit this level to mitigate before continuing lower.
How to Identify a Valid Order Block
The key to identifying a valid Order Block is first observing a strong impulsive move, also known as displacement, that follows the OB candle. The move must also result in a break of market structure or a significant shift in direction. Order Blocks that produce Fair Value Gaps (FVGs) or Market Structure Shifts (MSS) tend to be more reliable. Another important sign is when price returns to the OB for mitigation, offering a potential entry.
Entry Model Using Order Blocks
After locating a valid OB, the next step is to wait for price to return to this area. The ideal entry happens within the OB body or near its 50% level. For extra confirmation, look for a Market Structure Shift or Break of Structure on a lower timeframe. Entries are more powerful when combined with additional elements like Fair Value Gaps, liquidity grabs, or SMT Divergences. The stop-loss should be placed just beyond the OB’s high or low, depending on the direction of the trade.
Refinement Techniques
To increase precision, higher timeframe OBs can be refined by zooming into lower timeframes like the 1M or 5M chart. Within a broad OB zone, identify internal market structure, displacement candles, or embedded FVGs to determine a more precise entry point. One effective refinement is the Optimal Trade Entry (OTE), which is often found at the 50% level of the Order Block.
Order Blocks vs. Supply and Demand Zones
While they may seem similar, Order Blocks are more narrowly defined and specifically related to institutional order flow. Supply and Demand zones are broader and typically drawn around areas of price reaction, but OBs are derived from the final institutional candle before a large move and are often confirmed by structure shifts or displacement. This makes OBs more precise and actionable in the context of Smart Money concepts.
Target Setting from Order Blocks
Targets after entering from an OB should align with liquidity objectives. Common targets include internal liquidity like equal highs or lows, or consolidation zones just beyond the OB. External liquidity targets such as previous major swing highs or lows are also ideal, especially when they align with imbalances or Fair Value Gaps. It's important to adjust targets based on the current market structure and trading session.
Common Mistakes to Avoid
A frequent mistake is treating any candle before a move as an OB without verifying key signals like displacement or a Break of Structure. Entering without other confirmations, such as an MSS or liquidity sweep, can lead to poor trades. Another common error is placing the stop-loss too tightly within the OB, instead of just beyond it, increasing the chance of premature stop-outs. Traders should also avoid executing OB trades during low-liquidity sessions where price action can be unpredictable and wicky.
Final Thoughts
Order Blocks are foundational to Smart Money trading. They allow you to enter where institutions have placed large positions and offer clear invalidation and entry logic. With practice, you can identify high-quality OBs and combine them with other concepts like FVGs, MSS, and SMT for powerful, precise trades.
Practice on different timeframes and assets, and always look for clean displacement and structure confirmation. Mastering OBs is a big step toward becoming a consistently profitable trader.
Trust the Blocks. Trade with Intention.
Crypto market

Understanding Liquidity: Where Big Players Hunt Stops
Understanding Liquidity: Where Big Players Hunt Stops
Ever wondered why price suddenly spikes through your stop-loss and reverses moments later? That’s not a coincidence—it’s liquidity at play. This article will teach you how liquidity zones work, why stop hunts happen, and how to avoid getting trapped like the crowd.
🔵 What Is Liquidity in Trading?
Liquidity refers to how easily an asset can be bought or sold without drastically affecting its price. But in practical trading, liquidity is more than just volume—it’s where traders *place* their money.
Large players—institutions, market makers, or big accounts—need liquidity to fill orders.
They target areas where many retail stop-losses or pending orders are stacked.
These areas are often just above resistance or below support—classic stop-loss zones.
To move large positions without slippage, smart money uses stop hunts to trigger retail orders and create the liquidity they need.
🔵 Where Do Liquidity Zones Form?
Liquidity often builds up in predictable areas:
Above resistance: Where shorts place stop-losses.
Below support: Where longs place stop-losses.
Swing highs/lows: Obvious turning points everyone sees.
Round numbers: e.g., 1000, 10,000, 50,000.
Breakout zones: Where breakout traders place entries or stops.
These zones act like magnets. When price approaches them, it accelerates—seeking the liquidity pool behind the level.
🔵 What Is a Stop Hunt?
A stop hunt happens when price moves just far enough to trigger stop-losses before reversing. This isn’t market noise—it’s an intentional move by big players to:
Trigger a flood of stop orders (buy or sell).
Fill their own large positions using that liquidity.
Reverse price back to fair value or the prior trend.
Example: Price breaks above resistance → stops get hit → institutions sell into that liquidity → price drops sharply.
🔵 Signs You’re in a Liquidity Grab
Look for these clues:
Fast spike beyond key levels followed by rejection.
Wick-heavy candles near highs/lows.
Price touches a level, then sharply reverses.
High volume on failed breakouts or fakeouts.
These are signs of a liquidity event—not a real breakout.
🔵 How to Trade Around Liquidity Zones
You can use liquidity traps to your advantage instead of becoming their victim.
Avoid obvious stops: Don’t place stops directly below support or above resistance. Instead, use ATR-based or structure-based stops.
Wait for confirmation: Don’t chase breakouts. Let price break, reject, then re-enter inside the range.
Watch for wick rejections: If price quickly returns after a level is breached, it's often a trap.
Use higher timeframe confluence: Liquidity grabs are more powerful when they align with HTF reversals or zones.
🔵 Real Example: Liquidity Sweep Before Reversal
In this chart, we see a textbook liquidity grab:
Price breaks below support.
Longs get stopped out.
Candle prints a long wick.
Market reverses into an uptrend.
This is where smart traders enter— after the trap is set, not during.
🔵 Final Thoughts
Liquidity is the invisible hand of the market. Stop hunts aren’t personal—they’re structural. Big players simply go where the orders are. As retail traders, the best thing we can do is:
Understand where traps are set.
Avoid being part of the crowd.
Trade the reaction, not the initial breakout.
By thinking like the smart money, you can stop getting hunted—and start hunting for better trades.

Bitcoin Price Action Analysis – Bearish Correction Toward DemandHello Guys!
Let's analyze btc!
Rising Trendline Break: The bullish structure has broken down as the price failed to hold above the key support region around $96,000–$96,200.
Targeted Demand Zone: The highlighted purple box between $94,200 and $94,700 represents a demand zone that has previously shown strong buyer interest. The current structure suggests Bitcoin may revisit this zone for a potential bounce.
Bearish Momentum: A large arrow indicates the directional bias toward the downside, aligning with the correction and market sentiment.
Fake RSI Divergence: The RSI panel indicates a “Fake Divergence” pattern, which may have misled early bulls. RSI has since dropped and currently hovers in the neutral zone, with no strong bullish signals yet.
_____________________________
Conclusion:
Unless a strong bounce occurs around current levels, Bitcoin looks poised to correct further toward the $94,200–$94,700 demand zone. Traders should watch for reactionary price action and bullish reversal patterns before considering long entries.

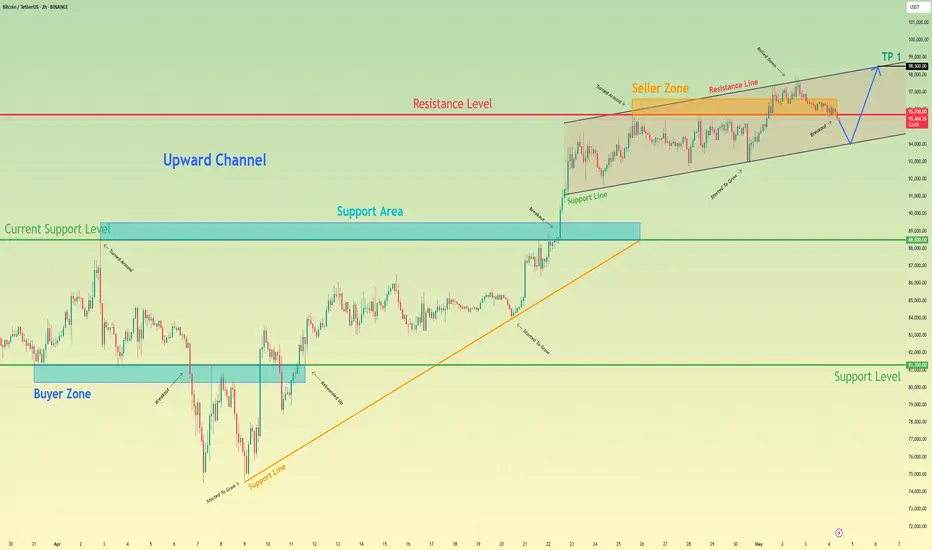
Bitcoin can bounce from support line of channel to 98500 pointsHello traders, I want share with you my opinion about Bitcoin. Looking at this chart, we can observe how the price of Bitcoin has been in recent price action. The asset had been confidently moving inside an upward channel, building structure through higher highs and higher lows. Each upward impulse was supported by pullbacks to the support line, showing continued buyer pressure. The latest breakout above the support area confirmed a bullish continuation, and the price entered the seller zone, where it faced resistance. Despite multiple attempts to break through, the price repeatedly turned around, forming a tight triangle pattern within the upper boundary of the channel. Currently, the price has broken down from the triangle, but it still holds above the channel's lower line. Given that the channel remains intact and there's no strong breakdown of the structure, I expect the price to rebound from the lower boundary and continue climbing toward my TP 1 at 98500, which aligns with the resistance line of the channel. Please share this idea with your friends and click Boost 🚀
BTCUSDT - Potential Long Setup Developing from FVG and Fib levelOverview:
Bitcoin (BTCUSDT) on the 1H timeframe is currently exhibiting a controlled retracement following a local top. This structure presents a potential opportunity for a long setup based on confluence between an FVG (Fair Value Gap) and key Fibonacci retracement levels. The chart highlights a likely scenario where price may continue to correct lower into a defined area of interest before resuming bullish momentum.
Market Context:
After a strong impulsive move upward, BTC appears to be in a corrective phase. The recent price action has formed a series of lower highs and lower lows, which is characteristic of a short-term downtrend within a broader uptrend context. This kind of pullback behavior is often necessary for healthy continuation to the upside and can offer high-probability entries for trend continuation traders.
Fair Value Gap (FVG):
A notable fair value gap has been identified in the 94,250–94,700 zone. This zone represents an inefficiency in the market where price rapidly moved without significant opposition, leaving behind a gap between wicks of adjacent candles. Price often returns to such areas to rebalance order flow before making its next decisive move.
Fibonacci Confluence:
The chart includes key Fibonacci retracement levels drawn from the recent swing low to swing high.
* The 0.618 Fibonacci retracement level lies just above the FVG, providing strong technical confluence.
* The 0.65 level is marked as the ideal entry zone and sits within the FVG, further validating it as a high-probability support region.
* The 0.786 level is also marked, and although deeper, it represents the final line of defense for this bullish scenario.
Anticipated Price Action:
A bullish projection is illustrated on the chart where price is expected to:
1. Continue declining toward the 0.65–0.618 Fibonacci confluence zone.
2. Wick into the FVG and reject from that level.
3. Form a short-term higher low structure and push back to reclaim prior structure highs.
4. Confirm bullish structure continuation with an impulsive breakout from the descending channel.
Market Structure and Liquidity Outlook:
The broader structure remains bullish on higher timeframes. The retracement into the FVG would serve the dual purpose of:
* Grabbing liquidity below recent lows.
* Mitigating unfilled buy-side inefficiency.
Such a development would suggest that institutional participants are filling long orders in the discounted price region, setting the stage for a potential continuation of the broader bullish trend.
Key Technical Zones:
* FVG Zone: 94,250 – 94,700
* Fibonacci Confluence: 0.618–0.65 retracement levels
* Liquidity Pool: Below current swing lows leading into the FVG
Conclusion:
BTCUSDT is approaching a critical decision zone. A move into the FVG combined with Fibonacci retracement confluence presents an attractive area for potential long entries. Confirmation of bullish reversal structure within this zone could offer a strong trade opportunity in alignment with the broader trend. Patience and precision will be key in waiting for the price to tap into this area and show intent to reverse.

BITCOIN → Correction to the risk zone. Rise or fall?BINANCE:BTCUSDT has updated its local maximum to 97,900, the market structure is quite positive, but still depends on the fundamental background and the behavior of the S&P 500.
The fundamental reasons that influenced the growth are the improvement in the tariff situation in the US and relations with China. Bitcoin's growth strengthened as the SP500 index rose, with which it has a fairly high correlation. In the second half of this week, the price broke out of the two-week consolidation, breaking through the resistance level of 95,500 and updating the local maximum. A correction is forming within the local upward channel.
95,000 is the liquidity and risk zone. That is, if the bulls hold their defense above 95K during the retest, Bitcoin will continue to grow in the short and medium term. Otherwise, a break of 95K could trigger a drop to 92K-88K.
Resistance levels: 97,425, 99,475
Support levels: 95,500, 92,000
All eyes are on the 95.5K support level, below which a huge liquidity pool has formed. Growth may be influenced by a retest (false breakout of support) and an imbalance of forces in the market. But we need to be careful, as the market will react to economic data. BUT! A return of prices to the selling zone (below 95000 - 95500) and the inability to continue growth could trigger a correction and liquidation.
Best regards, R. Linda!

Bitcoin: First Leg Of Wave 5 To 109K.Bitcoin has lingered around the 95K resistance area over the previous week. In my opinion this is a sub wave iii completion (5 mini waves can be counted within the bullish breakout leg). This implies there is a greater probability of a retrace or sub wave iv (see wave count on chart). The retrace can go as low as the 90K support without overlapping sub wave i which would keep the bullish impulse in play. Also there is enough evidence here to suggest this structure is likely the first wave of the broader Wave 5 which can see a test of the 109K high over the coming months.
The current high (see arrow) shows signs of potential reversal at a location where such a pattern can be expected. The question is, when will it retrace and how far? It is anyone's guess. This is where you have to have the ability to adjust as the market provides new information. Until then the best we can do is assess loose probabilities and wait to see how the market aligns or not.
The adjustment process is two fold: evaluating support/resistance levels and assessing the RISK associated with a given scenario. For example, the illustration on the chart shows a retrace back to 90K, this or some variation of this scenario may or may not unfold. The key is to have levels identified in advance and then WAITING to see how the market behaves at such levels. Does it confirm our idea or not? In the case of Bitcoin now, the 95K area resistance is sticking and a reversal pattern has appeared which adheres to the retrace scenario, but how far it retraces is up to Bitcoin. We have to wait and see what type of bullish reversals appear and where they appear before RISK can be assessed for a swing trade on this time frame.
Markets that linger around levels can be very hard to trade if you are the type that forces trades or assert opinions. Slow grinds are especially tough to sit through which is why I always suggest evaluating smaller time frames while keeping this bigger picture in mind. There are plenty of smaller opportunities to capitalize on if you can recognize the support/resistance levels and trend structure on the smaller time frames without losing site of the bigger picture.
On this time frame for swing trades, I am not interested in the short side. I prefer to wait for the retrace (wave iv) measure to see how far it goes, WAIT for the reversal confirmation, then quantify the RISK from that point. IF this scenario appears, I would be anticipating a retest of the 100K resistance and expecting a greater chance of a breakout to a higher high (low to mid 100ks)? This can take at least two weeks to play out in my opinion. And if this scenario does not play out, then adjust to the whatever new information the market is presenting.
Thank you for considering my analysis and perspective.

BTC - Golden Pocket test & what comes next?Bitcoin (BTC) has been steadily recovering from its January correction, entering a promising uptrend that has now brought it to a crucial technical juncture: the Golden Pocket Fibonacci zone, which lies between the 61.8% and 65% retracement levels. This area is widely watched by traders, as it often serves as a springboard for either significant reversals or continuation of the trend.
4H timeframe
On the 4H timeframe, BTC recently formed an ascending triangle, a classic bullish continuation pattern. The price managed to break above the triangle’s resistance, but it failed to hold above this level, closing back below the breakout zone. This lack of follow-through signals weakness and suggests that a short-term pullback could be imminent.
Daily timeframe
Turning to the daily chart, the situation becomes even clearer. After reaching the Golden Pocket, BTC printed a bearish engulfing candlestick, a strong reversal signal. The subsequent price action saw BTC break below both the 4H support and a daily FVG, further strengthening the case for a deeper correction or trend reversal. If this downward momentum continues, the next major support zone is likely between $89,000 and $91,000. This area marks an imbalance created during the previous rally and is a natural target for buyers to step in.
However, the bullish scenario is not entirely off the table. If BTC can reclaim and hold above the Golden Pocket, it would signal a resumption of the uptrend, with the next key target being the psychologically significant $100,000 level. For now, though, the technical structure suggests that a retracement toward the $89–91k zone is more likely before any attempt at new highs.
Conclusion
In summary, Bitcoin’s recent test of the Golden Pocket Fibonacci zone has resulted in a short-term rejection. The immediate outlook is cautious, with a likely retracement toward $89–91k. Traders should watch closely for confirmation signals in both price action and volume before making new commitments. A successful hold above the Golden Pocket would open the door for a rally toward $100,000, but for now, patience and careful observation are advised.
Thanks for your support.
- Make sure to follow me so you don't miss out on the next analysis!
- Drop a like and leave a comment!

BTC/USD) bullish trend analysis Read The ChaptianSMC Trading point update
Technical(BTC/USDT) analysis outlines a bullish outlook with key technical levels and scenarios. Here's a breakdown of the idea:
Key Observations:
1. Trend Break and CHoCH (Change of Character):
The chart shows a clear break of the downtrend, confirmed by the CHoCH label — a common Smart Money Concept (SMC) signal indicating a potential trend reversal from bearish to bullish.
2. Key Zones Highlighted:
EVC-Buying Zone: Around 86,000 – 88,000 (aligned with EMA 200), marked as a strong accumulation area.
New Support Level: Around 92,000 – 93,000, potentially forming a bullish support after the recent rally.
Resistance Levels: Two major resistance zones near:
99,600 (intermediate resistance and target)
106,400 (final target)
3. RSI Indicator:
RSI is near 64, indicating strong momentum but not yet overbought — a potential sign of further upside.
4. Two Bullish Scenarios:
Scenario 1 (Aggressive Bullish): BTC continues upward from the current level and breaks above resistance toward the 106,447 target.
Scenario 2 (Retracement Bullish): BTC dips to the new support or even into the buying zone (86–88k), then rebounds to reach the same targets.
Mr SMC Trading point
---
Idea Summary:
The chart suggests bullish continuation, with potential pullbacks into strong demand zones. It supports both breakout and retracement entries, with targets at 99,632 and 106,447. If price holds above EMA 200 and RSI remains supportive, the upside thesis remains valid.
Pales support boost 🚀 analysis follow)

BTC Building Strength – Breakout Ahead?$BTC/USDT Weekly Analysis
Bitcoin continues to respect the 50 EMA on the weekly timeframe — a key dynamic support level that has consistently held throughout this bullish structure.
Each time BTC corrected, it found support near the 50 EMA before bouncing back with strength. The current structure mirrors past price action, with price again rebounding from the EMA after a consolidation phase.
We’re also seeing a pattern of lower highs forming a potential descending resistance line. A breakout above this trendline could trigger a fresh rally, possibly taking BTC to new highs.
As long as Bitcoin stays above the 50 EMA, the mid-to-long-term bias remains bullish. A confirmed breakout above the descending resistance could open the door for a strong upside continuation.
DYOR, NFA
Thanks for following along — stay tuned for more updates!

BTC - Golden Pocket & Strong FVG Resistance for a Short SetupThe current 15-minute chart of BTCUSDT reveals a textbook bearish setup forming as price retraces into a well-defined supply zone. This analysis focuses on structural breakdowns, liquidity engineering, and key Fibonacci confluences that may lead to a short-term reversal within intraday price action.
Overview of Market Structure:
BTCUSDT has been in a clear intraday downtrend with consistent lower highs and lower lows being formed. The recent price action reflects a temporary consolidation phase following the creation of a new swing low. This minor pullback appears to be corrective in nature, moving upward toward a previously established zone of inefficiency.
At the center of this setup is a well-marked bearish fair value gap (FVG), highlighted with a blue shaded rectangle, where institutional selling is expected to have previously occurred. This FVG formed after a strong displacement candle, suggesting unmitigated sell-side imbalance left in the market.
Retracement Zone and Fibonacci Confluence:
As price retraces upward, it enters the equilibrium region of the recent bearish impulse, with notable confluences around the 0.618 and 0.65 Fibonacci retracement levels. These retracement levels are critical markers where smart money algorithms often execute continuation plays during trending phases.
Both the 0.618 and 0.65 levels fall within the center of the FVG zone, further strengthening the case for this being a valid supply area. These levels are plotted with horizontal lines on the chart and serve as ideal zones to monitor for signs of rejection or bearish order flow resumption.
The 0.786 retracement, marked just above the upper boundary of the FVG, acts as a final extremity level. This level often coincides with liquidity pools where stop hunts are engineered before the actual move begins. Its proximity to a recent swing high makes it an area of interest for potential liquidity grabs prior to a deeper move down.
Projected Price Path and Liquidity Targets:
The projected blue path illustrates an expected liquidity sweep into the FVG zone, followed by a sharp rejection. This aligns with the idea of engineered liquidity collection before continuation in the original trend direction. The move anticipates price reaching back into the area of prior support, targeting unmitigated demand near recent lows.
Of particular interest is the area around the 0.28 Fibonacci extension level, which acts as a probable magnet for price in the event of a successful rejection. The chart structure suggests that once the short-term retracement completes, there is room for a new impulse leg lower.
Internal Structure Observation:
The current lower timeframe structure shows rising momentum toward the FVG. However, this upward push lacks aggressive bullish volume and appears corrective rather than impulsive. This suggests that buyers are likely exhausting themselves as price nears the supply zone.
Additionally, the structure within this move is developing lower-timeframe liquidity pools (equal highs and tight consolidation), which could act as inducement for a sweep before the potential reversal occurs.
Conclusion:
This chart offers a well-structured short setup based on supply zone rejection, Fibonacci confluence, and a bearish market structure. The fair value gap zone between the 0.618 and 0.65 retracement levels is key, and price action within this area will be crucial in determining the next directional leg. If bearish confirmation such as an engulfing pattern or break of market structure occurs within or after tapping this zone, it would validate the bearish outlook for a short-term continuation to the downside.
This setup is ideal for intraday traders focused on precision-based entries rooted in institutional order flow principles.

(BTC/USD) 1H Trade Setup – Key Entry, Stop Loss & Dual TargetEntry Point: 95,431
Stop Loss: 95,264
Target Points:
Upside (Target 1): 100,674 (Potential gain: +5.36%)
Downside (Target 2): 86,614 (Potential loss: -7.57%)
Trade Setup:
Risk-Reward Ratio:
Approx. 1:0.7 (Not ideal; the reward is smaller than the potential loss)
Support Zones:
Highlighted in purple beneath the entry zone — this indicates a historically strong support area.
Resistance Zones:
The upper purple zone marks the next significant resistance around 100,000–100,795.
Technical Indicators:
50 EMA (Blue Line): Indicates mid-term trend support, currently holding price action.
Price Action: BTC appears to be retracing toward support after a bullish rally.
Interpretation:
The setup implies a long (buy) position with a very tight stop loss.
The price is nearing a support zone, and if it holds, there's potential for an upward move to the target at 100,674.
However, if price breaks below 95,264, a sharp drop to 86,614 is anticipated.

TradeCityPro | Bitcoin Daily Analysis #81👋 Welcome to TradeCity Pro!
Let’s get into the analysis of Bitcoin and the key crypto indices. As usual, I’ll review the futures triggers for the New York session.
⏳ 1-Hour Timeframe
As you can see, Bitcoin has continued its correction down to the 95370 level and is currently testing this zone.
✔️ If the price breaks below this level and moves further down, we will start to see signs of a trend reversal. However, for short positions, I personally prefer to wait for a confirmed trend reversal.
📈 For long positions today, if the price pulls back to the 95370 zone, you can consider entering. Confirmation of the pullback can be taken from lower timeframes through candlestick signals or structural breaks.
📊 Market volume increased during the last corrective leg, which could raise the probability of a break below 95370.
👑 BTC.D Analysis
Moving on to Bitcoin dominance — the range between 64.77 and 64.91 still holds, with price fluctuating within.
⚡️ A breakout above 64.91 would confirm the continuation of the uptrend. A break below 64.77 could suggest a deeper correction.
📅 Total2 Analysis
Looking at Total2, the 1.03 support has broken and price is now moving downward. If this trend continues, it could drop to lower support levels.
⭐ However, if the break below 1.03 turns out to be a fakeout, price could rebound and head back toward 1.05.
📅 USDT.D Analysis
Finally, USDT dominance has closed above 5.10 today and may be starting its bullish leg.
💥 If this upward move continues, the market could experience a broader sell-off. Should Bitcoin triggers activate, this would be a good context to consider short positions.
❌ Disclaimer ❌
Trading futures is highly risky and dangerous. If you're not an expert, these triggers may not be suitable for you. You should first learn risk and capital management. You can also use the educational content from this channel.
Finally, these triggers reflect my personal opinions on price action, and the market may move completely against this analysis. So, do your own research before opening any position.

DOT NEXT TARGET ??CRYPTOCAP:DOT Polkadot is trading near the lower boundary of the parallel channel pattern on weekly timeframe👀
Strong buying and increased volume suggests accumulation at this critical support zone🧐
If support holds, expect price to bounce towards targets at $6.10, $7.90, $11.00 and $16.00🎯

Bitcoin soon again 100K$(any breakout there can cause huge pump)As we can see technically we have last and major resistance zone ahead which is 100K$ resistance zone and also red trendline sell pressure is exactly there But we can also expect breakout to the upside and more pump in next weeks and even new possible ATH at least near 120K$.
Notice: 100K$ is now major resistance and we may have short-term fall or range near this resistances zone but soon or late the breakout with pump is coming.
DISCLAIMER: ((trade based on your own decision))
<<press like👍 if you enjoy💚

BITCOIN I Weekly CLS, KL OB,Model 1 I Target 50% of CLSAs investor Im longterm bullish , but from the trader perspective my system says short.
Hey, Market Warriors, here is another outlook on this instrument
If you’ve been following me, you already know every setup you see is built around a CLS range, a Key Level, Liquidity and a specific execution model.
If you haven't followed me yet, start now.
My trading system is completely mechanical — designed to remove emotions, opinions, and impulsive decisions. No messy diagonal lines. No random drawings. Just clarity, structure, and execution.
🧩 What is CLS?
CLS is real smart money — the combined power of major investment banks and central banks moving over 6.5 trillion dollars a day. Understanding their operations is key to markets.
✅ Understanding the behaviour of CLS allows you to position yourself with the giants during the market manipulations — leading to buying lows and selling highs - cleaner entries, clearer exits, and consistent profits.
🛡️ Models 1 and 2:
From my posts, you can learn two core execution models.
They are the backbone of how I trade and how my students are trained.
📍 Model 1
is right after the manipulation of the CLS candle when CIOD occurs, and we are targeting 50% of the CLS range. H4 CLS ranges supported by HTF go straight to the opposing range.
📍 Model 2
occurs in the specific market sequence when CLS smart money needs to re-accumulate more positions, and we are looking to find a key level around 61.8 fib retracement and target the opposing side of the range.
👍 Hit like if you find this analysis helpful, and don't hesitate to comment with your opinions, charts or any questions.
⚔️ Listen Carefully:
Analysis is not trading. Right now, this platform is full of gurus" trying to sell you dreams based on analysis with arrows while they don't even have the skill to trade themselves.
If you’re ever thinking about buying a Trading Course or Signals from anyone. Always demand a verified track record. It takes less than five minutes to connect 3rd third-party verification tool and link to the widget to his signature.
"Adapt what is useful, reject what is useless, and add what is specifically your own."
— David Perk aka Dave FX Hunter ⚔️

BITCOIN Trending Higher - Will Buyers Push Toward $104,550?COINBASE:BTCUSD has broken above a key resistance zone and is now pulling back for a potential retest. This area previously acted as resistance and may now serve as support, aligning with a potential bullish continuation.
If buyers confirm support at this level, the price is likely to move upward toward the $104,550 level, which serves as a logical target for this setup. Conversely, a failure to hold support could signal a potential bearish shift.
Traders should monitor for bullish confirmation signals, such as bullish engulfing candles, strong wicks rejecting the support zone, or increased buying volume, before considering long positions.
Let me know your thoughts or any additional insights you might have!

Hellena | BITCOIN (4H): LONG to resistance area of 101,000.Dear colleagues, in the coming week I expect price to continue rising in wave “5”. I think that wave “3” is already completed and now we are witnessing a small correction.
Reaching the resistance area of 101,000 will be the end of the big “ABC” correction.
The 91,601 area could be a good support area to complete the correction.
Manage your capital correctly and competently! Only enter trades based on reliable patterns!

SAGA Rebuy Setup (8H)A strong move has formed, and we have a bullish CH (Change of Character) on the chart.
We can look for buy/long positions around key zones, as buyers are present in these areas.
We are focusing on buy/long positions at the entry points.
Targets are marked on the chart.
A daily candle close below the invalidation level will invalidate this analysis.
For risk management, please don't forget stop loss and capital management
Comment if you have any questions
Thank You

Bitcoin Buy Opportunity: Last Chance To Buy Below $100,000Bitcoin isn't trading at $78,800 nor $80,000 nor even $85,000 but still, even a small retrace is good to buy; even a small retrace is better to buy and enter a new trade than when prices are moving up.
A strong support range consisting from the lows of December 2024, January and February 2025 can be seen mapped on the chart. The lows on these date produced a support range between $89,250 and $94,250.
Bitcoin is now not trading within this range but if it does go there let me be the one to tell you that this would be an amazing entry zone and buy opportunity. This is marked green on the chart.
The truth is that when Bitcoin goes bullish it never looks back, it grows and grows and grows but, since we are set for the 2025 bull market and several new All-Time Highs, any retraces should be bought strong because there might not be another chance like this available.
Whenever the market goes red, that's the time to buy strong, go LONG and prepare for the continuation of the bullish trend.
Whenever the market turns green, we just let it grow and secure small portions of profits when resistance is hit. Rinse and repeat.
Right now Bitcoin is red but it won't be red for too long. See the trade-idea below to understand how Bitcoin will behave around this resistance zone:
It is the inverse image of the February drop. It will range a few days around this zone and then produce a very strong advance. This is your last chance to accumulate below 100K while Bitcoin is still low.
Once Bitcoin moves above 100K, 90K is gone. Just like $75,000, it is gone for this entire cycle. Just like $80,000, you cannot buy at $80,000 anymore. The same for $85,000 or anything below 90K.
This is the last chance to buy Bitcoin below $100,000 before the continuation of the bullish trend. This opportunity can remain open for a few more hours just as it can last a few days. But it won't be available for too long. Make your decision now, Crypto is going up.
Thanks a lot for your continued support.
Namaste.

BTC Roadmap — May 2025🚨 BTC Roadmap — May 2025
Here’s the timeline you’ll want to pin and come back to.
⸻
🔴 May 4–6
Low volume. No major moves expected.
BTC goes DOWN and BTC dominance starts trending down, but it’s not the moment to jump in yet. Patience.
🟢 May 7–9: ALT PUMPS
BTC Volume increases!
BTC UP
This is the first major altcoin opportunity.
🔴 May 10–13: SELL SIGNAL
This is your exit window.
1D SELL confirmed. Prepare for cooling.
BTC Volume drops.
⚪️ May 15–17: May USDT.D will go UP!
USDT dominance reaches a local bottom - BTC HUGE DUMP .
BTC Volume rises again → BIG MOVE up after 17th.
🟢 May 17–20: BTC and ALT PUMPS
Perfect LONG entry zone.
🔴 May 21–23: USDT HIGH — market will go UP faster!
USDT.D peaks. BTC and altcoins prepare for breakout.
BTC Volume high.
💸 Dollar weakens → Risky assets explode (BTC, alts, growth)
⸻
NOT FINANCIAL ADVICE

FILUSDT Potential UpsidesHey Traders, in today's trading session we are monitoring FILUSDT for a buying opportunity around 2.60 zone, FILUSDT is trading in an uptrend and currently is in a correction phase in which it is approaching the trend at 2.60 support and resistance area.
Trade safe, Joe.

Quant's 2025 All-Time High Potential Revealed In This AnalysisQuant has been producing higher lows since June 2022, a solid base.
QNTUSDT is about to close its fourth week green and this week is a full green candle. A strong advance/bullish breakout and months of bearish action recovered to now trade within the bullish zone.
What is happening here is the same dynamic that will be happening across all the Altcoins. After a major low on 7-April we get growth, growth, growth. Allow for small swings because the market never moves straight down nor straight up, it fluctuates creating waves.
Down-waves, up-waves but something is certain, higher highs and higher lows long-term. We are now within a strong bullish phase.
The high in December 2024 produced the highest prices since October 2022 and was corrected to a long-term higher low. A higher high will happen next comes next and this is the beginning of this higher high. The easy target being $211 and this is a higher high but for this higher high to be technically relevant it has to go even higher so we are aiming for $230 or higher, $310.
Will Quant go beyond $310? It is possible and do-able, also highly probable. The $410 target is a strong target but can be done. Can I be honest with you? It is possible that Quant moves even higher producing a new All-Time High by the time the 2025 bull market runs its course.
Find more details on the chart.
Namaste.
