Bitcoin ready to make some critical decisions. BTC is bullish if the price stays above the 92k zone. A sign of weakness would be a CHOCH by printing a confirmed lower high. The bearish scenario is that the price comes down to the mid-80s. The bullish thesis is the moon.
Full TA: Link in the BIO
Crypto market

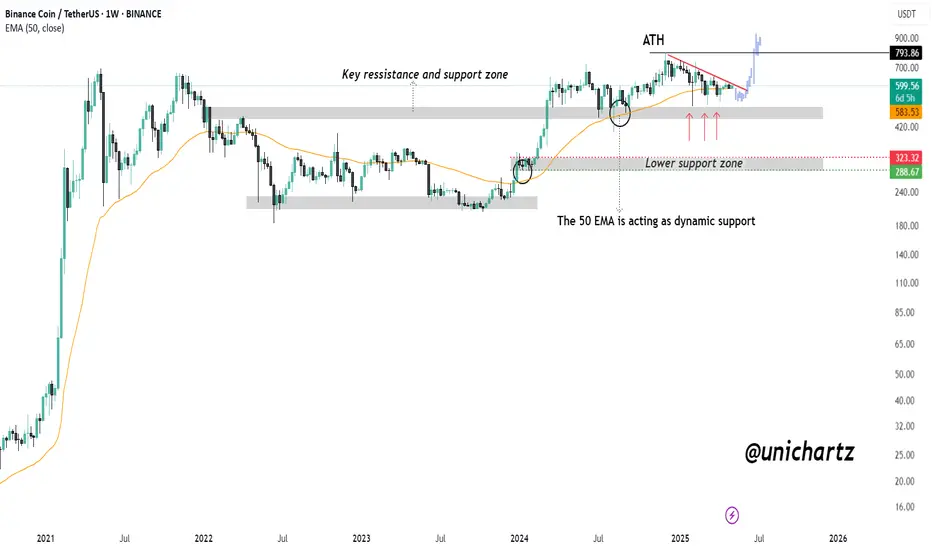
BNB Bull Flag Activated — Watching for $794 CRYPTOCAP:BNB is showing strong bullish momentum after rebounding off the marked support zone. This level, which previously acted as resistance, is now holding firmly as support following the breakout.
As long as BNB sustains above this zone, the bullish structure remains intact — and the path toward a new All-Time High (ATH) around $794 is wide open. The 50 EMA continues to act as dynamic support, further strengthening the setup.
DYOR, NFA
$AVAX/USDT Trade Setup - Daily TF$AVAX/USDT Trade Setup – Daily TF
#AVAXUSDT has broken a multi-month downtrend and is retesting a key demand zone, offering a clean long opportunity.
Entry: $19.70–$20.00
Stop Loss: $15.00
Targets: $27 / $35 / $55
Invalidation: Close below $15... DYRO, NFA
Watch for a bullish confirmation before entry.
Swing setup with strong potential if the demand holds.

BTC SHORT TERM FOLLOW UP BE SURE TO BUY AT 89-91k"Last alert for the dip — this is a follow-up to my initial analysis on the short-term period."

Long tradeSOLUSDT (Buy Side)
🗓 Date: Monday, 5th May 2025
⏰ Time: 12:30 PM
📍 Session: London AM
Pair: SOL/USDT
📈 Direction: Long (Buy Side)
Entry Price: 143.920
Take Profit: 146.443 (+1.75%)
Stop Loss: 143.740 (−0.13%)
Risk-Reward Ratio: 14.02
Reason: Based on observation of price action and momentum to the upside, as well as observing ETH and BTC served as confirmation to the buyside trade.
15min TF overview

Bullish on Litecoin: Targets Set at $135 and $145Litecoin (LTC) is showing strong signs of a bullish reversal after a sustained period of consolidation and a failed breakdown from a critical support level. The price recently bounced from the strong support zone at $62.97, confirming this level as a reliable base. Notably, the asset failed to break below this support, suggesting accumulation and potential for upward momentum.
Currently, LTC is trading around $87, just above the local resistance and forming a bullish structure. A clear breakout above this region could trigger a strong upward move toward the next resistance target of $135.43, and potentially the second target at $145.46, which aligns with a historical resistance level.
A well-placed long trade setup is visible:
Entry Point: $87.04
Stop Loss: $74.66 (approx. -14.80% risk)
Take Profit: $135.43 (approx. +54.55% potential upside)
This trade offers a favorable risk-to-reward ratio of 3.69, making it attractive for bullish traders.
The MACD indicator below the chart is also showing early bullish crossover signals, with the MACD line approaching a break above the signal line. If this momentum continues, it would further support the bullish outlook.
Fundamental Insight: Why Litecoin Has Long-Term Potential
Litecoin offers several key technical differences compared to Bitcoin:
Faster transaction speed: 2.5-minute block time vs. Bitcoin’s 10 minutes
Lower transaction costs
Uses Scrypt instead of SHA-256 for its proof-of-work consensus
Larger maximum supply: 84 million vs. Bitcoin’s 21 million
Positioned as the "silver" to Bitcoin's "gold," Litecoin serves as a faster, more scalable alternative in real-world transactions. With its four-year halving cycle, similar to Bitcoin, and historical resilience, LTC continues to be a solid mid-cap crypto asset for long-term holders.

PHA Multi-Timeframe Setup – Reversal in Progress?🚨 PHA Update Across Weekly & Daily Charts!
🧱 Weekly Chart: Price recently bounced from a strong support zone, showing signs of a potential reversal from this critical level.
📈 Daily TF: After breaking out of a falling wedge, PHA is now trending within an ascending parallel channel—a bullish continuation pattern.
⚡ Key Level to Watch: A breakout above 0.13 could confirm upside momentum and trigger the next leg up! 🚀
👀 Clean structure and growing buyer interest—keep this one on your radar!

XRPPrice has swept the Weekly Lows of last week. Now, we should begin our climb towards $2.36, which was previous weeks high.
We may see a impulse move towards $2.26 mid week, followed by more buying heading into the weekend.
If we fail to break above $2.26 we may see more drawdown towards $2.08 support.
There are plenty of catalyst to propel us towards $2.50+, we should still be accumulating if possible.
Stay diligent, our time is coming!

Blow off soon?PSA this is just ripping off Peter Brandt's tweets. I gathered his breadcrumbs and pieced together this analysis.
His most recent comment in April '25 suggested that the recent BTC pullback was a back-test of a long standing reverse H&S formation. He has not provided any charting of this formation afaik but I reverse engineered it and I believe this is the formation he is referring to.
He has also said several times that he feels the peak will be in Sept '25 at around $140,000.
Given this information, we have a rough roadmap of how we ought to get there. The market has cooled off since inauguration day and could be preparing for the blow off top.
Fingers crossed!

Bitcoin a Technical Summery technical summary based on what you're describing for BTCUSDT on the 4H timeframe:
Forecast from Mr Martin Date 05 May 2025
Current Setup:
Pattern: Two-sided consolidation/pattern (likely symmetrical triangle or range)
Key Support: ~89,000 USDT
Key Resistance: ~95,000 USDT
Scenarios:
Bullish Breakout:
If price holds above 95K and confirms breakout: Next target: ~98,000 USDT
Above 98K, could test psychological levels like 100K.
Bearish Breakdown: If price falls below 89K:nExpect a retest or quick rebound toward resistance (~95K).
You may see more details in the chart Ps Support with like and comments for more analysis Thanks

VRA has a long way to go on the weeklyThis shows VRA on the weekly. Looks like this would could go for 28 days to the top. Keep looking for the negative divergence on the 3 day.

BTC Poised for Bullish continution / Smart money long setup🟢 BTCUSD | Long Setup Based on Smart Money Concepts (4H Timeframe)
Bitcoin is showing a potential bullish continuation after tapping into a key demand zone (Order Block) aligned with Smart Money Concepts.
🔍 Breakdown:
BOS (Break of Structure) confirms a shift in market structure, indicating bullish intent.
Price formed a new Higher High (HH) followed by a retracement into a 4H Bullish Order Block, highlighted in orange.
Liquidity below internal range lows has been swept, grabbing sell-side liquidity before reversing.
Strong bullish reaction from the OB zone suggests smart money accumulation.
📈 Anticipated Scenario:
Price is expected to form a new Higher Low (HL) and continue its bullish trend by breaking above recent highs — targeting levels near $97.7K, $96.1K (minor retracement), and ultimately $99.5K.
🎯 Entry Idea:
Long from the OB zone with confirmations (e.g., bullish engulfing or LTF BOS).
SL below the OB.
TP at key liquidity zones & imbalance fills.
🧠 Smart Money Bias: Bullish
Timeframe: 4H
Confirmation: Break of internal structure + bullish reaction from demand

Long trade
5min TF ovewrview
📘 Trade Journal Entry
DOGEUSDT (Buy Side)
🗓 Date: Monday, 5th May 2025
⏰ Time: 12:00 PM
📍 Session: London to New York PM Transition
🪙 Pair: DOGE/USDT
📈 Direction: Long (Buy Side)
🔹 Entry Details:
Entry Price: 0.16894
Take Profit: 0.17375 (+2.85%)
Stop Loss: 0.16884 (−0.06%)
Risk-Reward Ratio: 48.1
🔹 Trade Context:
Executed during the London–New York PM crossover, often a key window for major intraday reversals or trend continuations. Market structure showed a series of higher highs, confirming bullish intent and sustained buyside pressure.

Long trade
📘 Trade Journal
Entry BTCUSD (Buy Side)
🗓 Date: Monday, 5th May 2025
⏰ Time: 12:00 PM
📍 Session: London to New York Overlap (AM)
Pair: BTC/USD
📈 Direction: Long (Buy Side)
🔹 Entry Details:
Entry Price: 93,883.46
Take Profit: 94,533.51 (+0.69%)
Stop Loss: 93,858.02 (−0.03%)
Risk-Reward Ratio: 25.55
🔹 Trade Context:
Entered during the London–New York overlap, a peak liquidity window where breakout and continuation setups often occur.

Has Trading Made You Addicted to Adrenaline?# **Has Trading Made You Addicted to Adrenaline?**
If you trade with **Leverage** and are constantly **liquidating**, you may be suffering from **Trading Addiction** or **Adrenaline Addiction**. Let's look at the signs and solutions.
---
## **🔹 Signs of Trading and Adrenaline Addiction**
✅ **1. Feeling Extreme Excitement While Trading**
- When you open a position, does your heart rate increase and you feel extreme excitement?
- This is a sign of **adrenaline** and **dopamine** (the pleasure hormone) being released.
✅ **2. Liquidating repeatedly, but continuing**
- Do you re-enter with new money after each liquidation?
- This behavior is similar to **gambling** and is a sign of addiction.
✅ **3. Disruption to daily life**
- Do you constantly check the chart, even at work or while sleeping?
- Are your social or professional relationships damaged?
✅ **4. Inability to control emotions**
- Do you get angry after a loss and **revenge trading**?
- This behavior is a sign of **psychological addiction** to trading.
---
## **🔹 Are you addicted to trading? (Quick test)**
| **Question** | **Yes** | **No** |
|----------|--------|--------|
| Do you risk more than you can afford to lose? | ⚠ | ✅ |
| Do you feel regret after liquidation but still repeat it? | ⚠ | ✅ |
| Do you prefer trading to family, friends or work? | ⚠ | ✅ |
| Do you stay up at night to trade or not rest? | ⚠ | ✅ |
🔴 **If most of the answers are "yes", you are probably struggling with a trading addiction.**
---
## **🔹 Treatment strategies for trading addiction and adrenaline**
### **1. Set strict rules for trading**
- 🔹 **Set a maximum daily loss** (for example, 5% of the account).
- 🔹 **Do not use high leverage** (more than 5x is dangerous).
- 🔹 **Set a mandatory Stop Loss**.
### **2. Manage trading like a business, not gambling**
- 📉 **Learn fundamental/technical analysis**, do not trade by chance.
- 📊 **Have a Trading Plan** and stick to it.
### **3. Detox Trading**
- 🚫 **Do not trade for a full month** to reduce psychological dependence.
- 🧘♂️ **Find alternative hobbies, exercise, or hobbies**.
### **4. Counseling with a psychologist or therapist**
- 🧠 If you have difficulty controlling your emotions, seek help from a **behavioral addiction specialist**.
### **5. Changing your trading environment**
- ❌ **Remove trading apps from your mobile** (use only your computer).
- 👥 **Join trading groups that have strict rules.**
---
## **🔹 Conclusion: Are you addicted?**
- If you **constantly get liquid but still continue**, you are probably addicted to **adrenaline trading**.
- Trading should be **based on strategy**, not **excitement and luck**.
- If you can't control yourself, **seeking help from a psychologist or temporarily quitting** is the best way.

FARTCOIN Breakout and Potential RetraceHey Traders, in today's trading session we are monitoring FARTCOIN for a selling opportunity around 1.1650 zone, FARTCOIN was trading in an uptrend and successfully managed to break it out. Currently is in a correction phase in which it is approaching the retrace area at 1.1650 support and resistance zone.
Trade safe, Joe.

ETH/USD: Struggling at $1,850 – What Traders Should Watch NextQuick Overview:
Ethereum has repeatedly tested the $1,850 zone over the past week but has failed to gain traction. Key technical levels are stacking up to form a robust resistance barrier, and without fresh volume, any breakout attempt will likely fizzle.
Key Highlights:
Confluent Resistance at $1,850: VWAP-based resistance, the 0.618 Fibonacci retracement of the recent swing, a daily supply zone, and the Point of Control all converge here.
Volume Drying Up: Each rally attempt has suffered from below-average volume, indicating a lack of buyer conviction.
Channel Context: ETH remains capped by the upper boundary of its multi-month rising channel, reinforcing the bearish case until broken.
Full Analysis:
Ethereum’s recent price action shows a classic “climbing a wall” pattern: each push toward $1,850 stalls and retreats. This level is not arbitrary—it sits at the intersection of several major technical indicators. The VWAP (Volume-Weighted Average Price) has flipped to resistance after acting as support earlier in the rally, signaling that the average trader is now underwater at these prices. The 0.618 Fib retracement from the last major low to high adds a psychological layer, as many algorithmic strategies key off this golden ratio. Finally, the Point of Control from the current volume profile highlights $1,850 as the price where most trading volume occurred, making it a natural supply zone.
Rallies into this region have been met with tepid volume, suggesting that bulls are unwilling to commit at higher prices without a clear catalyst. On lower timeframes, candlesticks near $1,850 display long upper wicks and declining body sizes—classic signs of exhaustion. Meanwhile, the broader up-channel that’s governed ETH since late 2024 remains intact, capping upside and defining the trading range.
Bias & Trade Considerations:
Bearish Lean: Until ETH can close and hold above $1,850 on strong volume, the path of least resistance remains down.
Short Entry Zone: Consider entering short positions into $1,850–$1,860, with a stop overhead of the channel line. Initial targets near the range mid ($1,700) and the 200-day MA around $1,650.
Invalidation Criteria: A decisive daily close above $1,850 with above-average volume would invalidate the bearish thesis and open targets toward $1,950–$2,000.
What to Watch Next:
Volume Spikes: A volume surge above the 20-day average during an upside move would signal renewed buying power.
Channel Break: A clear break of the channel’s upper trendline on the daily chart is required to shift the bias bullish.
Support Levels: If $1,850 holds as resistance, monitor $1,800 and $1,750 for potential bounce areas.

Fartcoin: Is the Smell of a Downtrend in the Air? 📉 Fartcoin: Is the Smell of a Downtrend in the Air? 💨
🚨 Alert: The RSI is holding its nose... and so should we.
After a suspiciously bubbly rally, $FARTCOIN is now showing bearish RSI divergence on the 4H chart — and let’s be honest, it’s starting to stink. 🦨
The recent price action looks like someone tried to pump it... but forgot to ventilate. 💣💨
🧻 Support is about to get wiped.
💩 MACD says momentum is going down the drain.
🚽 Volume drying up like gas after Taco Tuesday.
TA Summary:
RSI Divergence ✅
Rising wedge (aka clogged pipes) ✅
Community still in denial? ✅

ETH - LIQUIDATION OF A FRIENDif you like the idea, please "Like" it. This is the best "Thanks!" for the author 😊 P.S. Always do your own analysis before a trade. Put a stop loss. Fix profits in installments. Withdraw profits in fiat and please yourself and your friends.

#ZRO/USDT#ZRO
The price is moving within a descending channel on the 1-hour frame, adhering well to it, and is heading for a strong breakout and retest.
We are seeing a bounce from the lower boundary of the descending channel, which is support at 2.38.
We have a downtrend on the RSI indicator that is about to be broken and retested, supporting the upward trend.
We are looking for stability above the 100 moving average.
Entry price: 2.46
First target: 2.533
Second target: 2.636
Third target: 2.75

#DYM/USDT#DYM
The price is moving within a descending channel on the 1-hour frame, adhering well to it, and is on its way to breaking it strongly upwards and retesting it.
We are seeing a rebound from the lower boundary of the descending channel, which is support at 1.76.
We have a downtrend on the RSI indicator that is about to break and retest, supporting the upward trend.
We are looking for stability above the 100 moving average.
Entry price: 0.276
First target: 0.288
Second target: 0.303
Third target: 0.318

SOL looking good📊 SOL — Strong Support & Whale Activity Signal Potential Long Opportunity
🔎 Market Trend Overview
SOL, BTC, and ETH are all neutral, consolidating near their 21-day EMA after recent volatility.
Token Trend Current Price 21-day EMA Relationship
SOL Neutral $144.83 ~$143.50 Price near EMA
BTC Neutral $94,091 ~$93,500 Price near EMA
ETH Neutral $1,807 ~$1,800 Price near EMA
🐳 Notable SOL Whale Positions
Several large players have positioned both long and short — but the biggest exposure is clustered near current price levels:
Whale Position Size Entry PnL Notes
0x4a20 LONG (20x) $38.8M $144.90 +$9k Aggressive long
0xECB6 SHORT $6.6M $145.24 +$15k Part of portfolio
dydx1eq… LONG $5.8M $136.12 +$1.5k Moderate size
dydx1fn… SHORT $3.5M $250.82 +$475k Deep in profit
0x2c2f SHORT $1.9M $186.28 +$738k Very profitable
📍 Key SOL Liquidity Levels
Watch for these levels — heavy liquidation leverage suggests strong defense/support.
Level Liquidation USD Significance
$148.80 $45.7M Major resistance
$149.00 $45.6M Resistance cluster
$142.20 $43.8M Support level
$141.60 $41.5M Strong support
$141.40 $38.6M Support cluster
🚀 Trade Idea — Long SOL at Support
Entry: $141.50–$142.00
Stop: $138.50
Target: $148.50
R/R Ratio: 1:2.33
Safety Score: 8/10
Bias: Short-term bullish (3–5 days)
Rationale: Entering near a key support cluster where whales are positioned and liquidation leverage is high — signaling likely defense and bounce potential.

#DEGO/USDT#DEGO
The price is moving within a descending channel on the 1-hour frame, adhering well to it, and is heading for a strong breakout and retest.
We are experiencing a rebound from the lower boundary of the descending channel, which is support at 1.76.
We are experiencing a downtrend on the RSI indicator that is about to be broken and retested, supporting the upward trend.
We are looking for stability above the 100 Moving Average.
Entry price: 1.79
First target: 1.83
Second target: 1.92
Third target: 2.02
