jasmy usdt trade ideajasmy fans out there.
good entry level at the prices marked in white and blue. there is liquidty issue with fair value gaps.
also, for it to break previous high and go to massive targets. it will definately need to hit the demand levels where the major players will be waiting.
according to fibs and other technical aspects that not many people look for. i m combining all and marking 3 prices below.
notice how tp1 was marked at the long arrow where the small trade played out.
tp2 is a bigger target that can be hit nicely if it comes down first. and i do believe it will. set alerts at 0.019 for confirmation.
Crypto market

MASTERCARD PICKS XRP AS BRIDGE PAYMENT! ⚡ Hey hey, hope all is well, been a few days since our last post, we got a cool development and I figured I'd give a quick update and follow up with things on that note!
⚡ To start off, Mastercard has now taken on and recognized XRP as a bridge currency for international payments making sure to denote XRP's significance as a token which can process expedited and low cost international payments offering a low-cost solution for traditional international payment methods. One of these traditional payment methods notably is the Society for Worldwide Interbank Financial Telecommunication or as it's better known and referred to as: SWIFT.
⚡SWIFT itself is basically a messaging network that helps banks all around the world process international money transfers averaging about 50 million messages a day or close to roughly $5 trillion per day and even including the 250 business days per year, close to $150 trillion a year. So basically we've got Mastercard picking XRP's fast and cheap expeditated transactions and network as a replacement to SWIFT's traditional message system.
⚡ May not seem too significant but considering just how much XRP is doing, it's slowly taking a bite out of the SWIFT system more and more as more companies and business pick XRP as their form of doing digital transactions replacing a system which has long been overdue for a change citing significant intermediary and middleman cost with traditional international payments as oppose to the sleek and efficient system that Ripple has created and is working towards on a daily basis.
🔥 So yeah, this is a great development for us, it's another step in the right direction and another step towards the Future and change that the company Ripple is seeking to bring about no doubt. Below I'll add a reference link to the Mastercard document which mentions XRP as a bridge currency as well as an article that speaks more on the subject for anyone who would like to check that out.
x.com
www.livebitcoinnews.com
🔥 I've you've made it this far, I appreciate it, we'll take a quick look at our TA and wrap things up.
🔥 In our last idea we noted the main thing was just to watch that ascending channel and see if we could keep within it and we indeed have, we did have a 200 EMA crossover on the 3 hour but bulls managed to pull back up and into the channel so we're definitely in some wavy waters here. We're really testing that channel support as bears try to break it but bulls keep firm. Main thing right now is to watch if we can keep within the channel and potentially make another leg up to $2.4 and break $2.3 which is proving to be a strong horizontal resistance level.
🔥 So basically watch the ascending channel and the horizontal channel, if we do fall out of the ascending channel, next up will be the horizontal channel for a test of support so keep noted with that. Technical aside though we still do have the chance of the SEC approving an XRP Spot ETF soon which if done soon, would more than likely have us seeing a significant breakout and shift in sentiment on behalf of retail and institutional investors so definitely keep your eyes peeled.
🔥 I've got to run but I appreciate the time and and support as always, you already know I'm more than happy to keep you guys updated with me as we continue on with this long but well worth journey. Thanks so much as always and till next, keep posted and have a great day!
Best regards,
~Rock'

Alt season is here ! I have done an analysis on ETHBTC vs BTCUSD which has consistently predicted the phases when altcoins do well. This is only when there's liquidity in the system and thus, even the broader stock market does very well.

Bitcoin long: Expects Wave 5 Extension, Target $112,608I provide an update to the Bitcoin Elliott Wave primary wave counts. Here's a few things to note:
1. Primary Wave 3 = Primary Wave 1. Wave 3 is actually slightly longer than wave 1 but for the purpose of ascertaining whether it extends, we take the position that it did not.
2. Expects Primary Wave 5 extension of at least 1.618x of Primary Wave 1, giving us a target of $112,608.
3. Stop below Primary Wave 4, around $92,750.

$BTC is on track for a 100% Move Up: Looking at the Weekly!Let's keep it SIMPLE!!!!!
Bitcoin ( CRYPTOCAP:BTC ) has been on an absolute tear lately. After finding a solid base around $74,000, we’ve now broken out and are trading around $96,000—a move that’s caught the attention of everyone from retail traders to institutions.
But could we be on the road to $150,000 BTC?
Let’s break it down simply using the weekly chart, a couple key resistance levels, and the Relative Strength Index (RSI)—a key momentum indicator that often reveals where the smart money is going.
📈 The Weekly Momentum Is Strong
The weekly RSI is currently trending upward and approaching the 70 zone, which is often considered the “overbought” area. But here’s the key: In a strong bull market, RSI staying above 70 is not a warning sign—it's a sign of strength.
We saw this behavior during the 2017 and 2021 bull runs. RSI hovered in overbought territory for weeks, even months, as Bitcoin pushed higher and higher. We're starting to see that same pattern now. The momentum is building, and buyers are in control.
🔓 Key Resistance Levels Being Broken
When Bitcoin was at $74K, we had a few major resistance zones ahead:
$80K – psychological barrier and minor rejection point
FWB:88K –$90K – prior consolidation area and liquidity zone
$100K – major psychological milestone that will bring massive attention
So far, Bitcoin has smashed through $80K and is holding above $90K, showing buyers are stepping in on every dip. Once we confidently break and hold above $100K, the road toward $120K and $150K opens up fast.
💡 Why $150K Is in Sight
This isn’t just about technicals—there’s also a strong macro and sentiment shift at play:
Institutional interest is increasing
ETF flows remain positive
Supply on exchanges is dropping
Halving narrative is still fueling demand
Momentum indicators are still not overheated
Technically, when price breaks into price discovery, it tends to overshoot to the upside—especially if momentum like RSI stays strong.
🧠 Final Thoughts
Bitcoin has already climbed from $74K to $96K, and the weekly chart suggests this could just be the beginning of the next leg up. If RSI continues climbing and price breaks above $100K cleanly, the $120K to $150K zone becomes a realistic next stop.
Stay patient, zoom out, and follow the trend. The momentum is real—and so is the opportunity.

BTCUSDT 4H – Correction Before Breakout | Targeting $98KI'm seeing a potential bullish continuation pattern forming on the BTC/USDT 4H chart. After a strong upward trend, price is currently in a consolidation zone with a likely correction toward the $95,600–$96,000 area, which aligns with both pivot support and the rising trendline.
Key points from my analysis:
Support zone: $95,600–$96,000 (confluence of pivot point and ascending trendline)
Resistance targets:
R1: $97,272
R2: $98,050
R3: $99,308
Momentum: Stochastic RSI near overbought → suggests short-term pullback, then potential continuation.
Volume: No major distribution, bullish momentum remains intact.
📈 I expect a minor dip followed by continuation to R2 or R3, provided the $95,600 support holds.
Stop-loss idea: Below $94,756 (S1)
Take-profit zones: Partial at GETTEX:98K , rest near $99.3K
------------ManOf87_Pro Indicator--------------------
A powerful trading tool combining ATR-based trend detection, Fibonacci pivots, Fair Value Gaps (FVG), engulfing patterns, and multi-factor confirmations (MA, RSI, Bollinger Bands, volume, Z-Score, ROC).
*Buy Signal: Triggers when the trend shifts bullish (price exceeds ATR-based short stop), with strong buy signals requiring additional trend, momentum, and volume confirmation.
*Sell Signal: Triggers when the trend turns bearish (price falls below ATR-based long stop), with strong sell signals needing similar confirmations.
-Ideal for trend-following and breakout strategies, customizable for various markets and timeframes.

Perfect setup is nuts Easy money here just a matter of when likely soon, text book cup and handle. Depth of cup takes exactly to resistance where im sure it will wick up. $PNUT is the lowest market cap crypto on hood at 183 million pretty low volume for now, just accumulation.

Ready to the moon Well, as you can see, the daily resistance has formed a box and if this area is broken, the range from the top to the next daily resistance, which is about two points, will be 8 targets. This is not an investment recommendation or a buy or sell signal. Check it out for yourself and follow capital and risk management.

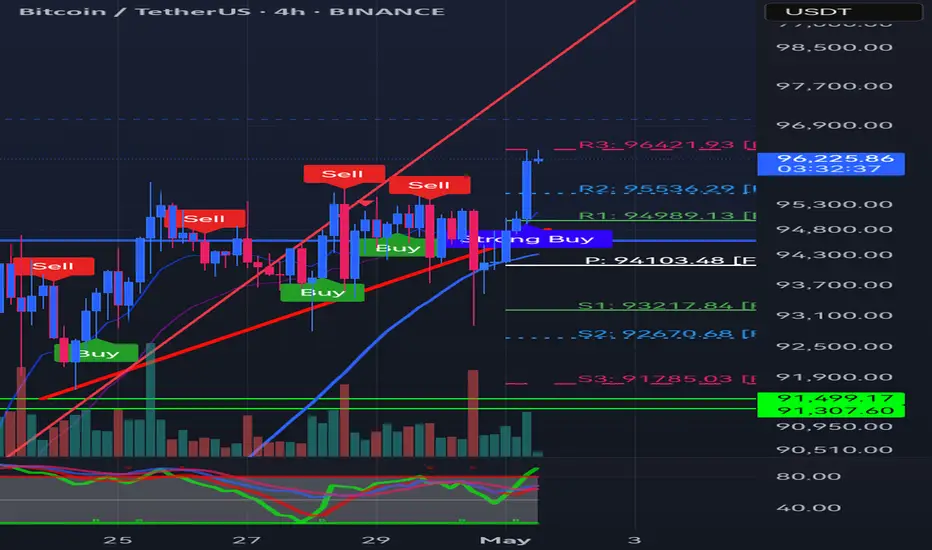
BTCUSD 4H – Strong Buy Signal After Pivot Bounce | Targeting 96KBitcoin (BTC) is showing a strong bullish setup on the 4H chart, following a clean bounce from the pivot level around $94,103. This bounce was accompanied by a strong buy signal, increased volume, and an upward trend in RSI, confirming buyer momentum.
Key levels I'm watching:
Support: $94,100 (Pivot), $93,217
Resistance Targets: $94,989 (R1), $95,536 (R2), and $96,421 (R3)
The price action suggests a breakout toward R2 and possibly R3 in the coming sessions. A sustained close above R1 would confirm this move.
Strategy:
Ideal for a short-term swing trade setup — entry near $94,800, take profits near R2 & R3, and a stop-loss just below $93,200 for safety.
Indicators used:
Trendlines
Pivot Points
RSI (bullish crossover)
Volume Confirmation
Buy/Strong Buy Labels
SHIBUSD – Long Setup with 3.6R and Momentum ShiftSHIB just broke out of consolidation with bullish MACD momentum and support from the Ichimoku cloud. I’m long with a 3.6 risk/reward, targeting a move back toward 0.00002129 and above. Entry at 0.00001327, stop at 0.00001032, targeting 0.00002406. RSI is recovering from oversold, and the chart structure shows higher lows—early signs of trend reversal.
Follow for updates as this unfolds—SHIB could be waking up.

MKR/USDT 4h chart ReviewHello everyone, let's look at the 4H MKR chart to USDT, in this situation we can see how the price moves on the created upward trend line. Going further, let's check the places of potential target for the price:
T1 = $ 1576
T2 = 1657 $
Т3 = 1714 $
Let's go to Stop-Loss now in case of further declines on the market:
SL1 = $ 1529
SL2 = $ 1499
SL3 = $ 1450
SL4 = 1372 $
Looking at the RSI indicator, we see
How slight relaxations give space for further increases by living in the upward trend of price.

ADAUSDT Analysis – 3D ChartCardano is currently trading within a falling wedge pattern on the 3-day timeframe, a structure typically considered bullish. Price is hovering above a key support zone around the $0.60–$0.68 range, showing signs of accumulation.
Bullish divergence is visible on the RSI, indicating potential momentum shift. A confirmed breakout above the wedge resistance could trigger a strong rally, targeting the following levels:
• First target: $0.8388
• Second target: $1.0049
• Final target: $1.1853
If ADA fails to hold the support zone, downside risk remains toward the deeper support near $0.40. However, as long as price remains inside the wedge, the setup favors the bulls.

$KEIROUSDT WE CAN BUY THIS from coinex I wish x1000 in chart
We can
We can
Keiro is $DOGECOIN
$BONHUSDT MEXC:SHIBAUSDT BINANCE:SUIUSDT
IN FUTURE JUST STAY UP 😅😅😅

btc fibonacci levels btc did not hold 97218 level and have fallen down to 9661 level and needs to hold this level as my next level is back down to 96000 look for a bounce if holds or we will continue to down trend

ROSEUSDT Key Inflection Zone Amidst WXY Corrective StructureROSEUSDT is currently exhibiting a broad bearish corrective structure, taking the form of a potential WXY complex correction. Price action has been coiling within a structurally significant range, with the immediate demand zone acting as the current base of accumulation. This area presents a favorable risk-reward opportunity for strategic long positions.
The broader outlook hinges on the behavior of price upon retesting the overhanging supply zone. A rejection at this critical resistance could trigger a sharp bearish continuation, with downside targets aligned with the projected bear zone, as depicted on the chart.
Conversely, a confirmed breakout above this structural ceiling would invalidate the bearish thesis and pave the way for an impulsive bullish leg toward the upper bull target area, establishing a potential trend reversal.

BTCUSD... 1H CHAT PATTERN Here’s a breakdown of the BTCUSD trading idea you’ve presented:
---
### 🟢 **Trade Setup (Long Position)**
* **Entry Price:** 9692
* **Stop Loss:** 9550
* **Targets:**
* **1st Target:** 9800
* **2nd Target:** 9900
* **Final Target:** 10000
---
### 📊 **Trade Metrics**
* **Risk (Stop Loss Distance):** 9692 - 9550 = **142 points**
* **Reward:**
* **To 1st Target:** 9800 - 9692 = **108 points** (R\:R ≈ 0.76)
* **To 2nd Target:** 9900 - 9692 = **208 points** (R\:R ≈ 1.46)
* **To Final Target:** 10000 - 9692 = **308 points** (R\:R ≈ 2.17)
---
### ✅ **Key Considerations**
* The reward-to-risk ratio improves at each target level.
* Make sure price action or indicators support this long bias at 9692.
* Adjust position sizing based on your risk tolerance (typically risking 1–2% of capital).

Top of ABC correction on Bitcoin ~ ShortBitcoin has had quite the run up since 2023 and is currently in an ABC corrective pattern after a 5 wave impulse. The January high was the starting point. The April low was A. Now is the top of B which happens to be 0.618 retracement of the A wave. What follows is a down move for C which should end somewhere between 63k and 53.5k. This will make a bottom and will stay in accumulation until late 2027 early 2028 before shooting to the upside in anticipation of the next halving.

Ethereum's $2k Crossroads: Squeeze Up or Crash Down?Ethereum at a Crossroads: Eyeing $2,000 Amidst Short Squeeze Hopes, Crash Warnings, and Existential Questions
Ethereum (ETH), the bedrock of decentralized finance (DeFi) and the engine behind countless non-fungible tokens (NFTs), finds itself ensnared in a complex web of conflicting market signals and divergent analyst opinions. On one hand, recent price action shows resilience, with ETH powering through previous resistance levels and setting its sights on the psychologically significant $2,000 mark. This move is potentially bolstered by intriguing on-chain data, such as declining supply on major exchanges like Binance, sparking whispers of an impending short squeeze. Yet, casting a long shadow over this optimism are stark warnings: technical analysts point to rare, potentially bearish patterns forming, prominent trading firms question its fundamental value proposition compared to Bitcoin (BTC), highlighting its staggering year-to-date losses, and some even provocatively label it more akin to a "memecoin."
This cacophony of bullish hopes and bearish alerts places Ethereum at a critical juncture. Is the recent surge the beginning of a sustained recovery, fueled by tightening supply and renewed developer activity? Or is it merely a deceptive bounce within a larger downtrend, vulnerable to a potential crash as underlying weaknesses and unfavorable comparisons to Bitcoin take hold? Dissecting these opposing narratives is crucial for understanding the intense battleground Ethereum's price chart has become.
The Bullish Ascent: Powering Through Resistance, Eyeing $2,000
The immediate catalyst for renewed optimism stems from Ethereum's recent price performance. After a period of consolidation and, at times, significant downward pressure, ETH has demonstrated notable strength. Headlines proclaiming "Ethereum Price Powers Through Resistance — Eyes on $2,000?" capture this sentiment. Breaking through previously established resistance levels (potentially building on support found around the $1,800 mark) is a technically significant event. It suggests buyers are stepping in with enough conviction to overcome selling pressure that had previously capped advances.
Successfully reclaiming and holding levels above former resistance transforms these zones into potential new support floors, providing a base for further upward movement. The $2,000 level looms large, not just as a round number, but often as a key area of historical price interaction – a zone where significant buying or selling interest has previously materialized. A decisive break above $2,000 could inject further confidence into the market, potentially attracting momentum traders and reinforcing the bullish narrative.
The Binance Supply Drop and Short Squeeze Speculation
Adding intrigue to the bullish case is the observation of declining Ether supply on major exchanges, specifically Binance. Exchange supply is a closely watched metric. When the amount of ETH held on exchanges decreases, it generally implies that investors are withdrawing their coins to private wallets, often for longer-term holding ("HODLing") or for use within the DeFi ecosystem (staking, lending, etc.). This reduction in readily available supply on exchanges can, in theory, create a tighter market.
This dynamic fuels speculation about a potential "short squeeze." A short squeeze occurs when the price of an asset starts to rise rapidly, forcing traders who had bet against it (short sellers) to buy back the asset to close their positions and cut their losses. This forced buying adds further upward pressure on the price, creating a rapid, cascading effect. If a significant number of traders have shorted ETH, anticipating further price declines, a sustained move upwards coupled with shrinking exchange supply could create the conditions for such a squeeze, dramatically accelerating the price towards and potentially beyond the $2,000 target. While short squeezes are relatively rare and difficult to predict accurately, the declining supply on a major platform like Binance certainly adds a compelling element to the bullish thesis.
Underlying Strengths: The Long-Term Vision
Beyond short-term price action and supply dynamics, Ethereum's bulls point to its fundamental strengths. The successful transition to Proof-of-Stake (PoS) via "The Merge" was a monumental technical achievement, drastically reducing the network's energy consumption and changing its tokenomics by potentially making ETH a deflationary asset under certain conditions (where more ETH is "burned" via transaction fees than is issued as staking rewards). Ongoing scalability upgrades, often referred to under the umbrella of Ethereum 2.0 developments (like proto-danksharding via EIP-4844), aim to reduce transaction fees and increase throughput, making the network more efficient and attractive for developers and users.
Ethereum remains the dominant platform for smart contracts, DeFi applications, and NFT marketplaces. Its vast developer community, established network effects, and continuous innovation pipeline are often cited as core long-term value drivers that short-term price volatility cannot erase. For believers in Ethereum's vision, the current price levels, even after the recent bounce, might represent an opportunity to accumulate an asset with significant future potential.
The Bearish Counter-Narrative: Red Alerts and Worrying Comparisons
However, the optimism is heavily tempered by significant bearish signals and critiques. This serves as a stark warning. Technical analysis involves studying chart patterns and indicators to forecast future price movements. While the specific "rare pattern" isn't detailed, the emergence of such signals often causes significant concern among traders. Patterns like head-and-shoulders tops, descending triangles, or bearish divergences on key indicators can suggest that upward momentum is waning and a significant price decline could be imminent. Such technical warnings cannot be easily dismissed, especially when they align with other concerning factors.
The Stark Reality: Underperformance and the "Memecoin" Jab
Perhaps the most damaging critique comes from the direct comparison with Bitcoin and the assessment of Ethereum's recent performance. A large year-to-date drop is a brutal statistic, especially when Bitcoin, while also volatile, may have fared comparatively better during the same period (depending on the exact timeframe and BTC's own fluctuations).
Why the "memecoin" comparison? Memecoins are typically characterized by extreme volatility, price movements driven largely by social media hype and sentiment rather than clear fundamental value, and a lack of a distinct, widely accepted use case beyond speculation. While some calling Ethereum a memecoin is hyperbolic – given its vast ecosystem and utility – the critique likely stems from its recent high volatility and its struggle to maintain value relative to Bitcoin. The trading firm's assertion that Ether's "risk-reward is now unjustifiable compared to Bitcoin" encapsulates this view. They likely argue that Bitcoin's clearer narrative as a potential store of value or "digital gold," potentially bolstered by institutional adoption via ETFs, offers a more compelling investment case with potentially less downside risk compared to Ethereum, which faces ongoing scalability challenges, competition from other Layer 1 blockchains, and perhaps greater regulatory uncertainty regarding its status (security vs. commodity).
This underperformance raises difficult questions. If Ethereum is the backbone of Web3, why has its price struggled so much relative to its peers or even its own potential? Possible contributing factors include:
1. Capital Rotation: The excitement and capital inflows surrounding spot Bitcoin ETFs may have drawn investment away from Ethereum and other altcoins.
2. Regulatory Uncertainty: Ongoing debates, particularly in the US, about whether ETH should be classified as a security could be creating hesitancy among institutional investors.
3. Competition: Numerous alternative Layer 1 blockchains (Solana, Avalanche, etc.) are competing fiercely for developers and users, potentially fragmenting the market share Ethereum once dominated.
4. Post-Merge Narrative Shift: While technically successful, the immediate post-Merge price action was underwhelming for many, and the narrative focus may have shifted elsewhere.
Synthesizing the Dichotomy: A Market Divided
Ethereum's current situation is a textbook example of a market grappling with deeply conflicting data points and narratives.
• Bullish Signals: Price breaking resistance, targeting $2k, falling exchange supply, potential short squeeze, ongoing network development, strong ecosystem.
• Bearish Signals: Severe YTD underperformance, concerning technical patterns ("red alert"), critical comparisons to Bitcoin's risk/reward, being labeled "memecoin-like" by traders, regulatory overhang, Layer 1 competition.
This dichotomy creates significant uncertainty. Is the falling supply on Binance a sign of HODLer conviction paving the way for a short squeeze, or simply users moving assets to DeFi protocols, with little bearing on immediate price direction? Is the push towards $2,000 the start of a real trend reversal, or a bull trap set by bearish technical patterns? Is Ethereum's fundamental value being overlooked amidst short-term noise, or are the critiques about its risk/reward profile relative to Bitcoin valid warnings?
Investor Sentiment and Key Factors to Watch
This environment fosters polarized investor sentiment. Optimists see a buying opportunity, focusing on the recent strength and long-term potential. Pessimists see confirmation of underlying weakness and prepare for further declines. The path forward will likely be determined by several key factors:
1. Bitcoin's Trajectory: As the market leader, Bitcoin's price action heavily influences the broader crypto market, including Ethereum. Continued strength in BTC could provide a tailwind for ETH.
2. Technical Levels: Whether ETH can decisively breach and hold $2,000, or if it gets rejected, will be a critical short-term indicator. Equally important is whether current support levels hold during any pullbacks.
3. Exchange Flows & On-Chain Data: Continued monitoring of exchange supply, staking activity, and transaction volumes will provide clues about investor behavior.
4. Regulatory Developments: Any clarification on Ethereum's regulatory status, particularly in the US, could significantly impact sentiment.
5. Macroeconomic Environment: Broader market risk appetite, influenced by inflation, interest rates, and economic growth prospects, will continue to play a role.
Conclusion: Navigating Ethereum's Uncertain Path
Ethereum stands at a precarious crossroads. The recent climb towards $2,000, supported by encouraging signs like falling exchange supply, offers a glimmer of hope for bulls anticipating a recovery and perhaps even a short squeeze. However, this optimism is aggressively challenged by alarming technical warnings, significant underperformance compared to market expectations and Bitcoin, and pointed critiques questioning its current investment viability.
The "memecoin" comparison, while harsh, reflects a genuine frustration and concern among some market observers about ETH's volatility and perceived lack of decisive direction relative to the "digital gold" narrative solidifying around Bitcoin. The formation of rare bearish patterns adds a layer of technical urgency to these concerns.
Ultimately, the market remains deeply divided on Ethereum's immediate future. The battle between the potential for a supply-driven squeeze towards $2,000 and the risk of a pattern-induced crash is palpable. Investors must weigh the platform's undeniable long-term technological significance and ecosystem strength against the immediate headwinds of poor recent performance, regulatory ambiguity, and concerning technical signals. The coming weeks are likely to be crucial in determining whether Ethereum can overcome the prevailing skepticism and validate the recent bullish momentum, or if the bears will regain control, confirming the warnings of a continued downturn. The price action around the $2,000 level will be a key battleground in this ongoing struggle.
Disclaimer: The information presented in this article is for informational and educational purposes only. It is based on the analysis of the provided headlines and general market knowledge. It does not constitute financial advice. Investing in cryptocurrencies involves significant risk, including the potential loss of principal. Readers should conduct their own thorough research and consult with a qualified financial advisor before making any investment decisions.

BTC -- Bullish possible trade setup at breakoutBTC -- Bullish possible trade setup at breakout.... based on trend analysis, chart pattern, price and volumen analysis.

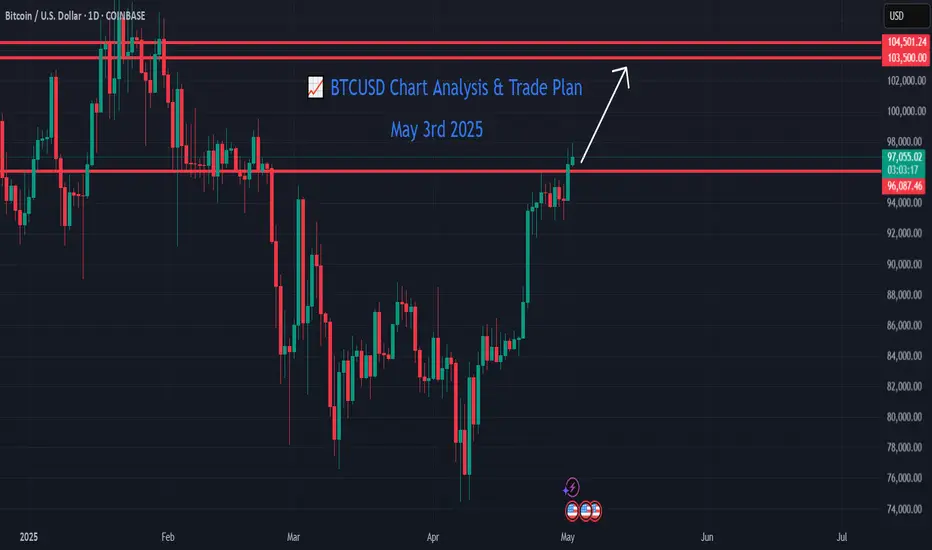
BTCUSD Chart Analysis & Trade Plan ( May 3rd 2025 )📈 BTCUSD Chart Analysis & Trade Plan
Instrument: BTCUSD
Trade Setup: Long
Entry Price: $96,900
Take Profit (TP): $103,500
Stop Loss (SL): $93,830
Risk-Reward Ratio (RRR): 2.15
Timeframe Observed: 4H / Daily
Time Horizon: 2–4 days
Strategy Type: Trend Continuation
🔍 Technical Overview
Trend: BTCUSD is exhibiting a bullish continuation pattern, forming higher lows and higher highs on both 4H and Daily charts.
Support Levels:
Primary: $96,500–$96,900 (current entry zone, previous breakout retest zone)
Secondary: $94,800 (key horizontal + Fibonacci retracement support)
Resistance Levels:
Short-term: $100,800
Medium-term: $103,500 (aligned with Gann and Elliott targets)
🌀 Elliott Wave Analysis
Primary Wave Count (4H chart):
BTCUSD appears to be in Wave 3 of (3) of a bullish impulse cycle.
Wave (2) retracement completed near $96,000 with a sharp ABC correction.
Wave (3) projection gives a Fibonacci extension target:
100% of Wave 1 = ~$103,500 — aligning with our TP zone.
Subwaves inside Wave 3:
Wave i and ii completed.
Currently progressing through Wave iii — often the strongest, highest momentum wave.
Implication: If Wave iii holds, BTCUSD could accelerate toward $103,500 within the next 48–72 hours.
📐 W.D. Gann Analysis
Gann Fan (drawn from $60,000 low):
Price has reclaimed the 1x1 line (balance of time and price) around $96,000.
Next resistance lies near the 1x2 Gann angle at ~$103,300–$103,500.
Gann Square of 9 levels:
$96,800 is a key Gann pivot price.
The next natural harmonic level on the Square of 9 lies at $103,500, affirming this zone as a major Gann target.
Implication: Gann time/price analysis supports a rally to $103,500 before the next cycle pause.
📝 Trade Plan Summary
Parameter Value
Entry $96,900
Take Profit $103,500
Stop Loss $93,830
RRR 2.15
Timeframe 2–4 Days
Justification:
Entry aligns with Elliott Wave corrective low (Wave 2).
Gann angle breakout confirms time/price balance in favor of bulls.
Confluence of Fibonacci projections, harmonic levels, and structural support.
⚠️ Risk Notes
If BTCUSD fails to hold above the $96,500–$96,000 zone, reevaluation is needed.
Global macro factors and ETF flows should be monitored, as they could cause volatility.
$100k Bitcoin IMMINENT? Price Ignites After Major Surge!The cryptocurrency market is once again crackling with energy, and at the heart of the storm stands Bitcoin (BTC). The world's largest and original cryptocurrency is staging a remarkable comeback, shattering recent resistance levels and reigniting fervent speculation about its potential to not only revisit but decisively conquer the psychologically potent $100,000 milestone. Following a period of consolidation and downward pressure, a powerful surge has propelled Bitcoin to its highest price point in over ten weeks, signaling a potential paradigm shift in market sentiment and trading behavior.
The Breakout: Shaking Off Recent Slumber
The recent price action has been decisive. Bitcoin climbed as much as 3.1% to achieve a weekly high of $97,483. This marks the most robust price level observed since February 21st, representing a significant break from the sideways and sometimes downward trajectory that characterized parts of the preceding weeks. The memory of Bitcoin crossing the $100,000 threshold on February 7th is still fresh, adding weight to the current push towards that level.
This upward momentum provides a stark contrast to the market conditions seen earlier. There is downward pressure attributed to geopolitical factors and economic policies, such as potential tariff implementations, which had previously triggered sell-offs impacting both traditional stock markets and the digital asset space. Furthermore, the market had to digest a significant correction following Bitcoin's earlier peak. While the specifics of past peaks can be debated based on different exchange data, the narrative of a significant pullback followed by the current strong recovery is clear. Bitcoin weathered a period where it seemed momentum might stall, but the bulls have evidently returned with renewed vigor.
Shifting Market Dynamics: From Macro-Driven to Momentum-Fueled
Perhaps one of the most crucial insights from the current rally is the apparent shift in what's driving price action. For much of the past year or two, Bitcoin's price movements often seemed heavily correlated with macroeconomic factors – inflation data releases, central bank interest rate decisions, geopolitical tensions, and regulatory pronouncements. While these factors undoubtedly still play a role, the current surge suggests a transition towards a market more heavily influenced by internal dynamics: spot market demand and trading momentum.
There are traders who are increasingly reacting to price action itself, buying into strength and potentially creating a self-reinforcing cycle. The focus is less on predicting the next Federal Reserve move and more on the immediate supply and demand dynamics visible on exchanges.
Bitcoin isn't entirely decoupled from macro trends, but its internal market structure, particularly the influence of new financial instruments like ETFs and strong spot buying, is asserting greater influence on short-to-medium term price discovery.
The ETF Factor: Opening the Floodgates for Capital
The launch and subsequent success of spot Bitcoin ETFs in the United States have been a game-changer, and their impact is arguably a primary catalyst for the current bullishness. These regulated investment vehicles provide traditional investors and institutions with a familiar and accessible way to gain exposure to Bitcoin without directly holding the underlying asset. The result has been a torrent of new capital flowing into the market.
There has been a staggering inflow of over $3.2 billion entering Bitcoin and Ethereum tracking ETFs in the preceding week alone. BlackRock's Bitcoin Trust ETF (IBIT), a major player in the space, recorded nearly $1.5 billion in inflows during that period, marking its highest weekly intake for the year according to Bloomberg data.
These inflows are not just numbers on a spreadsheet; they translate directly into buying pressure in the spot market. ETF issuers must purchase actual Bitcoin to back the shares they issue to investors. This sustained, large-scale buying provides a powerful tailwind for the price, absorbing sell orders and driving the market upwards. The success of these ETFs also lends legitimacy to Bitcoin as an asset class, potentially encouraging further adoption and investment from previously hesitant institutional players. The "demand" aspect of the current rally is heavily underpinned by this ongoing ETF phenomenon.
Options Market Signals: Betting Big on $100,000
Further evidence of the bullish sentiment surrounding Bitcoin, particularly the $100,000 target, comes from the derivatives market, specifically options trading. Options contracts give traders the right, but not the obligation, to buy (call option) or sell (put option) an asset at a specific price (strike price) before a certain expiration date.
According to data from Coinglass and the major crypto options exchange Deribit, demand for upside options has surged. Notably, call options with a $100,000 strike price exhibit the most significant open interest across various expiration dates. Open interest represents the total number of outstanding contracts that have not yet been settled. High open interest in $100k call options indicates that a large number of traders are positioning themselves to profit from Bitcoin reaching or exceeding this level. While options data reflects expectations rather than guarantees, such concentrated betting on a specific upside target underscores the powerful psychological pull of the $100k mark and the conviction held by a significant segment of the market.
Warming Up: Reading the Technical and On-Chain Pre-Rally Signals
Beyond the ETF flows and options market sentiment, analysts are pointing to various technical and on-chain indicators suggesting Bitcoin is indeed "warming up" for a potentially larger move, exhibiting signals seen before previous major breakouts. This aligns with the theme of "Bitcoin Flashing Pre-Rally Signals Seen Before Major 2024 Breakouts."
• Technical Analysis:
o Breaking Resistance: The surge above the 10-week high ($97,483) was a critical technical breakout, overcoming a level that had previously capped price advances. Holding above this level turns former resistance into potential support.
o Moving Averages: Traders watch moving averages closely. A "Golden Cross" (where a shorter-term moving average, like the 50-day, crosses above a longer-term one, like the 200-day) is often considered a strong long-term bullish signal. While specific configurations vary, bullish alignment of key moving averages often precedes sustained rallies.
o Momentum Indicators: Indicators like the Relative Strength Index (RSI) and Moving Average Convergence Divergence (MACD) can signal building momentum. An RSI breaking above key levels without yet reaching extremely overbought territory, or a bullish MACD crossover, can suggest further upside potential.
o Volume Confirmation: Crucially, significant price breakouts should ideally be accompanied by strong trading volume, indicating conviction behind the move. Analysts look for volume confirmation to validate the strength of the rally.
• On-Chain Analysis: On-chain data provides insights into the behavior of Bitcoin holders and network activity.
o Exchange Outflows: Sustained periods where more Bitcoin is withdrawn from exchanges than deposited often suggest investors are moving coins to private wallets for long-term holding ("HODLing"), reducing the immediately available supply for sale.
o Accumulation Trends: Metrics tracking the behavior of large holders ("whales") and long-term holders can reveal accumulation patterns. Increased buying from these cohorts is typically seen as bullish.
o Supply Dynamics: Indicators looking at the supply held by short-term versus long-term holders, or metrics like the Long-Term Holder Spent Output Profit Ratio (LTH-SOPR), can gauge whether significant profit-taking is occurring that could stall a rally. A low LTH-SOPR might suggest long-term holders are not yet selling aggressively.
o Funding Rates: In the perpetual futures market, positive funding rates generally indicate that traders holding long positions are paying those holding short positions, suggesting a bullish bias in the derivatives space.
When multiple technical and on-chain indicators align, as some analysts suggest is happening now, it builds a stronger case that the market is preparing for a significant move, lending credence to the "pre-rally signals" narrative.
Mapping the Path to $100k and Beyond: Three Potential Scenarios
While the current momentum is palpable, the path forward is never certain. Analysts are mapping various possibilities, acknowledging both the bullish potential and the inherent risks. Here are three broad scenarios that could unfold:
1. The Momentum Continuation Scenario: Fueled by continued strong ETF inflows, positive market sentiment amplified by the $100k narrative, and potentially favorable (or at least neutral) macroeconomic developments, Bitcoin continues its ascent relatively unimpeded. It decisively breaks the $100,000 barrier, potentially triggering a wave of Fear Of Missing Out (FOMO) from retail investors and further institutional interest. In this scenario, the market quickly looks towards higher targets, exploring price discovery in uncharted territory above $100k (or above its previous ATH depending on the data source used). Key challenges would be maintaining buying pressure and overcoming psychological resistance levels beyond $100k.
2. The Consolidation and Recharge Scenario: Bitcoin's rally meets significant resistance near or just below the $100,000 level. Profit-taking increases, and early ETF buyers might look to secure gains. Instead of a sharp rejection, the price enters a period of consolidation – trading sideways within a defined range or experiencing a moderate pullback. This phase allows the market to digest recent gains, build a stronger base of support (potentially around the recent breakout level near GETTEX:97K or slightly lower), and allows moving averages to catch up. If support holds and buying demand re-emerges (perhaps triggered by fresh ETF inflows or positive news), this consolidation could form the launchpad for the next sustained leg up towards and beyond $100k. This scenario tests the resilience of the buyers.
3. The Macro Headwind or Correction Scenario: Despite the strong internal dynamics, external factors reassert control. An unexpected negative catalyst emerges – perhaps significantly worse-than-expected inflation data forcing a hawkish central bank response, a major geopolitical escalation, unforeseen regulatory action against crypto, or a sharp downturn in traditional markets triggering widespread risk-off sentiment. Alternatively, the rally could simply run out of steam, hitting a "sell wall" at $100k that overwhelms buying pressure, leading to a sharper correction back towards lower support levels ($90k, $85k, or even lower). This scenario underscores the ever-present volatility and risk in the crypto market, reminding investors that parabolic runs can face abrupt reversals.
The Crucial Question: Can BTC Buying Demand Meet the Challenge?
Ultimately, whether Bitcoin successfully retests and surpasses $100,000 hinges on the sustainability of the current buying demand. Several factors support continued demand:
• Ongoing ETF Flows: As long as institutions and retail investors continue allocating capital to spot Bitcoin ETFs, this provides a consistent source of buying pressure.
• Growing Adoption Narrative: Each price surge and new institutional product launch reinforces the narrative of Bitcoin's growing acceptance and potential role as a store of value or portfolio diversifier.
• Halving Effect (Long-Term): While the Bitcoin Halving (reduction in new supply issuance) is a past event, its long-term supply-constricting effects are believed by many to contribute to price appreciation over time.
• Potential Retail FOMO: A decisive break above $100k could capture mainstream media attention and trigger a wave of buying from retail investors fearing they might miss out on further gains.
However, potential headwinds exist:
• Profit-Taking: Investors who bought at lower levels, including early ETF participants, may look to lock in substantial profits as the price approaches major milestones.
• Regulatory Uncertainty: While ETFs marked progress, the broader regulatory landscape for crypto remains complex and subject to change globally.
• Macroeconomic Risks: Inflation, interest rates, and potential recessionary fears haven't disappeared and could resurface to dampen risk appetite.
• Market Saturation/Exhaustion: Rallies can lose momentum if buying power becomes exhausted without fresh catalysts.
The interplay between these forces will determine if the current buying wave has the strength and endurance to overcome sell pressure and propel Bitcoin into six-figure territory sustainably.
Conclusion: A Critical Juncture for Bitcoin
Bitcoin stands at a fascinating and potentially pivotal juncture. The recent surge, breaking a 10-week high and pushing towards the $100,000 horizon, is fueled by a powerful combination of factors unlike those seen in previous cycles. The institutional validation and massive capital inflows brought by spot Bitcoin ETFs represent a fundamental shift, seemingly driving a transition towards momentum and spot-demand-based trading. Bullish signals from the options market and various technical/on-chain indicators add fuel to the fire, painting a picture of a market "warming up" for potentially significant further gains.
Yet, the path to $100,000 and beyond is fraught with challenges. Market history teaches that parabolic advances often face corrections, and the ever-present risks of macroeconomic shifts and regulatory developments cannot be ignored. The sustainability of the current buying frenzy, particularly the crucial ETF inflows, will be rigorously tested as Bitcoin confronts the immense psychological and technical resistance clustered around the six-figure mark.
Whether Bitcoin achieves a swift breakout, undergoes a period of consolidation, or faces a pullback remains to be seen. However, the current price action and underlying market dynamics have undeniably reignited excitement and placed the $100,000 target firmly back in the spotlight, marking a critical chapter in Bitcoin's ongoing evolution within the global financial ecosystem. Investors and observers alike will be watching intently to see if the current surge has the power to meet the demand challenge and etch a new all-time high into the history books.
Disclaimer: The information presented in this article is for informational and educational purposes only. It is based on the analysis of the provided source material and general market knowledge. It does not constitute financial advice. Investing in cryptocurrencies involves significant risk, including the potential loss of principal. Readers should conduct their own thorough research and consult with a qualified financial advisor before making any investment decisions.

BTC back to ATH “The continuation of this bullish momentum should keep going. We might have a small retracement soon, but if we do not break structure. Then I see no reason to exit the trade before hitting ATH .

