Ripple potential UpsidesHey Traders, in today's trading session we are monitoring XRPUSDT for a buying opportunity around 2.13 zone, XRPUSDT is trading in an uptrend and currently is in a correction phase in which it is approaching the trend at 2.13 support and resistance area.
Trade safe, Joe.
Crypto market

BITCOINBitcoin (BTC) and US Dollar (DXY) Differential: Correlation and Trends
Key Relationship: Inverse Correlation
Bitcoin has historically exhibited an inverse correlation with the US Dollar Index (DXY), a measure of the dollar’s strength against a basket of major currencies. This relationship stems from Bitcoin’s role as a speculative, risk-sensitive asset and the dollar’s status as a safe-haven currency.
Factor Impact on BTC/USD
Stronger USD (DXY ↑) Typically bearish for Bitcoin (BTC ↓)
Weaker USD (DXY ↓) Typically bullish for Bitcoin (BTC ↑)
Fed Rate Hikes Strengthens USD, pressuring BTC
Risk-On Sentiment Weakens USD demand, supports BTC
Recent Trends in 2025
Decoupling from Historical Patterns:
Despite the DXY falling 9% year-to-date (YTD) in 2025, Bitcoin has declined 6%, diverging from its typical inverse relationship.
This anomaly reflects Bitcoin’s growing correlation with equities (e.g., Nasdaq) amid global trade war tensions and its reduced linkage to gold.
Monetary Policy Impact:
The Federal Reserve’s restrictive policy (4.50% rate) has bolstered the USD, limiting BTC’s upside despite easing trade tensions.
Bitcoin’s fixed supply and speculative nature amplify sensitivity to liquidity shifts.
Correlation Metrics:
2024 Q1: BTC/DXY correlation coefficient of -0.65, indicating a strong inverse relationship.
2025: Correlation weakened due to macroeconomic uncertainties (e.g., U.S.-China tariffs) and BTC’s shifting market role.
Critical Factors Influencing BTC/USD Dynamics
Fed Policy Signals: Delayed rate cuts (priced for June 2025) sustain USD strength, capping BTC rallies.
Risk Sentiment: Safe-haven USD demand spikes during geopolitical crises (e.g., trade wars), pressuring BTC.
Institutional Adoption: Growing BTC integration into traditional finance may reduce volatility and alter its correlation profile.
2025 Outlook
Short-Term: BTC faces headwinds from USD resilience and equity market volatility but could rebound if Fed cuts materialize.
Long-Term: Structural drivers (halving, institutional demand) may restore BTC’s inverse correlation with the USD as macro conditions stabilize.
In summary, while Bitcoin and the dollar often move inversely, 2025 has seen this relationship tested by shifting market dynamics. Traders should monitor Fed policy, risk appetite, and BTC’s evolving role in portfolios for directional cues.

Btc ready to blast 100000Fib levels are crossing one by one
Next target 99020 to 100000
Btc form LL TO LH TO HH
NEXT HIGH 99020 NEARLY

CVXUSDT | Long | DeFi Optimizer | (May 2025)CVXUSDT | Long | DeFi Optimizer Bounce with Growing Spot Demand | (May 2025)
1️⃣ Quick Insight:
CVX has caught my attention again—been watching it from the early days and now it’s starting to show strength, both on spot and futures. Current structure and sentiment are looking solid for a potential upside move.
2️⃣ Trade Parameters:
Bias: Long
Entry: Current market price
Stop Loss: $2.41
TP1: $4.75
TP2: $5.48
TP3: $5.76
TP4: $6.85
Partial Exit: Watching $4.17 closely as a short-term resistance area that could act as a milestone
3️⃣ Key Notes:
Let’s break down what CVX (Convex Finance) is. It's a DeFi protocol built on top of Curve Finance, aiming to optimize yield and boost capital efficiency. What makes it unique is that it allows users to earn boosted CRV rewards and CVX token incentives without locking up their CRV, which simplifies staking and governance participation.
CVX operates on Ethereum Layer 2, with its key partnership being with Curve. The team behind it remains anonymous, but the project is strongly community-driven.
From a market structure point of view, CVX has been showing strong spot interest and its footprint on futures markets has been growing. This confluence adds conviction to the trade idea. The structure suggests it wants to push toward $4.17 first, and if that breaks, there’s room to ride it further.
4️⃣ Follow-up:
If price confirms with good momentum past the $4.17 zone, I’ll consider updating this with a new scale-in or extended target. For now, just watching closely and ready.
Please LIKE 👍, FOLLOW ✅, SHARE 🙌 and COMMENT ✍ if you enjoy this idea! Also share your ideas and charts in the comments section below! This is best way to keep it relevant, support us, keep the content here free and allow the idea to reach as many people as possible.
Disclaimer: This is not a financial advise. Always conduct your own research. This content may include enhancements made using AI.

Can ETH Really Hit $80K? Adoption Trends and Technicals Say, YESEthereum’s adoption is booming in 2025, with over 50 major enterprises building on its network, a 21.7% global crypto ownership share, and $102 billion in stablecoin volume. Daily transactions hit $13.74 billion, and new addresses doubled to 200,000 in January 2025. The 3W chart shows ETH at $1,859.1, oversold (Stochastic RSI -101.5), hinting at a potential bounce. A 43x increase to $80K would need a $40 trillion market cap—steep but not impossible given historical 400x growth (2016–2021). Layer 2 scaling and ETF inflows support the bull case, but competition from Solana and privacy concerns could hinder the journey. What do you think? Or am I just insane?

CEL/USDT Daily Update📊 CEL Analysis Update: Bullish or Bearish? 🚀📉
Here’s an update on my CELUSDT analysis (daily timeframe):
📊 Current Status:
The price is at 0.101403 and has formed a double bottom around 0.0880. This pattern could signal a potential bullish reversal, but it still needs confirmation.
🔑 Key Levels:
Support: 0.0880 (strong base)
Resistance: 0.1150 and then 0.1300 (downtrend line)
Bullish Targets: 0.1900
Next low if it drops: 0.0690
📈 Bullish Scenario:
If the price breaks and holds above 0.1150, it could see an upward move to 0.1300 and even 0.1900. A break of the downtrend line (around 0.1300) would be a strong buy confirmation.
📉 Bearish Scenario:
If support at 0.0880 breaks, it could drop to 0.0690. In this case, be cautious as the downtrend might continue.
💡 Suggestion:
For a buy, wait for a breakout and hold above 0.1150 (stop loss below 0.0880).
For a sell, enter if 0.0880 breaks with a stop loss above 0.1150.
What do you think? Bullish or bearish? Share in the comments! 👇
#CELUSDT
#CryptoAnalysis
#TechnicalAnalysis
#TradingView
#CryptoTrading
#Bullish
#Bearish
#Cryptocurrency
#MarketUpdate
#DailyUpdate
#Crypto

“BTC Macro Trend: Liquidity Back On The Hunt” Mongoose Capital |🟢 Mongoose Capital Market Update | BTCUSD Weekly Outlook
Current Price: $97,592 (+4.06% weekly)
Key Resistance: $105,000
Key Support: $75,000
We’re observing a continuation of the post-halving macro uptrend, with BTC reclaiming the weekly trend baseline and approaching a key inflection zone.
🔍 Key Insights:
Trend Reclaim: Price has reclaimed dynamic support after a successful defense of $77,500. First sustained close above the signal line since prior pullback.
Delta Imbalance: Volume delta flipped positive (+12.39%) → underlying buy-side strength building into resistance.
Market Structure: Higher lows remain intact; momentum building toward retest of $105,000 resistance.
Volume Profile: Thin overhead volume from $100K to $110K signals potential breakout vacuum if resistance fails.
📝 Strategic Takeaways:
Close above $105,000 unlocks upside toward $115,000–$120,000.
Failure to break may trigger retest of $92,000–$93,000 as interim support.
Macro structure remains constructive while $77,000 holds.
Mongoose Capital proprietary indicators continue to show institutional accumulation on dips and momentum validation into key levels. This remains a tactical bull market until proven otherwise.
Follow Mongoose Capital for institutional-grade market insights.

PLANETUSDT Breakdown After Wedge, Base Forming for Relief RallyFollowing its initial post-listing rally, PLANETUSDT concluded its impulsive ascent within a bearish rising wedge formation, a classical exhaustion pattern. The subsequent breakdown triggered a steep decline, extending well around the 200% Fibonacci extension level, reflecting a structurally violent markdown phase. This collapse established a new low before price found equilibrium within a clearly defined immediate demand zone.
Current price action suggests a potential bottoming structure, with the asset attempting to base and consolidate within this demand region. Should buyers maintain control and price manage a sustained breakout above the descending channel resistance, a corrective leg to the upside becomes increasingly likely.
The short- to mid-term recovery target is situated near the 0.0000090901 level, which coincides with the broader critical supply zone—a region marked by previous heavy distribution. This area is expected to attract significant selling pressure, presenting a likely inflection point for a renewed bearish phase or potential macro rejection.

ROSEUSDT | Long | Technical Bounce + Strong Backing | (May 2025)ROSEUSDT | Long | Technical Bounce + Strong Backing | (May 2025)
1️⃣ Quick Insight:
ROSE has been in a downtrend for a while, but it's now showing some promising signs both technically and fundamentally. Price action is shaping up well, and I’ve decided to enter spot at the current level.
2️⃣ Trade Parameters:
Bias: Long
Entry: Market entry at current price
Stop Loss: $0.02000
TP1: $0.04667
TP2: $0.09399
TP3: $0.15275
Partial Exits: Around $0.03167 for a lighter position trim if needed
3️⃣ Key Notes:
Let’s quickly go over what ROSE is. It’s the native token of the Oasis Network—a Layer 1 blockchain designed for scalability, DeFi, Web3, and privacy. What makes it stand out is its confidential smart contract system and a unique architecture tailored for data tokenization.
The Oasis Network is backed by major players like Google, BMW, and institutions like Cambridge, Oxford, and UC Berkeley. The founder is Dawn Song, a professor at UC Berkeley, and the CTO is Raymond Cheng.
Competitors include Secret Network and NEAR Protocol, especially when it comes to privacy and interoperability. Future developments for ROSE include building bridges, strengthening privacy features, and expanding its ecosystem.
With strong fundamentals and a technical structure that’s holding well, this could be a solid long-term play with layered take-profit zones.
4️⃣ Follow-up:
If the structure continues to hold and volume picks up, I’ll consider updating this idea. For now, I’m keeping an eye on how it performs around the first TP level.
Please LIKE 👍, FOLLOW ✅, SHARE 🙌 and COMMENT ✍ if you enjoy this idea! Also share your ideas and charts in the comments section below! This is best way to keep it relevant, support us, keep the content here free and allow the idea to reach as many people as possible.
Disclaimer: This is not a financial advise. Always conduct your own research. This content may include enhancements made using AI.

Xcn short -9% dumpJust opened a short trade on xcn. Targeting 0.016744
Roughly 4+RR
Trend trade.
Daily is correcting
4hr and 1hr already flipped bearish.
Market not at strong support where enough demand is likely to come back in to make new Daily HL
-DTT

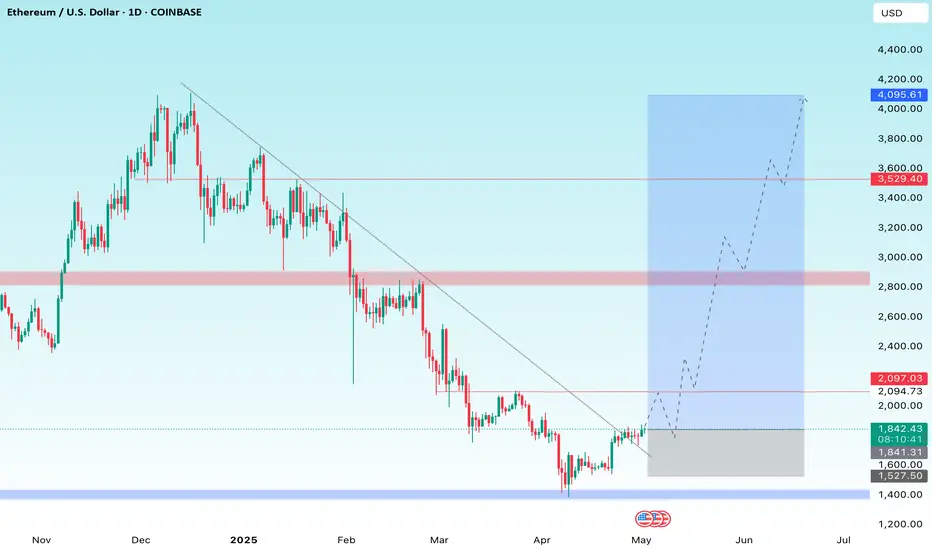
Ethereum (ETH) Breaks Descending Trendline – Eyeing $4,000?Ethereum (ETH) Breaks Descending Trendline – Eyeing $4,000?
Description:
Ethereum has officially broken out of a long-term descending trendline on the daily timeframe, signaling a potential trend reversal. After holding support near the $1,500–$1,600 zone, ETH has started forming higher lows and is now aiming for key resistance zones. A bullish scenario could see price rally toward $2,800, with a possible extension toward the $3,500–$4,000 zone if momentum continues.
The breakout is supported by strong price structure and rejection from major demand zones, making this a chart worth watching closely. Will the bulls take control and drive ETH back to 2024 highs?
Technical Levels to Watch:
• Support: $1,840 / $1,600
• Resistance: $2,100 / $2,800 / $3,530 / $4,095
Follow for more updates as this setup develops. Let’s see how Ethereum reacts to this breakout!
Stay tuned for live updates & detailed trade setups. Drop your thoughts below and don’t forget to follow for more high-probability analyses!
Btcusdt scalpers perspective.On the 15-minute timeframe, BTCUSDT formed a bullish inverse Head and Shoulders (iH&S) pattern. The initial target of $95,000 has already been reached. Further targets are $96,000 and $97,000. The invalidation level for this pattern is below $92,800.

Simple Technical Analysis for Bitcoin
If the price closes above $69,150, then, God willing, we may head toward the next target at $107,000.
However, if it closes below this level, the likely direction would be toward $84,200.
In my personal view — and God knows best — the chances of a downward move seem higher than an upward one at the moment.

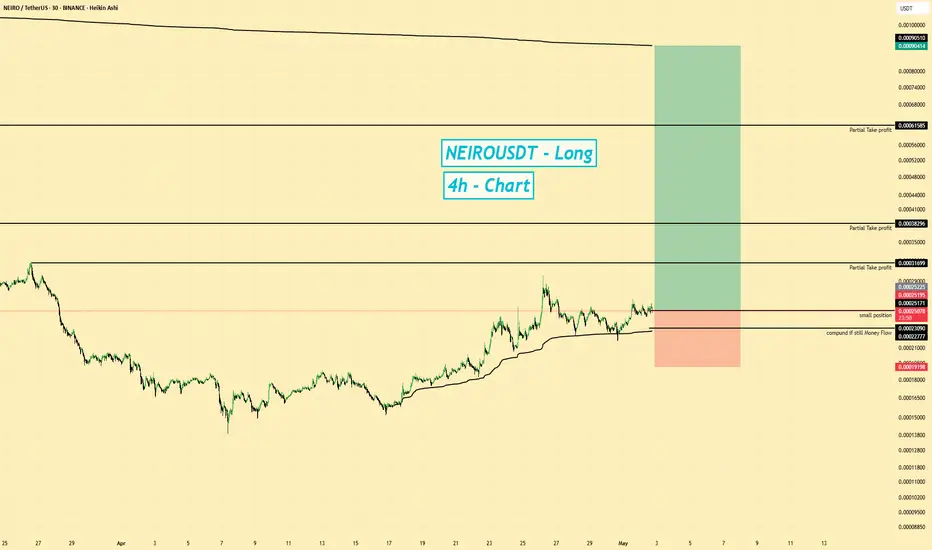
NEIROUSDT | Long | Technical Setup| (May 2025)NEIROUSDT | Long | Technical Setup in Accumulation Zone | (May 2025)
1️⃣ Quick Insight:
NEIROUSDT has been in a long-term downtrend and hasn’t shown much fundamental strength or interest. Still, from a technical point of view, it's forming a potential wedge or accumulation structure that could offer some upside.
2️⃣ Trade Parameters:
Bias: Long
Entry: Based on current structure, a small position setup is forming
Stop Loss / Take Profits: 📉 Please refer to chart for exact SL and TP levels
This will be a light position—not expecting fireworks, just playing the potential technical rebound.
3️⃣ Key Notes:
This is a speculative play with limited confirmation from fundamentals or money flow. The market hasn’t shown strong interest in NEIRO recently, but if buyers do step in, it could push the price toward the upper end of the current pattern. If not, that’s fine too—this setup is low-conviction and sized accordingly. There’s no strong base, but the shape of the current structure gives a reason to watch.
4️⃣ Follow-up:
If price action confirms further, I may scale or update this idea. Otherwise, it's just a watch-and-react plan.
Please LIKE 👍, FOLLOW ✅, SHARE 🙌 and COMMENT ✍ if you enjoy this idea! Also share your ideas and charts in the comments section below! This is best way to keep it relevant, support us, keep the content here free and allow the idea to reach as many people as possible.
Disclaimer: This is not a financial advise. Always conduct your own research. This content may include enhancements made using AI.
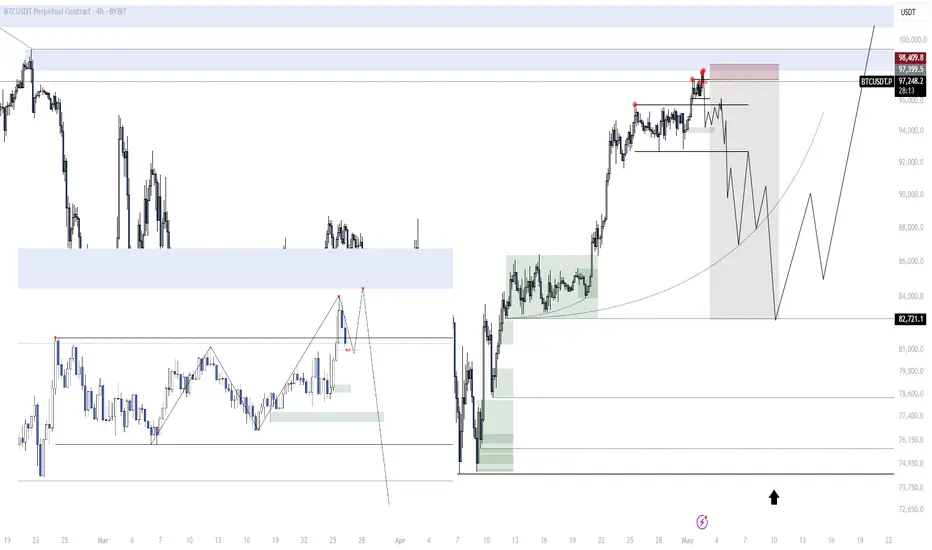
BTC next WeekThis is my outlook for the next week, going into the daily cycle low. A model 1 in this range which could confirm a PO3 would be perfect. After the weekend it should be clear what will happen next, so im patient.
Altcoins are about to melt faces The chart speaks for itself, every time it gets down to that bottom line and touches down there it skyrockets up. History has been repeating itself for many years. May and June are gonna be beautiful for crypto. Happy trading guys.

$CHILLGUY/USDT BREAKOUT!$CHILLGUY/USDT BREAKOUT!
Massive breakout from falling wedge + strong retest of the previous range resistance.
If this momentum holds, a 13x rally toward $0.58 is on the cards! 📈
Targets:
- $0.137
- $0.261
- $0.581
Ride or regret. DYOR, NFA 🚀

Reversal Alert: $ROSE Clears Trendline, Next Stop $0.060?$ROSE/USDT is showing early signs of a potential trend reversal. After months of respecting a strong descending trendline, price has finally broken above it and is now consolidating just below a key resistance zone.
This area aligns with both the previous supply and the 50 EMA, making it a critical level to watch.
A confirmed close above this resistance, backed by strong volume, could trigger a bullish continuation toward the $0.044 and $0.060 levels.
DYOR, NFA

IPUSDT | Long | Technical Rebound from Demand Zone | (May 2025)IPUSDT | Long | Technical Rebound from Demand Zone | (May 2025)
1️⃣ Quick Insight:
IPUSDT has been trending down, but it's still respecting technical levels well. I'm watching for a potential long setup as it corrects back into a key demand zone.
2️⃣ Trade Parameters:
Bias: Long
Entry: Around $3.75 (waiting for a corrective move into this area)
Stop Loss: $3.26
TP1: $4.36
TP2: $5.43
TP3: $6.12
Partial Exits: I may take most of the position off by TP2 (~15% move), then let the rest run toward TP3 if the market allows.
3️⃣ Key Notes:
Right now, there's not much fundamental backing—volume and interest seem low—but technically, the asset is still respecting structure. I’m not expecting a major macro reversal, just a technical bounce. Market-wide liquidations seem to have cleared out weak hands, so this could be a cleaner move if it plays out. Risk management is key here. Don't overleverage, especially in uncertain conditions.
4️⃣ Follow-up:
I’ll keep an eye on the price action and may update this idea if conditions change. Entry only triggers if we see a correction into the $3.75 zone.
Please LIKE 👍, FOLLOW ✅, SHARE 🙌 and COMMENT ✍ if you enjoy this idea! Also share your ideas and charts in the comments section below! This is best way to keep it relevant, support us, keep the content here free and allow the idea to reach as many people as possible.
Disclaimer: This is not a financial advise. Always conduct your own research. This content may include enhancements made using AI.


Ethereum Bulls Poised: $1875 Resistance Key to Next Leg UpETHUSD forms double top around $1875 and showed a minor sell-off. It hits an intraday low of $1816 and is currently trading around $1834.
Overall trend remains bullish as long as support of $1500 remains intact. The key near-term resistance is at $1875 (trend line joining $4109 and $3746) any breach above targets $2000/$2300/ $2500/$2770/$3000/$3400/$3600/$3800/$4000. A robust bullish trend will only materialize above $4100.
Immediate support is around $1675. Any violation below will drag the price down to $1620/$1500/$1200/$1000. A breach below $1000 could see Ethereum plummet to $800/$500.
It is good to buy above $1875 with SL around $1500 for a TP of $2770/$3000.

$AITECH/USDT Analysis:🧠 $AITECH/USDT Analysis:
After a long downtrend inside a falling channel, $AITECH broke out with strength, flipping the previous supply zone into support.
- Target: 0.15613
- Potential Gain: +303% from breakout
Watch for a retest & confirmation.
DYOR. NFA.

BTCUSD SIGNAL UPDATE READ THE CAPTAINBtcusd signal technical analysis satup 👇🏼
( BTCUSD) SEEL zone
( TRADE SATUP)
ENTRY POINT (97900) to (97800) 📊
FIRST TP (97400)📊
2ND TARGET (96800) 📊
LAST TARGET (96200) 📊
STOP LOOS (98500)❌
FALLOW RISK MANAGEMENT ✅
