BUY USDCADAN inverse head and shoulders pattern is emerging on USDCAD. I see price rising from this level towards the top, we will see what happens during nfp.
Forex market

Buy GBPUSDA bearish flag is in play and formation here. I am closely watching the price action. I believe price should begin to decline from this level

EURJPY SIGNAL UPDATE READ CAPTAINeurjpy seel now entry point (164.200) TO (164.100) take profit 1 (163.900) take profit 2 (163.550) last target (163.200) stop loss (164.500) TECHINAL ANALYSIS SATUP FALLOW RISK MANAGMENT

GBPAUD...LONG
[ OANDA:GBPAUD ] is approaching a level that has triggered key reactions in the past. Another reaction might be setting up soon. Scenarios are taking shape.
In case of a breakout, I’ll wait for a retest before positioning for the opposite direction.

GbpusdIt was really later on when I decided that the reason there are so many technical indicators out there is because none of them work very well.” - Chuck Hayes

DeGRAM | EURUSD Reached the $1.131 Level📊 Technical Analysis
● Triple rejection at 1.1420 caps EUR/USD; price coils into a bearish pennant beneath the channel mid-line, echoing earlier false breakouts.
● Loss of 1.1310 exposes 1.1200; fading RSI and lower highs flag supply.
💡 Fundamental Analysis
● Euro inflation slid to 2.2 %; ECB signals another 25 bp cut on 4 Jun, denting EUR yield.
● US Q1 GDP dipped but consumption held; jobless claims ~215 k and 10-yr yields near 4.3 % keep USD bid.
✨ Summary
Bearish pennant plus softer EU data versus steady US demand steer short EUR/USD toward 1.1200; risk topside above 1.1420.
-------------------
Share your opinion in the comments and support the idea with like. Thanks for your support!

EURCAD: True Bearish Reversal?!EURCAD formed a classic head and shoulders pattern following a retesting of an important historical resistance level.
A break below the neckline, accompanied by a strong bullish candle, confirms a bearish signal.
I anticipate a corrective movement, potentially reaching as low as 1.5555.

AUDJPY: Key Resistance Ahead 🇦🇺🇯🇵
AUDJPY is approaching an important resistance cluster on a daily.
The price formed a cup and handle pattern on that on an hourly.
Its neckline has just been broken.
I expect a pullback at least to 92.55 level.
❤️Please, support my work with like, thank you!❤️
I am part of Trade Nation's Influencer program and receive a monthly fee for using their TradingView charts in my analysis.

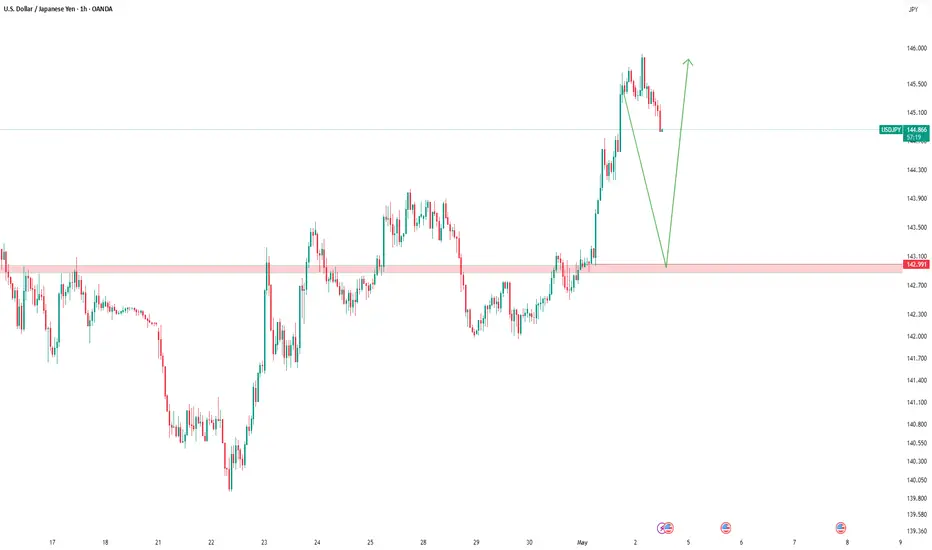
Usd/Jpy 02-May-2025 AnalysisDisclaimer: easyMarkets Account on TradingView allows you to combine easyMarkets industry leading conditions, regulated trading and tight fixed spreads with TradingView's powerful social network for traders, advanced charting and analytics. Access no slippage on limit orders, tight fixed spreads, negative balance protection, no hidden fees or commission, and seamless integration.
Any opinions, news, research, analyses, prices, other information, or links to third-party sites contained on this website are provided on an "as-is" basis, are intended only to be informative, is not an advice nor a recommendation, nor research, or a record of our trading prices, or an offer of, or solicitation for a transaction in any financial instrument and thus should not be treated as such. The information provided does not involve any specific investment objectives, financial situation and needs of any specific person who may receive it. Please be aware, that past performance is not a reliable indicator of future performance and/or results. Past Performance or Forward-looking scenarios based upon the reasonable beliefs of the third-party provider are not a guarantee of future performance. Actual results may differ materially from those anticipated in forward-looking or past performance statements. easyMarkets makes no representation or warranty and assumes no liability as to the accuracy or completeness of the information provided, nor any loss arising from any investment based on a recommendation, forecast or any information supplied by any third-party.

Eur/Gbp Elliott wave May/02 hello eveyone...
as you can see it seems wave 4 completed ( Holding 50% ) and wave 5 can start....

GBPJPY Breakout Play: Will the Retest Fuel the Next Rally?
GBPJPY recently broke out of a descending trendline and resistance zone, fueling a strong bullish move past 193. With momentum slowing, price is now pulling back — setting up a textbook retest opportunity.
Key Zones:
Breakout Support / Demand Zone: 190.500–191.150
Price to Watch: 191.147 — potential retest and bounce zone
Next Target: 194.500–195.000 supply area
Scenarios in Focus:
1. Bullish Retest: A clean bounce from the 190.5–191.1 demand zone could trigger a strong continuation toward 195.
2. Deeper Pullback: A break below 190.5 would invalidate the bullish structure in the short term.
Volume profile shows heavy accumulation below, adding confluence to the support. Patience is key — wait for bullish confirmation around 191.

USDJPY .. LONGOANDA:USDJPY
Price is nearing a critical level around .
No setup, no trade. For me, a solid plan always comes before any prediction.
****If the zone is broken and confirmed with a retest, I’ll adjust my plan accordingly for a possible reverse trade.
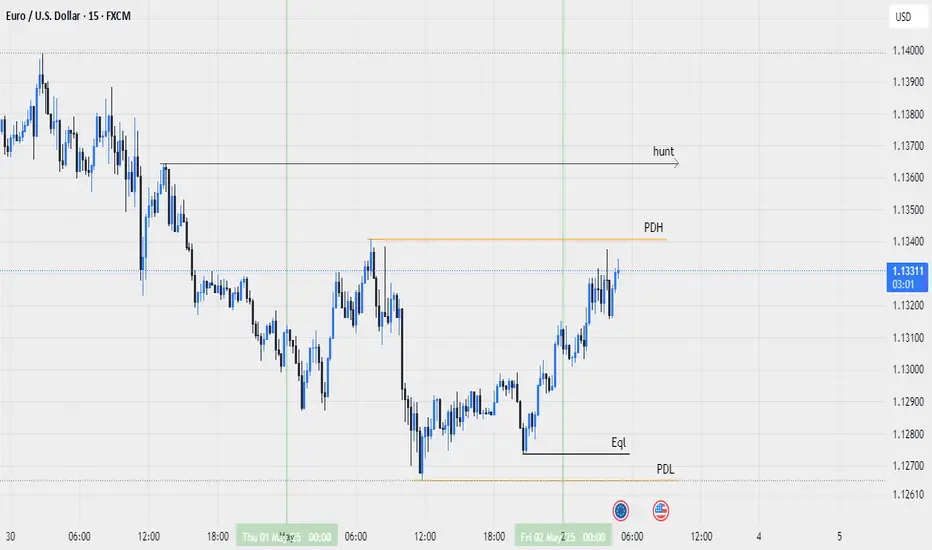
gbpusd 2025-5-2today price is middle of chart
on top we have fvg 1h and pdh , we wait to reach price to these level then we wait to see down setup then enter
on bottom we have pdl , we wait to reach price to this level then we wait to see up setup then enter

eurusdlast of the week , today price is near pdh and we expect price go down
if price reach to this level , we wait to see down setup.
price is far from of pdl so we need more data do see what place is goo to buy
GBPJPY: TGIF setup 2Clear Fibonacci retracement confluence.
Visible signs of exhaustion, but slightly less immediate bearish confirmation. Good candidate for a careful and controlled entry.
#propfirm #100K

EUR/USD Trendline Breakout + Demand Zone Rejection Price action has broken through a well-respected descending trendline after multiple rejections, signaling a potential bullish reversal. The latest structure shows a clear sweep of liquidity below the previous low, followed by a strong bullish engulfing and confirmation from a demand zone bounce.
🔹 Entry: Taken post-trendline break and bullish confirmation
🔹 Stop Loss: Placed below the recent demand zone and liquidity sweep
🔹 Target 1: 1.13581
🔹 Target 2: 1.13895
🔹 Risk-Reward: 2.52+
Volume and volatility are showing early signs of expansion, supporting the bullish outlook. Will be monitoring price reaction around 1.1350–1.1360 zone for partials.

USDJPY: TGIF setupafter news yesterday, USDJPY made the strong spike and did a liquidity swipe on late buyers at Tokyo open. well, the whole week see bullish in play, leaving some FVG in HTH, very ideal for TGIF setup.
As soon as I see the bearish candle in H1 TH, enter 100% lot size with expectation of retracement to 20-30% fib, as ICT's textbook.
#propfirm #100k

GBPUSD short to Asia's lowGBPUSD is showing bearish sentiment. We are in a downtrend for a few days now. It may reverse today with the news but until then my bias is bearish. I am taking a short to Asian session's low. Let's see if it play's out.
I normally don't like to go against the higher timeframe trend, especially in a possible reversal zone. So if you take the same trade, use less risk.
Once the market shows signs of reversal, we can ride it back up.

GBPUSD long to last day's highGBPUSD is showing signs of reversal. The bias for me for today is bullish. It experienced a retracement to the current level and is now showing bullish candles and rejections from the liquidity area. I am targeting yesterday's highs but it could go way higher than that with NFP.
Leave your thoughts in the comments.

USDJPY Sell Setup Idea✅ Technical Basis:
Bearish divergence spotted on RSI (price making higher high while RSI making lower high).
Double top pattern formed at resistance zone.
Resistance is holding firm, signaling potential downside.

GBPUSD | 02.05.2025SELL 1.33000 | STOP 1.34600 | TAKE 1.31400 | Let's consider building a descending structure of price movement to the nearest short-term support levels. Technically, the pressure on the British pound continues from the local maximums.

NZDCAD at Key Resistance Level: Will it Drop To 0.81608?OANDA:NZDCAD is approaching a key resistance level that has previously acted as a strong barrier, triggering bearish momentum in the past. This zone also aligns with prior supply areas where sellers have stepped in, making it a potential point of interest for those looking for short opportunities. Given its historical significance, how price reacts here could set the tone for the next move.
If bearish signals emerge, such as rejection wicks, bearish candlestick patterns, or signs of weakening bullish pressure, I anticipate a move toward the 0.81608 level. However, a clear breakout above this resistance could challenge the bearish outlook and open the door for further upside. It's a pivotal area where price action will likely provide clearer clues on the next direction.
Just my take on support and resistance zones, not financial advice. Always confirm your setups and trade with a proper risk management.
Best of luck!

This is a 4H chart of EUR/USD with multiple SMC annotations.1. Chart Reading According to SMC
Structure Analysis:
• Major BOS: Confirmed bullish structure around April 10 after the rally from FVG.
• Minor BOS & OBs: Price formed lower highs and lower lows near the 1.1450–1.1500 zone.
• Major CHoCH (Change of Character): Marked clearly around the last day low, confirming shift
to bearish structure.
• Liquidity Sweeps: Price swept the daily low and reacted — indicating smart money
accumulation at a key level.
Key SMC Zones:
• OB (Bearish): 1.1380–1.1430 zone — price likely to reject here.
• OB (Bullish): ~1.1265–1.1300 (reacted twice).
• FVG: Older demand imbalance marked earlier in the rally (around 1.0940–1.1000).
⸻
2. Marked Points in Chart
• Major BoS / CHoCH: Structural shifts defining directional bias.
• D1 TP (1.1300): A take-profit level around the midpoint of a larger daily leg.
• Last Day High / Low: Defined for internal liquidity targeting.
• OBs & Liquidity Zones: Precisely mapped for institutional activity clues.
⸻
3. Swing High & Low of the Day
• Swing High: 1.13420 (Last day high zone).
• Swing Low: 1.12652 (Last day low, also tapped for liquidity sweep).
These are intraday reference points for short-term setups.
⸻
4. Trade Direction
• Current HTF Bias: Bearish (post major CHoCH & OB rejections).
• However, price is currently reacting from a demand zone near 1.1265.
• Short-Term Direction: Bullish retracement toward 1.1340–1.1380, possibly to mitigate OB or
FVG.
⸻
5. Best Risk-Reward Setup
Setup: Buy the retracement from demand (reactive long) .
• Entry: 1.1270–1.1285 (OB demand + liquidity sweep)
• SL: Below 1.1260
• TP1: 1.1340 (last day high)
• TP2: 1.1380 (upper OB/fill FVG)
• RRR:
• TP1: ~1:3
• TP2: ~1:5
OR
Setup: Wait for price to reach OB at 1.1380, then go short.
• Entry: 1.1380–1.1400
• SL: 1.1430 (above OB)
• TP1: 1.1300 (internal structure)
• TP2: 1.1265 (retest demand)
• RRR: ~1:4
⸻
6. Trade Setups for Multiple Timeframes
5-Minute Setup (Refined Entry within OB):
• Look for CHoCH or internal FVG near 1.1270–1.1285 (bullish confirmation).
• Entry after candle body closes above last bearish candle.
• SL: Below 1.1260
• TP: 1.1340 (intraday high).
1H Setup:
• Wait for price to retrace and form FVG or CHoCH inside 1.1265–1.1280.
• Enter long on bullish engulfing/OB mitigation.
• TP: 1.1340–1.1380
• SL: Below OB.
4H Setup:
• Trend is bearish, but bullish pullback expected.
• Either take the long into OB or wait to short at 1.1380.
⸻
7. CRT Model Evaluation
• C – Context: Market just made a major CHoCH, but reacted from a demand OB with a liquidity
sweep.
• R – Retracement: Price is retracing into premium zones — near 50% of the daily range.
• T – Trend Continuation: Expect bearish continuation from the 1.1380 zone, unless price breaks
structure.
⸻
Conclusion
• Short-Term Bias: Bullish retracement toward 1.1340–1.1380.
• Swing Bias: Bearish from OB rejections and structural breaks.
• Best Setup Now: Long from 1.1270–1.1280 → TP 1.1340–1.1380.
• Later Opportunity: Short from 1.1380 → TP back toward 1.1265.
