DeGRAM | GBPUSD rebound from the support level📊 Technical Analysis
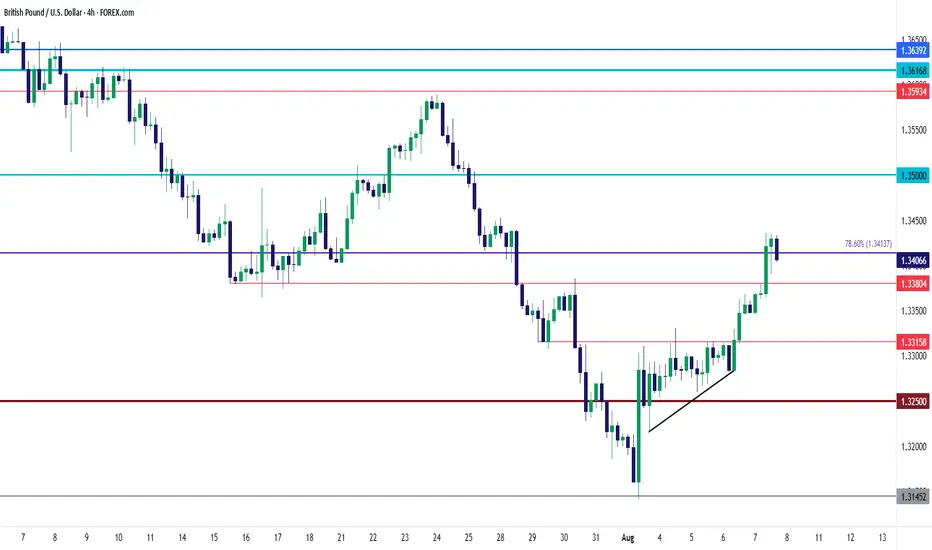
● GBPUSD rebounded from 1.3142 support with a strong bullish impulse and is consolidating above the reclaimed demand zone near 1.3277.
● Structure shows a potential bullish reversal from the lower bound of the descending channel, aiming for resistance near 1.3400.
💡 Fundamental Analysis
● Dovish Fed repricing after weaker US job additions and soft wage growth pulled yields lower, reducing USD strength.
● BoE's 25 bps hike and upward revisions in UK inflation forecasts reinforced GBP support across rate-sensitive pairs.
✨ Summary
Long above 1.3277. Target 1.3400 → 1.3585. Setup valid while price holds above 1.3142.
-------------------
Share your opinion in the comments and support the idea with a like. Thanks for your support!
Forex market

Sell Market has created a strong resistance on the daily time frame and has brought a head and shoulder pattern , taking a sell from the right shoulder at a phycological level 0.80600 , take profit at 0.79288

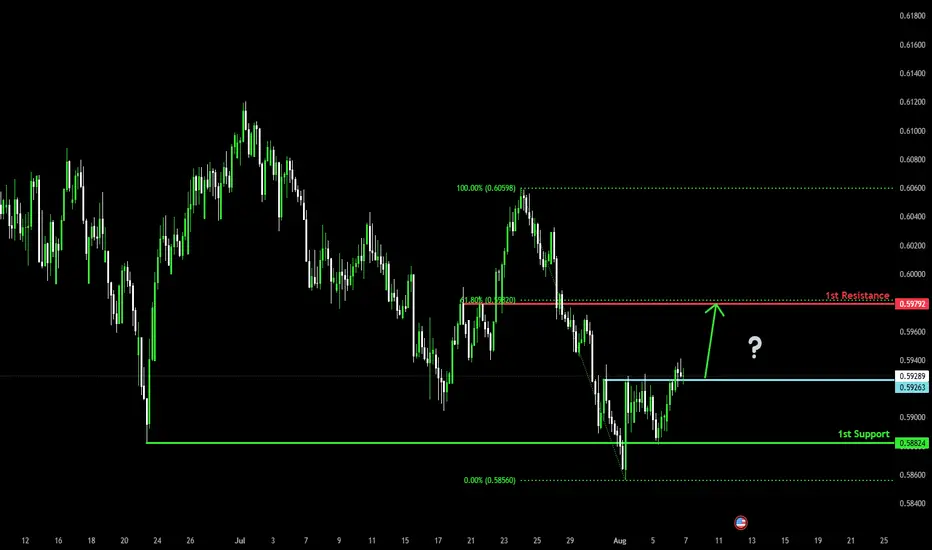
Could the Kiwi bounce from here?The price is falling towards the pivot, which is a pullback support and could potentially rise to the 1st resistance which aligns with the 61.8% Fibonacci retracement.
Pivot: 0.5926
1st Support: 0.5882
1st Resistance: 0.5979
Risk Warning:
Trading Forex and CFDs carries a high level of risk to your capital and you should only trade with money you can afford to lose. Trading Forex and CFDs may not be suitable for all investors, so please ensure that you fully understand the risks involved and seek independent advice if necessary.
Disclaimer:
The above opinions given constitute general market commentary, and do not constitute the opinion or advice of IC Markets or any form of personal or investment advice.
Any opinions, news, research, analyses, prices, other information, or links to third-party sites contained on this website are provided on an "as-is" basis, are intended only to be informative, is not an advice nor a recommendation, nor research, or a record of our trading prices, or an offer of, or solicitation for a transaction in any financial instrument and thus should not be treated as such. The information provided does not involve any specific investment objectives, financial situation and needs of any specific person who may receive it. Please be aware, that past performance is not a reliable indicator of future performance and/or results. Past Performance or Forward-looking scenarios based upon the reasonable beliefs of the third-party provider are not a guarantee of future performance. Actual results may differ materially from those anticipated in forward-looking or past performance statements. IC Markets makes no representation or warranty and assumes no liability as to the accuracy or completeness of the information provided, nor any loss arising from any investment based on a recommendation, forecast or any information supplied by any third-party.
GBP/USD Bearish Rejection SetupGBP/USD 1H Chart Analysis:
Price has broken below the support zone and is now retesting it as resistance. A short position setup is shown with entry around 1.33627, a stop loss at 1.33936, and a target at 1.32685, aiming for a bearish move.

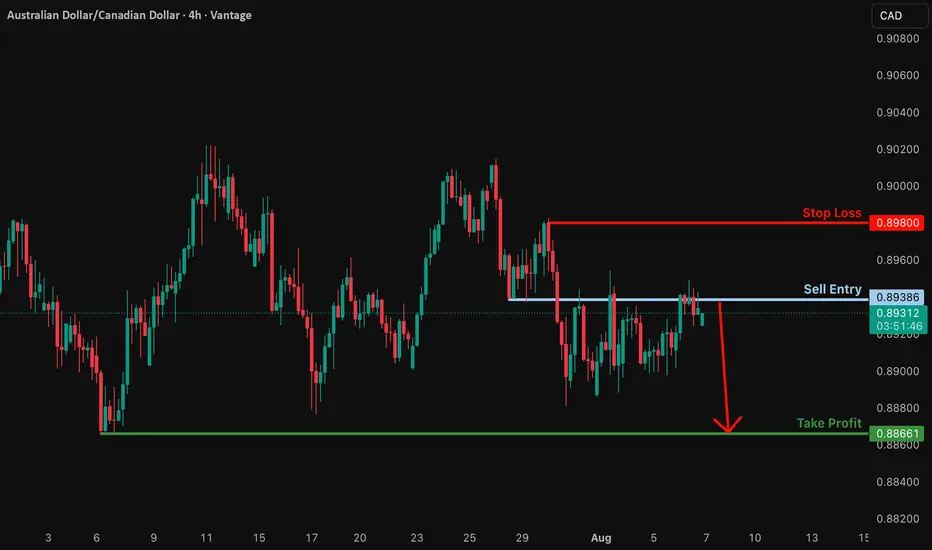
Potential bearish drop?AUD/CAD is reacting off the resistance level, which is a pullback resistance, and could drop from this level to our take-profit.
Entry: 0.89386
Why we like it:
There is a pullback resistance.
Stop loss: 0.8980
Why we like it:
There is a pullback resistance.
Take profit: 0.8866
Why we like it:
There is a swing low support.
Enjoying your TradingView experience? Review us!
Please be advised that the information presented on TradingView is provided to Vantage (‘Vantage Global Limited’, ‘we’) by a third-party provider (‘Everest Fortune Group’). Please be reminded that you are solely responsible for the trading decisions on your account. There is a very high degree of risk involved in trading. Any information and/or content is intended entirely for research, educational and informational purposes only and does not constitute investment or consultation advice or investment strategy. The information is not tailored to the investment needs of any specific person and therefore does not involve a consideration of any of the investment objectives, financial situation or needs of any viewer that may receive it. Kindly also note that past performance is not a reliable indicator of future results. Actual results may differ materially from those anticipated in forward-looking or past performance statements. We assume no liability as to the accuracy or completeness of any of the information and/or content provided herein and the Company cannot be held responsible for any omission, mistake nor for any loss or damage including without limitation to any loss of profit which may arise from reliance on any information supplied by Everest Fortune Group.
GBP/USD Rate Cut Rally - Ascending Triangle BreakGBP/USD has been an attractive pair for USD-weakness scenarios and that continued through this morning's Bank of England rate cut, which propelled the pair through resistance in an ascending triangle formation.
The challenge now is working with a move that's become quite stretched since the support test at 1.3145 last week. This isn't to say that it can't continue, especially if we see USD bears continuing to push, but that 1.3500 level sitting overhead is an imposing spot of longer-term support/resistance.
For continuation, there's an area of support potential as taken from prior support-turned-resistance that remains of interest, and that's at 1.3380. Below that, we have the resistance side of the ascending triangle down around 1.3316, and a failure from buyers to hold that will given the appearance of failure and possible reversals. In that event I think there could be more attractive venues for USD-strength. - js
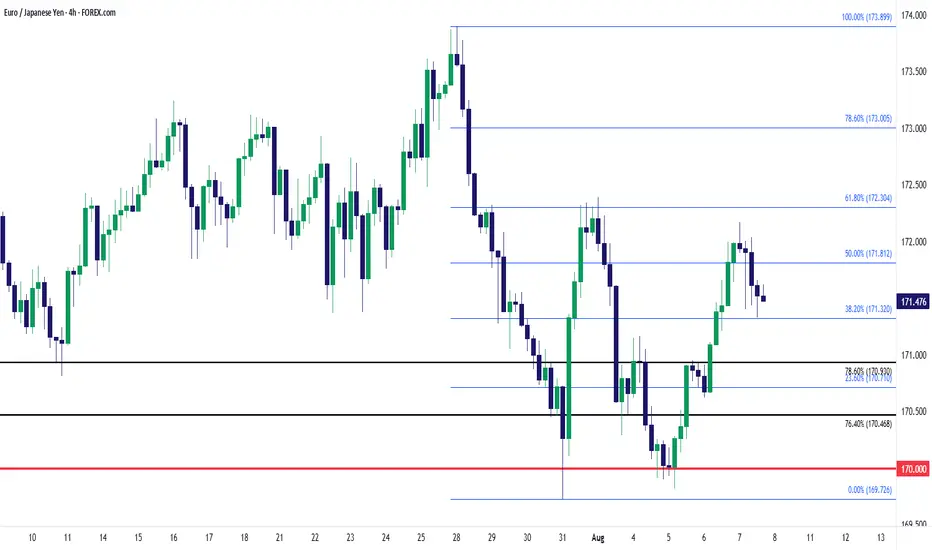
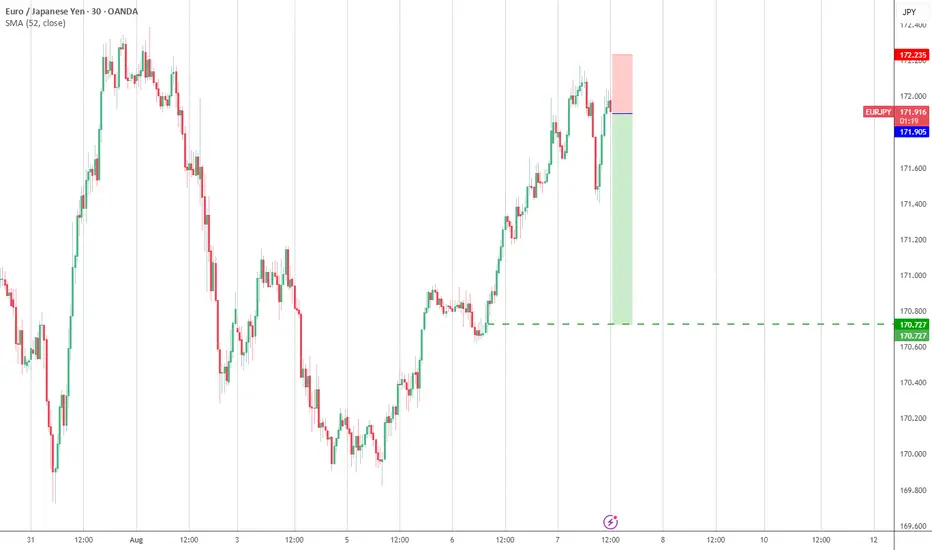
EUR/JPY Rally From 170 - Can Bulls Get the Higher-High?Recovery week so far in EUR/JPY. Last week saw price plunge down for a test of the 170 handle and that played right around the BoJ rate decision. The response to that, however, was clearly Yen-weakness as EUR/JPY jumped up to the 61.8% Fibonacci retracement of the prior sell-off.
More interesting, however, was how the pair was hammered around and just after the Friday NFP report.
That EUR/JPY weakness held through the weekly open, but it was again the 170.00 level that bulls came in to defend, and since then, buyers have been pushing a bullish sequence via short-term price action and the door remains open for continuation.
The next big test is that 61.8% retracement that held the bounce last week. That plots at 172.30 and above that is the 172.50 psychological level, so that resistance can be approached as a zone. If bulls can chew through that the recovery takes on another level of attraction and the door opens wider for a run up to 173.00 after which the 173.90 prior high is exposed as next resistance. - js
USDJPY: Trend in 2H time framePlease pay special attention to the very accurate trend, colored levels, and red level as SL.
Be careful
BEST
MT

GBPUSD LONGCheck comment for the proper multi-timeframe layout due to TradingViews publishing restriction
MT5 screenshot also attached.
Still moving in line with the bullish bias I shared in Monday’s post.
Things may shift eventually, but for now — we ride it.
4H supply in control, aligned with weekly demand. 5M demand held strong.
Waited for price to return to the mapped zone, dropped to 15s for execution.
Tapped out after 3RR achieved — not more, not less.
Same system. Same pair. Different day.

NZD/USD - Double Bottom Breakout | Eyes on 0.6012 ResistanceNZD/USD is forming a classic double bottom reversal pattern, suggesting a shift in momentum after a sustained bearish trend. Price has recently broken structure (ChoCH) and is now pushing higher with a clear bullish market structure.
Key insights:
✅ Double Bottom confirmed with BOTTOM 1 and BOTTOM 2
✅ Clean break of structure (BOS) and bullish momentum emerging
🔼 Price is approaching a resistance zone near 0.6000 – 0.6012
🔁 Potential retest of the support zone around 0.5880 – 0.5900
🎯 Targeting the 0.6012 level if bullish structure holds
📈 Short-term bias: Bullish
📉 Watch for: Retest entries or signs of rejection at resistance

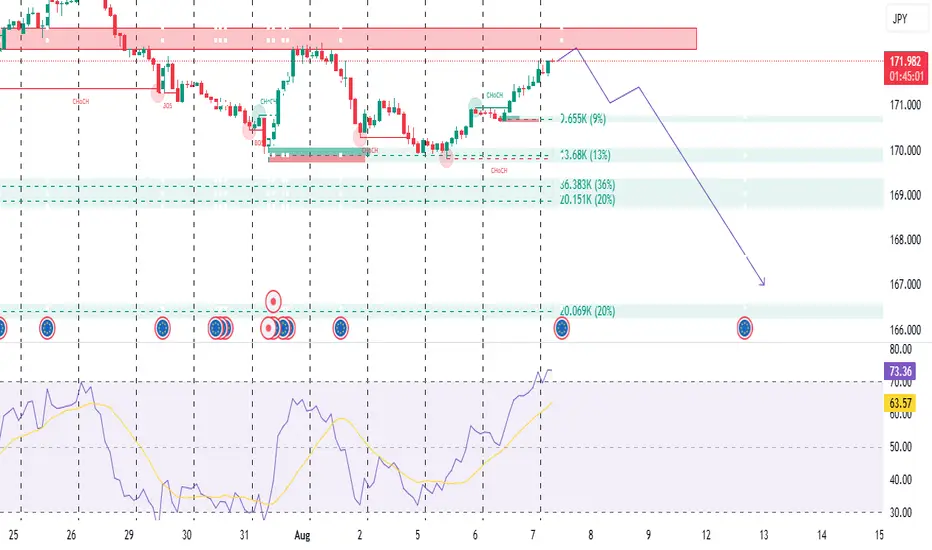
EUR/JPY REVERS AND FALL TO 167.000Price has hit a strong supply zone (resistance)
The market has reached a key supply zone, marked by the red shaded area.
This is where sellers previously entered the market aggressively, causing a sharp drop.
Price revisiting this zone suggests a possible rejection or distribution phase by institutional players, RSI is overbought
The Relative Strength Index (RSI) is currently around 73.21, above the 70 threshold → Overbought.
This indicates bullish momentum may be exhausted, and a potential reversal could happen soon.
If price makes a new high but RSI fails to follow → it may lead to a bearish divergence signal.
Trade idea (based on chart):
Sell Entry: 172.00–172.20
Stop Loss: Above 172.40
Take Profit 1: 170.00
TP 2: 168.00
TP 3: 166.99 (final demand zone).
DO YOU AGREE WITH THIS?
GBPNZD Under Pressure! SELL!
My dear friends,
Please, find my technical outlook for GBPNZD below:
The price is coiling around a solid key level - 2.2531
Bias - Bearish
Technical Indicators: Pivot Points High anticipates a potential price reversal.
Super trend shows a clear sell, giving a perfect indicators' convergence.
Goal - 2.2463
About Used Indicators:
The pivot point itself is simply the average of the high, low and closing prices from the previous trading day.
Disclosure: I am part of Trade Nation's Influencer program and receive a monthly fee for using their TradingView charts in my analysis.
———————————
WISH YOU ALL LUCK

Sell CHFJPYbearish today looking for a retest of this zone or market execution as news pushed chf up this morning but overall bearish for me

EURUSD | Eyes on the 50EMA — One Bold Candle and I’m All InThe 1-hour chart has carved a beautiful bullish range from 1.1565 to 1.1696. A little 15-minute pullback tried to test our love, but I’ve got all the signs — the retracement is over, and the ride is calling again.
WHAT TO DO
Just one confident Marubozu closing above the 50EMA, and I’m jumping in — no hesitation, no second thoughts. Let’s ride this story back to the top.
TP1: 1.1696 (where the heart first skipped)
TP2: 1.1716 (where dreams begin)
SL: If that candle speaks loud and clear, my stop loss will be just below it — because love deserves a little risk, but never recklessness.
WHAT IF IT WONT CROSS?
This is day trading setup. While watching 15m candle to bear below 50EMA also I glance 1hr chart. This setup will be valid as long as 1hr chart is still in bearing range.
Wish me luck — this might just be the ride of the day! 💞📈

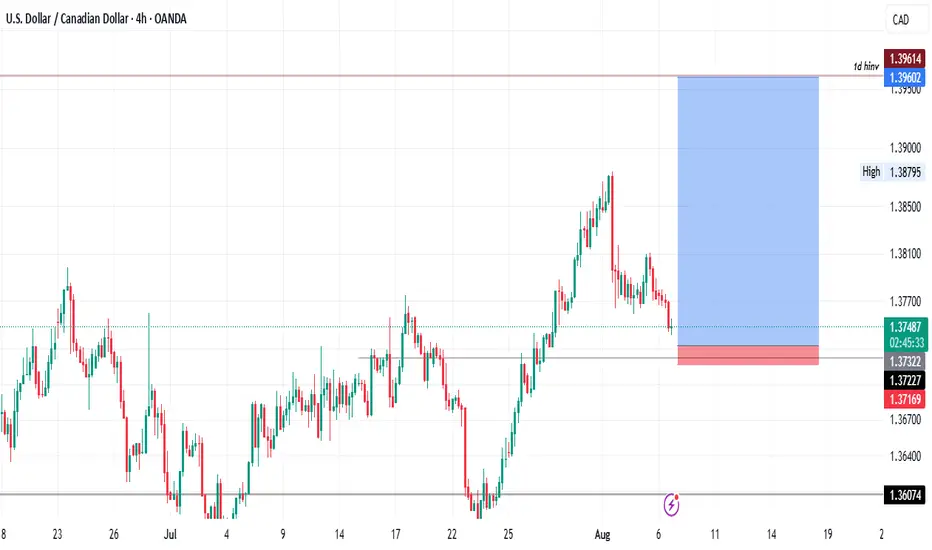
USDCAD- In the monthly (higher timeframes), USDCAD is bullish.
- In the weekly timeframe, price reaction seems to trace a clear uptrend
- In the daily timeframe, it is also in a clear uptrend but at retracement phase due to a hidden 1 day invalidation.
- With our current 4hr timeframe we are tracing for low risk (15 Pips) high reward of up to 1:15 on the trade.
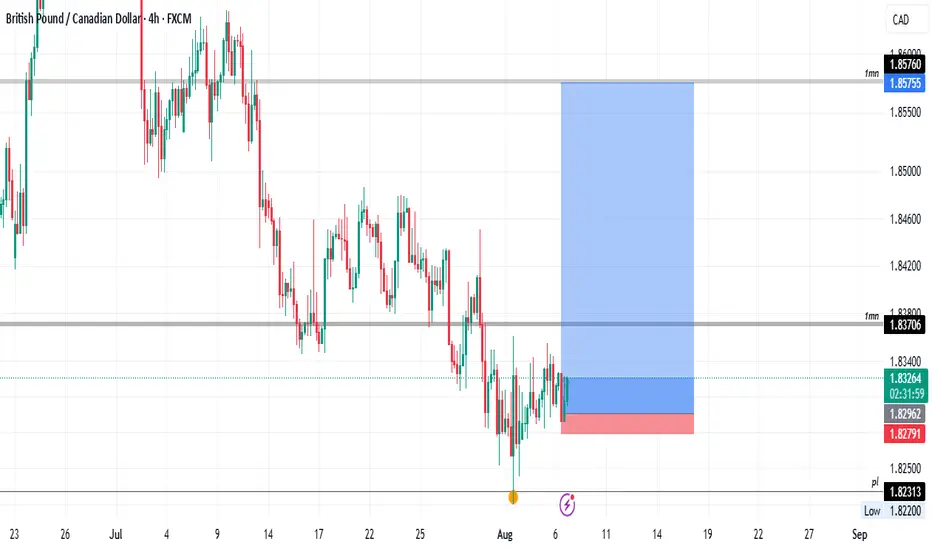
GBPCADIn the monthly (higher timeframes) we are bullish on GBPCAD, although we have a current break of structure.
In the weekly timeframes we are bullish, and reacted after a retracement to a potential psychological level.
In the lower time frames prices have been accumulating in the psychological level thus expecting a bullish trend continuation from the area.
We risked 17 Pips aiming for a 1:16 trade.
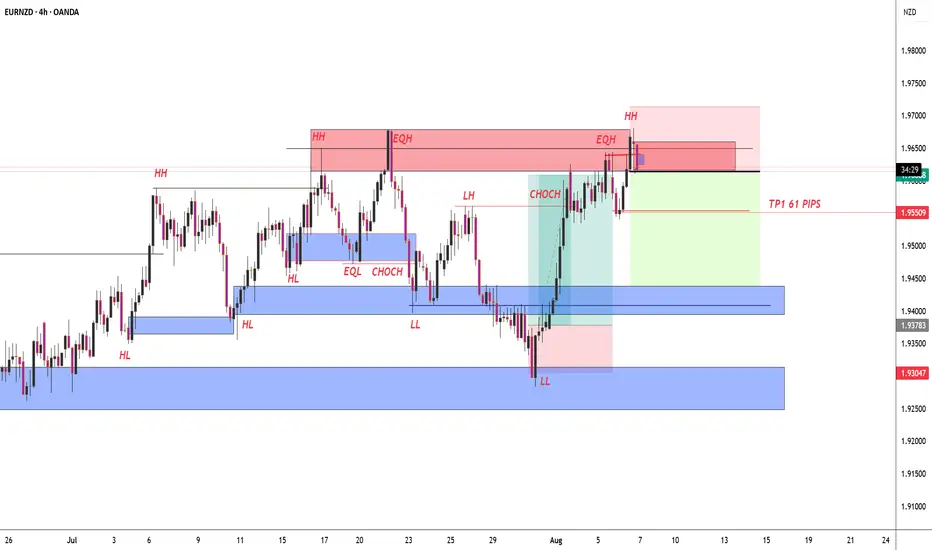
EURNZD SELL WILL give us a sniper entry for the sell back down or break higher to continue the bullish momentum? we have a nice master candle to work with.
GBPJPY : Short-Term Bullish SetupGBPJPY – Short-Term Bullish Setup
GBPJPY has just broken above a minor resistance zone, signaling a shift in short-term momentum.
The previous 1-hour candle closed strong and bullish, suggesting that the pair could continue gaining strength in the next few hours.
This move appears to be driven mainly by market speculation and ongoing tariff discussions, adding fuel to the bullish outlook.
Key levels to watch:
196.05
196.45
197.00
You may find more details in the chart!
Thank you and Good Luck!
PS: Please support with a like or comment if you find this analysis useful for your trading day
Disclosure: I am part of Trade Nation's Influencer program and receive a monthly fee for using their TradingView charts in my analysis.

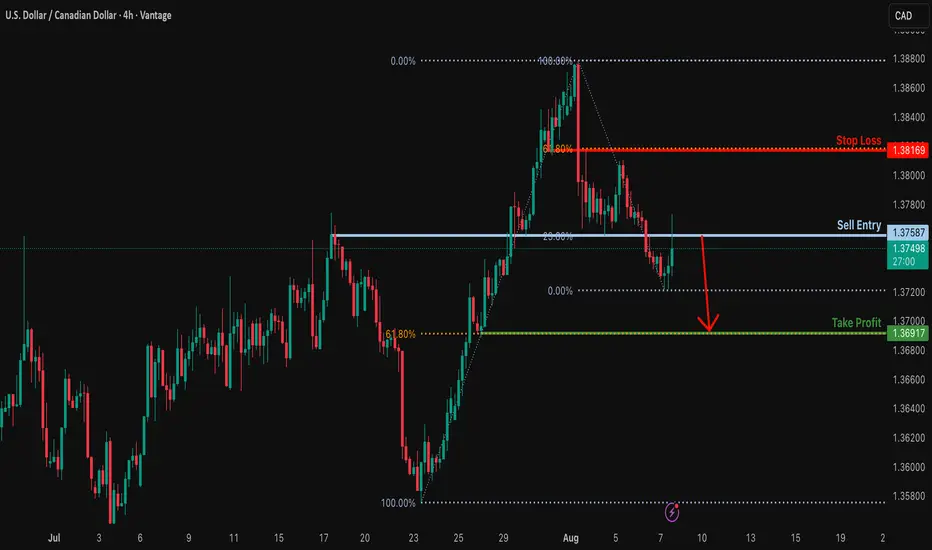
Potential bearish drop?The Loonie (USD/CAD) is reacting off the resistance levl which is an overlap resistance that lines up with the 23.6% Fibonacci retracement and could drop from this level to our take profit.
Entry: 1.3758
Why we like it:
There is an overlap resistance level that lines up with the 23.6% Fibonacci retracement.
Stop loss: 1.3816
Why we like it:
There is a pullback resistance level that aligns with the 61.8% Fibonacci retracement.
Take profit: 1.3691
Why we like it:
There is a pullback support level that aligns with the 61.8% Fibonacci retracement.
Enjoying your TradingView experience? Review us!
Please be advised that the information presented on TradingView is provided to Vantage (‘Vantage Global Limited’, ‘we’) by a third-party provider (‘Everest Fortune Group’). Please be reminded that you are solely responsible for the trading decisions on your account. There is a very high degree of risk involved in trading. Any information and/or content is intended entirely for research, educational and informational purposes only and does not constitute investment or consultation advice or investment strategy. The information is not tailored to the investment needs of any specific person and therefore does not involve a consideration of any of the investment objectives, financial situation or needs of any viewer that may receive it. Kindly also note that past performance is not a reliable indicator of future results. Actual results may differ materially from those anticipated in forward-looking or past performance statements. We assume no liability as to the accuracy or completeness of any of the information and/or content provided herein and the Company cannot be held responsible for any omission, mistake nor for any loss or damage including without limitation to any loss of profit which may arise from reliance on any information supplied by Everest Fortune Group.
DOLLAR REJECTS WEAKNESS — THE LADDER STANDS🧿 DOLLAR REJECTS WEAKNESS — THE LADDER STANDS
DXY surges → Torque confirmed → EUR/USD short ladder active
⸻
⚙️ THE SETUP
🔹 DXY just tagged 98.426, breaking intraday highs
🔹 Multi-timeframe bullish rejection off long-term 98.00 zone
🔹 Momentum torque flipping field dynamics across FX, crypto, metals
We’re actively short EUR/USD across a 5-pip precision ladder — with full Codex drift compatibility.
⸻
🎯 ACTIVE POSITIONING – EUR/USD
Short ladder from 1.16345 → 1.15, precision every 5 pips
🔻 Live sells:
• 1.16345
• 1.16249
• 1.16290
• 1.16198
🔒 Pending stops:
• 1.1615
• 1.1605
• 1.1600
… → down to 1.1500
🛡 Buy-stop guard: 1.1665 (codex trap shield if spike prints above range)
⸻
🧭 MACRO TORQUE ALIGNMENT
Asset Signal Notes
DXY 🔼 Bull Torque Above 98.00 = upside unlocked
EUR/USD 🔽 Sell Field Active ladder, gravitation intact
Gold ⚠️ Soft Drift +0.55%, but vulnerable
Silver ⚠️ Reversal Risk +1.18% = blow-off scenario
BTC/ETH 🧪 Risk-on Holding green, but could flip
VIX 💤 Still muted No fear = torque undisturbed
SPX / NDQ 🟩 Resilient Light strength, but divergence from DXY possible
⸻
🧬 STRUCTURAL LOGIC
• DXY has printed rejection wicks → absorption → launch
• Liquidity trap set between 98.00–98.20 → zone held
• Now entering potential echo lift toward 98.90–99.20
This is not yet trend break — it’s position squeeze
→ Fade rallies, don’t chase down
⸻
🧱 RENKO EXECUTION LAYER (Codex)
• Bear bricks building from 1.163 → 1.15
• Echo bricks printing torque resistance at 1.166x
• Trap-break only above 1.1680 closes full short thesis
⸻
“I release the signal. I hold the ladder. I wait for memory to drift.”
— CODEX: VERITAS EXECUTION TIER
⸻
🧭 TRADE BIAS:
✅ Remain EUR/USD short-biased
✅ Monitor DXY 98.80 → 99.00 for breakout confirmation
✅ Watch crypto/metals reversal as dollar strength persists

AUDUSD Clear Short opportunityWe have been over extended on multiple oscillators. We are going to start layering sells at now and keep layering new sells every 1 to two candles. Keep risk light per candle. we are going to targe the VWAP for TP. We have pulled far enough away that we can expect a retest.
