banknifty constantly resistng the same trend line resistancebank nifty shows weakness,taking resistance from a trendline resistance now unless and untill trendline not cross on higher side it will show weak ness.
lower side we can see 53500,53200
Market indices

USXUSD LOTWUSXUSD Higher Prices, LOTW Set
H4 FTB, H1 BOS
Expansive News day tomorrow with PPI and some more events in NY Session.
Let's see....

DXY buyMy bias on the 4hr timeframe is definitely bullish, this technical analysis and the deals that we see trump making with the mid east guys is definitely a good sign for the dollar, hopefully powell's speech today will be good news.
Staircase seen in real chartsFor the most part OANDA:NAS100USD has exhibited a near perfect staircase up so far.
It does appear fairly extended right now, but with rotation out of safe havens into risk on assets again, what remains to be seen is how much fuel is in the tank, and how far can the tailwind take it.

[INTRADAY] #BANKNIFTY PE & CE Levels(14/05/2025)Today will be flat opening expected in index. After opening if banknifty starts trading and sustain above 55050 level then upside movement expected upto 55450+ level. 55450 will act as a resistance for today's session. Possible banknifty will consolidate in between range of 55050-55450 level. In case banknifty gives breakout of 55500 level and starts trading above 55550 then expected strong upside rally of 400-500+ points. Any downside only expected below 54950 level.

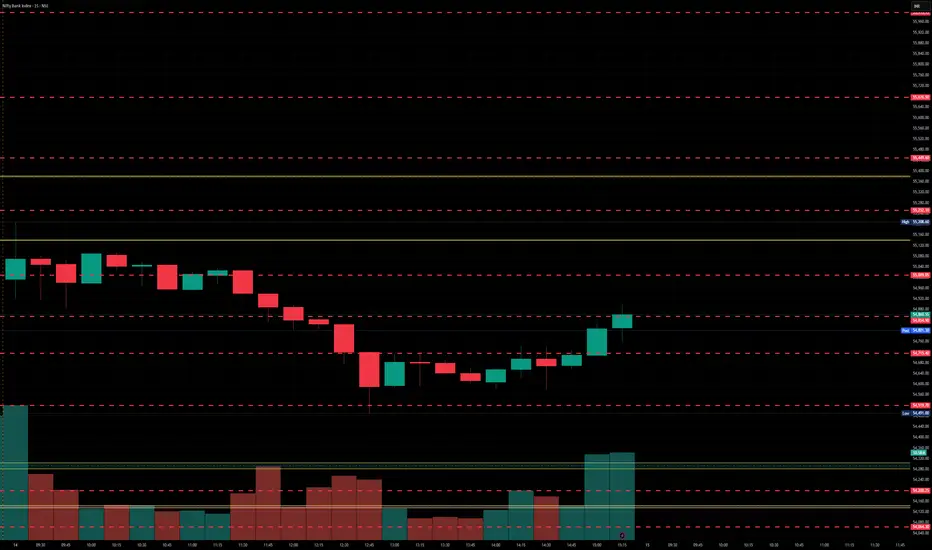
BankNifty levels - May 15, 2025Utilizing the support and resistance levels of BankNifty, along with the 5-minute timeframe candlesticks and VWAP, can enhance the precision of trade entries and exits on or near these levels. It is crucial to recognize that these levels are not static, and they undergo alterations as market dynamics evolve.
The dashed lines on the chart indicate the reaction levels, serving as additional points of significance. Furthermore, take note of the response at the levels of the High, Low, and Close values from the day prior.
We trust that this information proves valuable to you.
* If you found the idea appealing, kindly tap the Boost icon located below the chart. We encourage you to share your thoughts and comments regarding it.
Wishing you successful trading endeavors!

S&P500 Short: Update to Wave StructureAs mentioned, this is the 4th attempt to catch the peak for S&P500 (and Nasdaq). Over here, I break down the details of the wave structure to the subminuette level at the final wave. I believe this to be the final peak given that I do not see any more extension possible without changing the entire up-move wave labelling.
As usual, manage your risk and use a stop loss above the end of Wave Y.
Good luck!

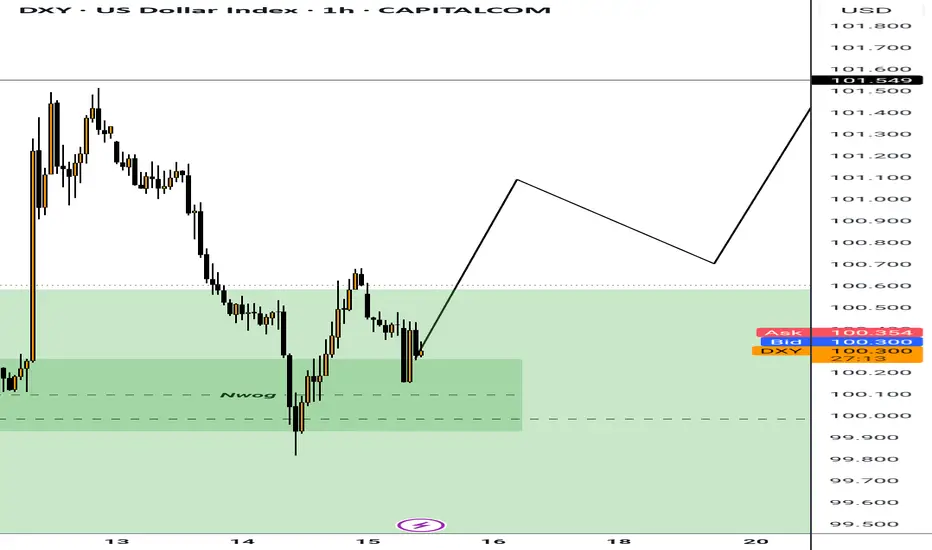
Slower Inflation Growth, Takes DXY lower.Overnight, the DXY traded lower, driven by 2 main factors.
1) The release of lower-than-expected CPI data at 2.3%
2) Rejection of the long-term bearish trendline and the area of confluence formed by the 61.8% and 38.2% Fibonacci retracement levels from the longer term.
If the DXY breaks below the 38.2% Fibonacci retracement level of the shorter term, we could expect to see further downside, toward the target level of 100.
This round-number level would align with the 61.8% Fibonacci retracement level and the short-term bullish trendline.

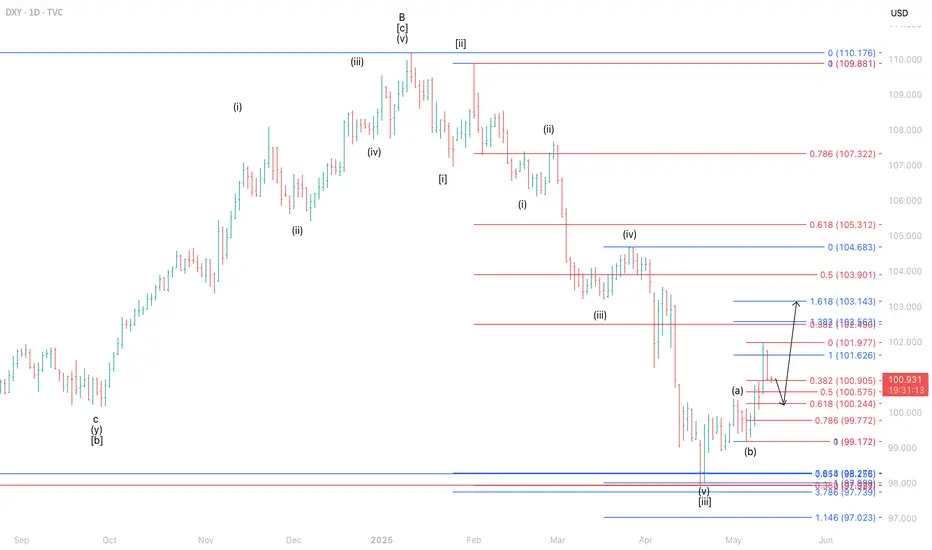
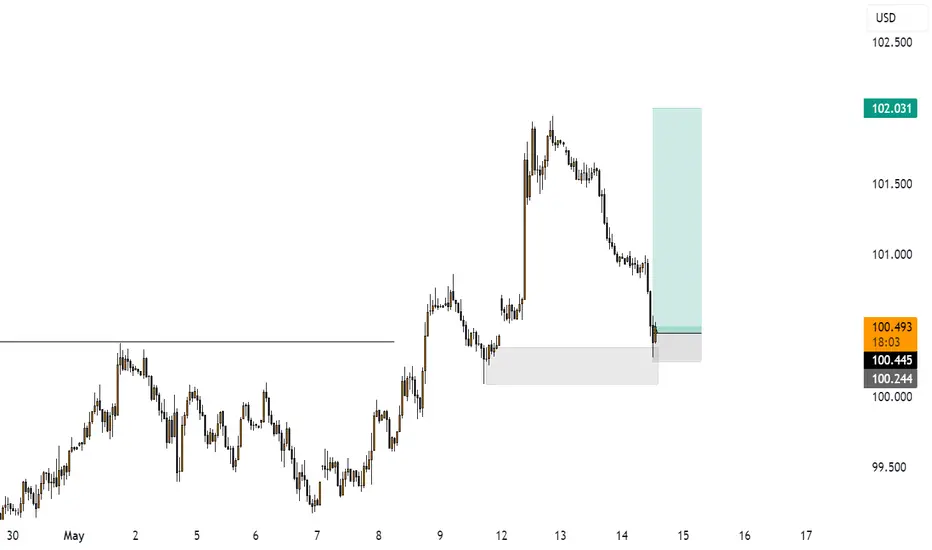
Short-Term Pullback Expected for DXY Before Potential ReboundThe current position of the DXY is estimated to be in wave ii of wave (c) of wave . This implies that the DXY remains vulnerable to a correction toward the 100.244–100.905 area. Subsequently, there is a potential for a rebound, with the index likely to retest the 102.563–103.143 zone.
KSE100 UPDATE FOR 14/5/25As already explained the Index faced rejection from the Supply Zone/ Resistance Area today, though there were above average volumes but still the index remained range bound and couldn't break the hurdle.
To start its journey towards 1,33,000 level index must break and sustain above the resistance area which spreads from 1,18,700 to 1,20,800.
If index fails to break above these levels in this week, today's range will just act as Up-thrust or Bull Trap and index may revert back to 1,15,000 level.
Cautious buying and adherence to SL levels is recommended

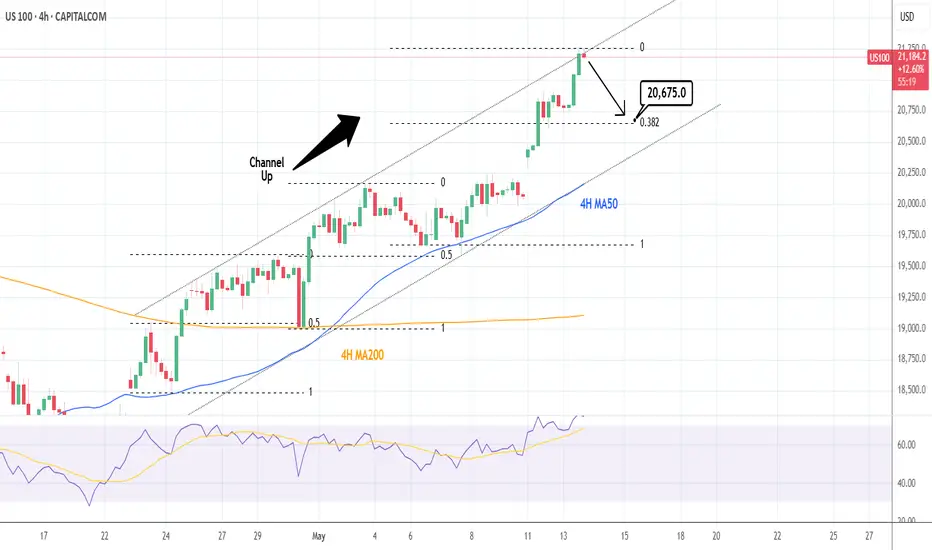
NASDAQ: Time for a 4H technical correction.Nasdaq is almost overbought on its 1D technical outlook (RSI = 69.775, MACD = 371.830, ADX = 37.524) and has reached the top of its 4H Channel Up. The two HH that the pattern has both pulled back to the 0.5 Fibonacci retracement level before the 4H MA50 provided the necessary support for the next bullish wave. Consequently we expect a small correction to at least the 0.382 Fib next (TP = 20,675).
See how our prior idea has worked out:
## If you like our free content follow our profile to get more daily ideas. ##
## Comments and likes are greatly appreciated. ##
Trade Idea: US30 Long (BUY LIMIT)Justification:
Technical Analysis:
1. Daily Chart:
• Strong bullish reversal from recent lows.
• MACD is crossing up sharply, showing fresh bullish momentum.
• RSI at 62.33 — rising but not yet overbought (room to run).
• Price reclaiming key moving averages.
2. 15-Minute Chart:
• Clear uptrend continuation.
• MACD and RSI confirm bullish momentum.
• Price consolidating at recent highs — potential breakout formation.
3. 3-Minute Chart:
• Short-term consolidation near highs with low RSI (38.84) — possible dip-buy opportunity.
• MACD near zero — primed for a new short-term wave.
Fundamental Analysis (as of early May 2025 context):
• Likely market optimism surrounding softer inflation data and potential rate cuts.
• Dow components (industrials, financials) benefit from economic soft-landing expectations.
• VIX (if tracked) remains subdued, confirming risk-on sentiment.
⸻
Trade Plan (Long):
• Entry: 42,360
Near current consolidation zone on lower timeframes.
• Stop Loss (SL): 41,850
Below recent swing lows and key moving average support (approx. 510 pts risk).
• Take Profit (TP): 43,380
Targeting previous resistance area on the Daily chart (approx. 1020 pts reward).
FUSIONMARKETS:US30

The S&P 500 Is About to Drop — The Real Rally Comes in July!S&P 500 Market Outlook: Navigating the Path to a Bullish Breakout by June 2025
At Vital Direction, we are committed to delivering precise and forward-looking market analysis rooted in deep technical expertise. Our current evaluation of the S&P 500 indicates that the recent upward movement is not the beginning of a true bull market. Rather, it reflects a counter-trend rally that is approaching exhaustion. We firmly believe that the market is preparing for a significant decline in the short term, followed by a prolonged sideways consolidation, before initiating a genuine, powerful bull market in late June 2025.
Elliott Wave Analysis: A Classic Counter-Trend Structure
Our Elliott Wave analysis suggests that the S&P 500’s recent rally has been corrective in nature, comprised of only three waves — a classic hallmark of a counter-trend move. This pattern lacks the five-wave impulsive structure typically associated with sustainable bull markets. From our vantage point, this confirms that we remain in a larger corrective phase.
We anticipate that a sharp retracement is imminent, one that may unfold over the coming days and weeks, ultimately transitioning into a period of sideways price action until mid-to-late June 2025. Only thereafter do we foresee the conditions forming for a new all-time high and the emergence of a powerful bull leg.
Gann Theory Timing: Imminent Market Top
Our Gann timing model aligns precisely with this forecast. We have identified this week as a critical timing window for a potential top in the S&P 500. Once this pivot is confirmed, we expect the index to enter a steep downward phase. From a Gann perspective, this is a natural part of the market’s cyclical structure — a necessary clearing phase before the next long-term advance.
US Bond Yields: A Telling Risk-Off Signal
One of the most overlooked — yet crucial — factors supporting our bearish near-term view is the behaviour of US bond yields. Charts clearly show that bond yields are breaking out to new highs, a significant development that suggests institutional and “smart money” investors are positioning defensively. This is not a characteristic of a “risk-on” environment.
When yields rise, particularly amidst equity euphoria, it typically indicates that investors are seeking safety and yield rather than embracing equity risk. This divergence is a red flag that supports our conviction: the equity rally is unsustainable, and a meaningful correction is near.
Seasonality Supports the Retracement View
Historical seasonality trends for the S&P 500 further validate our analysis. Data indicates the following typical market behaviour:
Mid-May to Late May: Downtrend
Late May to Mid-June: Temporary uptrend
Mid-June to Late June: Another corrective phase
From Late June Onward: Start of the next major bullish cycle
This seasonal rhythm perfectly mirrors what we see technically: the market is preparing to reset before beginning a strong ascent in July 2025, building into a full-fledged bull market by late June.
The Broader Picture: Beyond US-China
While some market optimism has emerged on the back of renewed US-China tariff discussions, we caution against over-reliance on this narrative. The market appears to be ignoring the broader geopolitical context, including the absence of any clear tariff agreements between the US and Japan — another major global economic player.
The complexity of global trade negotiations introduces substantial uncertainty, which may continue to weigh on investor confidence. Until such macroeconomic factors are stabilised and digested by the market, we do not anticipate a truly risk-on environment.
The Road Ahead: A Strategic Pause Before Ascent
In conclusion, Vital Direction maintains its firm stance: the current market structure does not yet support the onset of a sustained bull market. A meaningful retracement is necessary and, indeed, healthy for the long-term health of the market. We expect this corrective period to unfold over the coming weeks and months, culminating in a sideways consolidation until late June 2025 — the point at which we foresee the S&P 500 transitioning into a highly bullish environment, with the potential to reach new all-time highs.
We will continue to monitor the technicals, macroeconomic developments, and global capital flows to provide our clients with the most accurate and actionable insights. The bull is coming — just not yet.

Lesson 12: NasDaq100 Price Consolidation and Breakout Zone NasDaq price action analysis on consolidation zone. Using a break-out strategy, we waited for price to consolidate ( $20,755-$20,812.30 zone) on the 15min timeframe to breakout at $20,812.30 for our indication, correction and bullish price continuation, targeting price at $20,888.50. Price closed above $20,888.50 (resistance) thus we hold profits until we see price reversal.

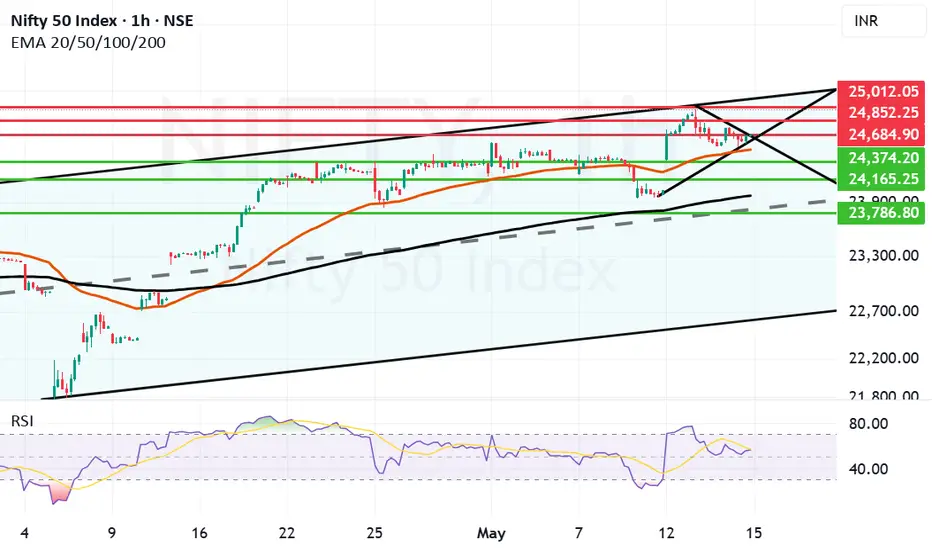
Volatile day where Mother line gave support to NiftyIt was a volatile day on browsers where Mother line of hourly chart gave support to Nifty and helped it close in Green. after opening in Green Nifty and making a high of 24767 Nifty saw selling pressure which took it to as low as 24535 losing over 232 points. There Nifty found the support of Mother line and rose 141 points closing at 24666 which is 88 points hig from yesterdays close. Further volatility cant be ruled out as Nifty is facing the resistance of the trend line at 24684. If this level is crossed Nifty can find further resistance at 24852 and 25012. 25012 seems to be a Channel top resistance which will be little difficult to cross. Supports for Nifty remain at 24505 (Mother Line Support), 24374, 24165 and 23979 (Father Line Support). If Father line support is broken by chance bears can drag Nifty further down to 23786 levels. Around this zone we will also have mid channel support of the parallel channel. Thigs are delicately poised with positive shadow of the candle.
Disclaimer: The above information is provided for educational purpose, analysis and paper trading only. Please don't treat this as a buy or sell recommendation for the stock or index. The Techno-Funda analysis is based on data that is more than 3 months old. Supports and Resistances are determined by historic past peaks and Valley in the chart. Many other indicators and patterns like EMA, RSI, MACD, Volumes, Fibonacci, parallel channel etc. use historic data which is 3 months or older cyclical points. There is no guarantee they will work in future as markets are highly volatile and swings in prices are also due to macro and micro factors based on actions taken by the company as well as region and global events. Equity investment is subject to risks. I or my clients or family members might have positions in the stocks that we mention in our educational posts. We will not be responsible for any Profit or loss that may occur due to any financial decision taken based on any data provided in this message. Do consult your investment advisor before taking any financial decisions. Stop losses should be an important part of any investment in equity.
DXY - market structure - ADAPT to the marketDXY - market structure - ADAPT to the market , use risk and trade managment, is about risk managment and discipline
Correction and a push up US30 has been gradually climbing but this growth may have to correct a bit before continuing up. After reaching the 41,800 gap, the indice rose a bit, but may have ran out of steam to further go up. The nearest support will be the likely area where the indice may find buying pressure, if price action remains above the support barriers.

Nifty 50Current Price: 24039.35
Mid-Point: 24106.65
Upside: 24487.28 & 25141.85 & 25918.25
Downside: 23728.61 & 23071.45 & 22295.05

Nifty levels - May 15, 2025Nifty support and resistance levels are valuable tools for making informed trading decisions, specifically when combined with the analysis of 5-minute timeframe candlesticks and VWAP. By closely monitoring these levels and observing the price movements within this timeframe, traders can enhance the accuracy of their entry and exit points. It is important to bear in mind that support and resistance levels are not fixed, and they can change over time as market conditions evolve.
The dashed lines on the chart indicate the reaction levels, serving as additional points of significance to consider. Furthermore, take note of the response at the levels of the High, Low, and Close values from the day prior.
We hope you find this information beneficial in your trading endeavors.
* If you found the idea appealing, kindly tap the Boost icon located below the chart. We encourage you to share your thoughts and comments regarding it.
Wishing you success in your trading activities!

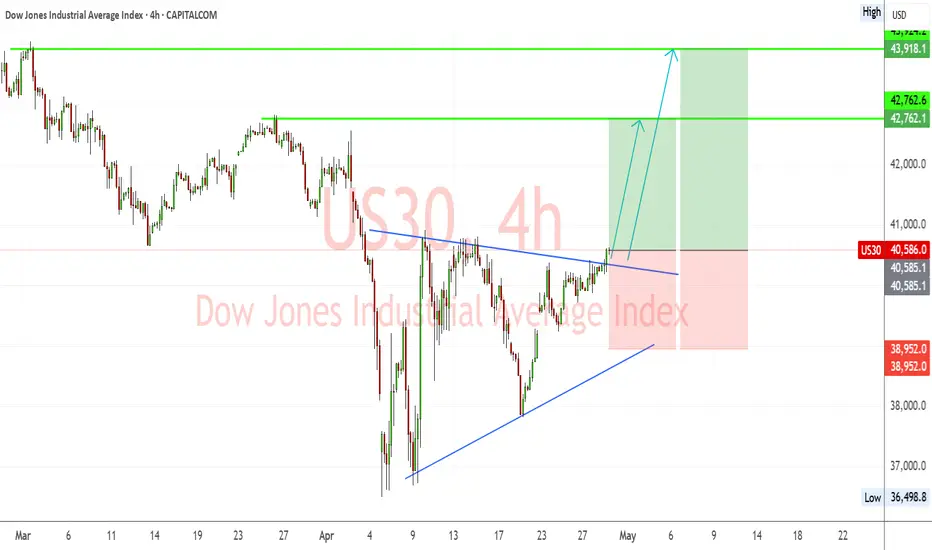
US30 Breakout from Symmetrical Triangle – Bullish Targets EyedUS30 (Dow Jones) has successfully broken out of a symmetrical triangle consolidation pattern, signaling a shift toward bullish momentum. The breakout is occurring after a strong recovery from April lows, with higher lows supporting upward price pressure.
🔹 Chart Structure:
Symmetrical triangle with a clean breakout above descending resistance.
Series of higher lows indicating accumulation.
Bullish breakout confirmed with price pushing above the 40,580 zone.
🔑 Key Levels:
Current Price: 40,586
Breakout Confirmation Level: 40,580
Immediate Resistance/TP1: 42,762
Major Resistance/TP2: 43,924
Support Zone: 38,950
Invalidation/Stop Level: Below 38,950
✅ Bullish Confluence Factors:
Breakout of symmetrical triangle pattern
Higher lows indicate bullish strength and accumulation
Momentum shift visible on lower timeframes
Positive correlation with improving US equity market sentiment
Anticipation of dovish Fed tone could boost equities
🧠 Fundamental Context:
Market is cautiously optimistic ahead of FOMC this week; dovish stance expected due to recent soft economic indicators.
Earnings season tailwinds and lower bond yields support index gains.
Ongoing political and tariff-related headlines may cause volatility, but technical breakout remains in focus.
💡 Trade Idea:
Bias: Bullish
Entry: On successful retest of 40,580 or continuation above 40,600
TP1: 42,762
TP2: 43,924
Stop Loss: Below 38,950
📌 Note: Watch for pullbacks to triangle resistance-turned-support. FOMC and US macro data releases midweek can impact momentum.
DAX40 INTRADAY uptrend supported at 23300The DAX index remains in a long-term uptrend, reflecting a bullish overall sentiment. However, recent price action shows consolidation, with the index trading sideways after earlier gains.
The key support level is at 23,300, which marks the lower boundary of the recent trading range. If the index pulls back and holds above this level, it would suggest continued bullish momentum. A rebound from 23,300 could see the DAX pushing toward resistance levels at 23,990, then 24,200, and potentially 24,450 in the longer term.
On the downside, a confirmed break and daily close below 23,300 would weaken the bullish case. This would open the door for further declines, with the next support at 23,060, followed by a deeper retracement toward 22,615.
Conclusion:
The DAX outlook remains bullish while holding above 23,300. A bounce from this level supports a move higher, but a break below it would shift the outlook to bearish in the short term.
This communication is for informational purposes only and should not be viewed as any form of recommendation as to a particular course of action or as investment advice. It is not intended as an offer or solicitation for the purchase or sale of any financial instrument or as an official confirmation of any transaction. Opinions, estimates and assumptions expressed herein are made as of the date of this communication and are subject to change without notice. This communication has been prepared based upon information, including market prices, data and other information, believed to be reliable; however, Trade Nation does not warrant its completeness or accuracy. All market prices and market data contained in or attached to this communication are indicative and subject to change without notice.

USD overstretched to the downside as traders eye US retail salesApril retail sales data is scheduled to be released at 12:30 pm GMT tomorrow and will be a closely watched report as investors seek signs of any impact derived from tariffs, as well as potential future rate cuts by the US Federal Reserve (Fed).
According to LSEG Data and Analytics, economists expect retail sales to have stagnated, following a 1.5% gain in March – the largest one-month surge since the start of 2023; the estimate range is between a high of 0.4% and a low of -0.6%. Excluding autos, retail sales are anticipated to have cooled to 0.3%, down from March’s reading of 0.5%; however, estimates range from a high of 0.7% to a low of -0.5%.
Hard data is yet to follow soft data
Heading into the event, we are aware that soft data demonstrate a soft economy, which includes consumer and business sentiment surveys. In contrast, hard data has yet to follow suit and remains reasonably robust.
You will recall that CPI inflation data (Consumer Price Index) came in lower-than-expected in April, providing a modest shot in the arm for risk assets. Should retail sales come in stronger-than-anticipated, this could fan the fire and fuel the risk rally.
The April jobs report revealed that the US economy added 177,000 new payrolls according to the establishment survey. Consisting of 167,000 new private jobs and 10,000 government roles, this defied the market’s median estimate of 130,000, though it was lower than March’s downwardly revised reading of 185,000. According to the household survey, the population increased by 174,000, and the labour force grew by 518,000, resulting in a 0.1 percentage point increase in the labour force participation rate to 62.6%. As expected, the unemployment rate held steady at 4.2%, while average hourly earnings rose by less-than-expected on both a month-on-month and year-on-year basis, increasing by 0.2% (down from the 0.3% estimate) and 3.8% (down from 3.9% expected), respectively.
On the growth side, real GDP (Gross Domestic Product) – that is, economic activity adjusted for inflation – fell to an annualised rate of 0.3% in Q1 25. However, to clarify, this is the first estimate; there are three monthly estimates to complete the quarter, with the next being the preliminary and then the final print. According to the Bureau of Economic Analysis, the slowdown in growth was largely due to increased demand for imports. Nevertheless, according to the Atlanta Fed's GDPNow latest estimate (May 8), real GDP is now expected to grow at an annualised pace of 2.3% in Q2 2025.
USD Unwind?
According to the Commitment of Traders report (COT), the US dollar (USD) is overstretched to the downside, and the Citigroup Economic Surprise Index has been largely subdued, indicating that hard data has yet to be impacted by global trade tensions. This, coupled with the Fed in ‘wait-and-see’ mode and positive sentiment fuelling USD bids following the temporary US-China trade truce announced earlier this week, leads me to remain of the view that there is a solid backdrop for a higher USD. Consequently, my preference heading into the event would be to look for a beat in the data and possible long opportunities.
The USD index remains at monthly support at 99.67, but is struggling to overthrow the 50-month simple moving average (SMA) at 102.05, as well as daily resistance from 101.92/50-day SMA. As you can see from the charts below, daily support is now in play at 100.54, and, ultimately, I am looking for this level, along with the 38.2% Fibonacci retracement ratio at 100.45, to hold ground.
Written by FP Markets Chief Market Analyst Aaron Hill
.
