WC: 27.48 Target: 1800-2400 MOASS: 47k-100K: GAMESTOP DECODEDThis video tells you EXACTLY what's happening with Gamestop and EXACTLY when PRICE will explode
AS FOR ME...I LOVE THE STOCK

GOOGL daily resistance test w H&S 15m h&s right on a daily area of interest for GOOGL. price has moved sideways afterwards. new 15m lower close confirmation for puts


Baba waking up after 3 years accumuationMonthly
VRVP indicate huge multiyear volume accumulation
Need to close monthly May candle above last month's high
Weekly
Expecting green continuation candles (good thing that each weekly candle is making a higher high each) as low is probably in with that weekly reversal candle and volume spike
Medium term target 200
300 in the cards along with monthly target RSI 70, but let's see if it goes through 200 without any major reversal candle

A New Beginning AMC’s story is far from over! From where I’m standing, the stock is simmering in an accumulation zone, quietly building momentum like a sleeping giant ready to roar. Are these rock-bottom prices at $2.68 the last we’ll see before this titan wakes? What’s the vibe from your side of the street? Drop your take below! #AMC #ToTheMoon

$MSTR regretting the missed shortJust steadily up the last month. Reversal candles coming in. Wish I had puts. I’m an idiot. Retrace to $350-$360.

Googl at pivotGoogl is at a pivot point here touching historic levels from 2021. The company is a cash flowing machine and FUD has taken control at this point. The market forgets that the company is diversifying away from search as a business. The market forgets about youtube, waymo, and recent wiz acquisition. Stocks bottom on bad news, not good news. I think we see 200$ soon. Double bottom is apparent to me.

TESLA: Bearish Continuation & Short Signal
TESLA
- Classic bearish formation
- Our team expects fall
SUGGESTED TRADE:
Swing Trade
Sell TESLA
Entry Level - 287.25
Sl - 299.67
Tp - 259.90
Our Risk - 1%
Start protection of your profits from lower levels
Disclosure: I am part of Trade Nation's Influencer program and receive a monthly fee for using their TradingView charts in my analysis.
❤️ Please, support our work with like & comment! ❤️

NVDA LongJust checked this stock which seems very good trade for now. With a flow of good news for the past week about the trade war between China and USA, there is a good possibility for a long trade in here. Also technically, a downtrend line has been broken, and liquidity got swept, so i cant see anything in the way of a long trade in here.
See this marked blue line, thats a down trend that got broken. Now i would be looking for this small gap to be filled and the price testing the downtrend.
Confirm on lower tf if the price would hold this trendline and wont go below it, then make an entry.

TeslaFor the first time in Tesla's history, it broke monthly support back in Dec 22. Price came back to mitigate the supply level...and if I am right...just maybe...Tesla is within a distribution range...

TSLA: Big Cup & Handle? Over $300 Soon?Big cup and handle? I feel like NASDAQ:TSLA has so much potential here. Ready for a break out of this handle.
I have long calls for 5/16.
Looking for over 295 to possibly 300? Then big move to $324?

Netflix is going to fall sharply soonNetflix is in the huge 5th wave extension. I expect it to complete wave (v) of 5 very soon, probably within the next week.
RSI divergence on 3-days, weekly frames is quite visible and supports the upcoming trend reversal.
When wave 5 is extended, retracement typically goes to the bottom of wave (ii) of this 5th wave. This would mean 1180-1195 USD to end the wave 5. Also, at this price wave 5 will be 2.168 times bigger than waves 1 and 3 together.

TSLA Technical Analysis🚀 TSLA Long-Term Buy Setup (Educational Trade Idea)
I’ve entered a long position on Tesla (TSLA) at $246.57 based on a clear technical breakout from a downtrend and consolidation pattern.
✅ Target: $487.66
❌ Stop Loss: $209.36
📊 Risk-Reward Ratio: 1:6.58 — extremely favorable setup
Price action shows a textbook breakout from accumulation, followed by bullish structure. This move aligns with the Smart Money Concept — entering after accumulation, not during uncertainty.
🕒 This is a long-term swing trade, meaning it could take weeks or months to fully develop.
⚠️ Disclaimer: This is not financial advice, but an educational breakdown for learning purposes. Always manage your own risk and do your own analysis before trading.

Pltr $151 🧠 Palantir Bull Thesis: $136–$150 Short-Term Target (Post-Earnings)
Price Target Range:
Base Target: $136
Stretch Target: $150 (if momentum breakout + macro align)
Catalyst 1: AI/Defense Earnings Blowout
Expected EPS: $0.13 → if actual EPS surprises (e.g., $0.15+), it signals significant operating leverage from AI/Foundry.
Recent Government Deals: NATO, U.S. military, and foreign defense contracts bolster revenue visibility.
Commercial Growth Spike: Analysts expect over 60% YoY growth in commercial sector revenue — if confirmed, valuation multiple expansion becomes justified.
Catalyst 2:
Cup & Handle breakout formed over the last 6 weeks
Break above $124 (previous high) triggers bullish continuation
RSI is resetting from mid-60s — giving room for a momentum ignition
Golden cross: 50EMA crossing above 200EMA last week
📊 If earnings gap the stock above $128, short-covering + AI momentum chase can push a rapid breakout to $136–$150.
Catalyst 3: Options Flow + IV Crush Setup
Implied Volatility > 95% pre-earnings → massive call open interest buildup at $130–$150
Call/Put ratio above 2.3 (bullish skew)
If IV collapses post-earnings and the move is directional, market makers will need to hedge deep OTM calls → gamma squeeze potential
Catalyst 4: Sentiment + Social/Institutional Attention
Palantir trending on Reddit, Twitter, and TikTok
Citadel and BlackRock increased positions in Q1
High institutional ownership (~40%) with increasing fund inflows into AI/Defense names
Quantum Forecast & AI Narrative Momentum
AI stocks (NVDA, SMCI) have led market-wide rallies
Palantir being seen as the “AI software layer for government + enterprise”
CEO Alex Karp has already hinted at "transformational government contracts" and new AI modules — this creates anticipation buying even before guidance is raised
Risk-Reward Snapshot
Case Price Range Probability
Base Bull Case $136 55%
Stretch Case (Gamma Squeeze + Beat + Upgraded Guidance) $150+ 30%
Neutral Post-Earnings Drift $118–124 15%
Risk Factors:
Market-wide risk-off event (Fed, macro surprise)
AI rotation cools off
EPS beats but guidance disappoints
IV crush limits upside unless price gaps violently
If Palantir beats EPS by >15%, raises guidance, and gaps over $128 post-earnings, a momentum/gamma squeeze could push it toward $136–$150, fueled by AI mania, defense exposure, and short positioning.
Want a matching chart or visual post for this thesis?
as always safe Trades

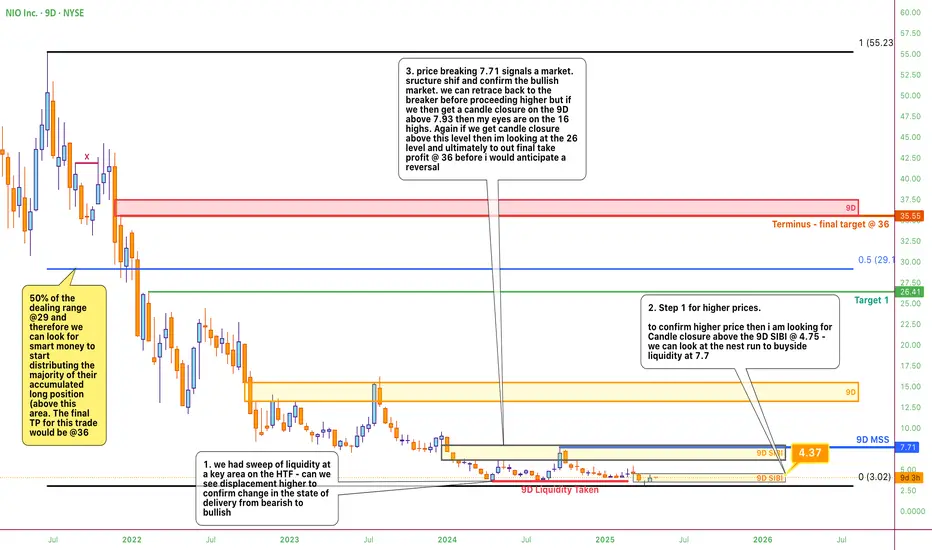
NIO - Beyond the confusion, the road to success is clear this simple charts aims to simplify what to look for in higher NIO prices.
APPLE Set To Grow! BUY!
My dear friends,
Please, find my technical outlook for APPLE below:
The price is coiling around a solid key level - 205.25
Bias - Bullish
Technical Indicators: Pivot Points High anticipates a potential price reversal.
Super trend shows a clear buy, giving a perfect indicators' convergence.
Goal - 208.36
About Used Indicators:
The pivot point itself is simply the average of the high, low and closing prices from the previous trading day.
Disclosure: I am part of Trade Nation's Influencer program and receive a monthly fee for using their TradingView charts in my analysis.
———————————
WISH YOU ALL LUCK

Take - Two Interactive SoftwareIn this idea, I will analyze the current situation of TTWO and continue the analysis I previously carried out ( ).
Following everything that was mentioned in the previous idea, it has been said that GTA VI will only be released on May 26, 2026 (something that can only be confirmed with 100% certainty on that day).
This same news delayed, to some extent, the upward trend that could have occurred with the release of the game (GTA VI) and its sales this year.
Of course, this company doesn't rely solely on GTA, and I believe that with the release of other games, the company will continue its upward trend. However, I think that with the sales of GTA VI, there will be a strong bullish trend in 2026.
This is a long-term analysis, which should also be accompanied by solid fundamental analysis.
The long position tool shown on the chart serves only as a support for the trade entry.
Several moving averages and a Parabolic SAR were also used in this analysis, to which special attention should be given.

TSLA technically turntUP... so the stock pops on a sob story. there will be action. pullback possible, but doesn't have to. 2-3 week rallies expected while the getting is good.
*weekly bullish close (engulfing)
*pullbacks should not be lower than prev week high (270 good)
*it's big tech earnings, so running during other strong tech success while down is a TSLA thing
tootles

TSLA Drill Team is Back
Against the background of everything that is happening, from a fundamental point of view, Tesla is facing significant headwinds as we approach its Q1 2025 earnings.
A 13% year-over-year decline in deliveries, ongoing margin pressures from price cuts, and negative consumer sentiment tied to Elon Musk’s political involvement are weighing on the company.
While the energy segment and potential updates on the affordable vehicle could provide some upside, the risk of a disappointing earnings report looms large, potentially exacerbating Tesla’s challenges in a competitive EV market.
Technically
We see that the price is consolidating near the lower boundary of the golden pocket on the FIBO channel on the 1-hour chart. For a few days now, the price has been holding just above the 240.00 support level, but the bearish trend remains dominant with 23 out of 26 technical indicators signaling bearish sentiment as of April 20, 2025.
Entry SHORT around 240$ targeting 220$
Post-earnings, we could see a breakdown below 220.00, targeting the next support at 216.00, from which the future prospects will depend.
Resistance levels: 270, 250, 240
Support levels: 220, 216, 210
The price is struggling to break above the resistance, consolidating over days. With earnings on Tuesday, there’s a high probability of a breakdown if the report misses expectations or lacks clear guidance on growth initiatives.
A break and consolidation below 230.00 could lead to a decline toward 220.00 or even 210.00 in the coming week.
However, if Tesla surprises positively—particularly with strong energy segment growth or clarity on the affordable vehicle—we might see a reversal. Still, the current setup suggests caution, and we’ll need to monitor the price reaction closely post-earnings.
Keep your long term vision NASDAQ:TSLA

Tesla (TSLA) 4-Hour Chart Analysis: BBofVWAP Strategy in ActionTesla Inc. (TSLA) has been gaining strong momentum lately, and on the 4-hour chart, my BBofVWAP strategy has shown a notable signal. In this post, I’ll walk through how this custom strategy works and what the latest price action could mean for traders.
🔍 What is the BBofVWAP Strategy?
The BBofVWAP (Bollinger Bands of VWAP) strategy I use combines two powerful tools:
VWAP (Volume-Weighted Average Price) – to anchor the trade bias
Bollinger Bands – to track volatility and determine key exit points
Here’s how it works:
✅ Entry Point: When VWAP crosses above the Pivot Point and stays within the Bollinger Bands.
💡 Exit Condition: VWAP crossing below the lower Bollinger Band signals an exit.
💰 Profit Booking:
Partial profits are taken near R3 resistance level
Or when the price drops below the upper Bollinger Band
This method filters out noise and rides trends effectively while maintaining solid risk management.
📊 Current TSLA Chart Insight (4h)
In the current 4-hour setup:
We entered the trade at a pivot breakout (highlighted with a blue arrow on the chart).
VWAP continued to trade within the Bollinger Bands, keeping the position alive.
Price has climbed toward $287.25 and is hovering near key resistance levels.
R3 (328.92) acts as a potential profit-taking zone.
If VWAP crosses under the lower band, we’ll be out – clean and disciplined.
📌 Why This Strategy Works
🎯 Clear rules-based system for entries and exits
📉 Eliminates emotional decision-making
⚖️ Balances trend-following with mean-reversion logic
🔁 Works well across large-cap, high-volume stocks like TSLA
🧠 Final Thoughts on TSLA Setup
Tesla’s recent strength, combined with this BBofVWAP setup, gives a bullish but cautiously managed outlook. As always, managing risk with technical levels like VWAP, Pivot Points, and Bollinger Bands provides a more structured approach to volatile tickers.

TESLA Trading Opportunity! SELL!
My dear followers,
This is my opinion on the TESLA next move:
The asset is approaching an important pivot point 287.25
Bias - Bearish
Technical Indicators: Supper Trend generates a clear short signal while Pivot Point HL is currently determining the overall Bearish trend of the market.
Goal - 262.50
About Used Indicators:
For more efficient signals, super-trend is used in combination with other indicators like Pivot Points.
Disclosure: I am part of Trade Nation's Influencer program and receive a monthly fee for using their TradingView charts in my analysis.
———————————
WISH YOU ALL LUCK

Market appears supportive of Tesla's growth prospects**Direction:** **LONG**
**LONG Targets:**
- **T1 = $287.50**
- **T2 = $295.25**
**Stop Levels:**
- **S1 = $275.00**
- **S2 = $268.75**
---
**Wisdom of Professional Traders:**
This analysis synthesizes insights from thousands of professional traders and market experts, leveraging collective intelligence to identify high-probability trade setups. The wisdom of crowds principle suggests that aggregated market perspectives from experienced professionals often outperform individual forecasts, reducing cognitive biases and highlighting consensus opportunities in Tesla.
**Key Insights:**
Tesla continues to dominate the EV sector with substantial global market share and expanding demand across multiple territories. It has consistently outperformed competitors by innovating battery technologies and ramping up production capabilities. Recent improvements in cost efficiency and scaling production have reinforced positive outlooks from traders. Key focus areas include Tesla's development of its 4680 battery production and advancements in energy generation/storage, further suggesting a long-term competitive edge.
The broader market appears supportive of Tesla's growth prospects, particularly with EV subsidies and green energy initiatives in major economic regions. Tesla's brand recognition and consistent product releases continue to draw consumer attention, while strategic efforts like the buildout of gigafactories globally are seen as favorable catalysts for sustained revenue expansion.
**Recent Performance:**
Over the last week, TSLA has displayed steady consolidation and formed a strong technical base approximately near $280. This stability follows a significant bullish rally earlier in the month, and the stock now appears poised for a continuation to test resistance levels. Technical indicators such as the Relative Strength Index (RSI) remain within neutral-to-positive territory, while moving averages support the potential for upward trajectory amidst firm buying support.
**Expert Analysis:**
Analysts broadly expect Tesla to capitalize further on its technological leadership in the automotive market. Hedge funds and institutional investors have shown significant interest in maintaining long positions on Tesla due to growth-driven profitability and aggressive expansion. Experts view Tesla's ability to scale its production and integrate advanced AI technologies into the manufacturing process as differentiating factors in the industry.
Tesla's Q3 production and delivery targets have received favorable feedback, aligning with expectations of robust growth narratives. If global macroeconomic pressures ease, Tesla could benefit further from optimistic market dynamics, broadening its appeal among investors.
**News Impact:**
Tesla's recent progress in scaling production at its factories and updates on the highly anticipated Cybertruck have sparked renewed confidence in the company's product lineup and potential market penetration. News regarding expansions into new territories coupled with strategic collaborations in energy storage solutions bodes well for long-term growth. Positive sentiment in this area tends to support the general bullish narrative among professional traders and market participants.
**Trading Recommendation:**
Tesla exhibits strong fundamentals and resilient technical qualities conducive to a long play this week. Professional trader consensus supports a bullish stance, further backed by favorable news impacts and sustained market demand for Tesla vehicles and innovations. Maintaining stops near broader support levels while aiming for gradual upward price targets is recommended to balance risk and reward. Consider this a solid long opportunity for near-term price advancements.

Buffett Steps Down, Berkshire Shares Pull Back from Record HighBuffett Steps Down, Berkshire Shares (BRK.B) Pull Back from Record High
Berkshire Hathaway has released its quarterly report, which came in slightly below analysts’ expectations:
→ Earnings per share: actual = $4.46, forecast = $4.72
→ Revenue: actual = $90.8bn, forecast = $89.7bn
However, the bigger news was not the weaker results, but the decision of legendary 94-year-old Warren Buffett to step down as head of the company after nearly 60 years in charge. According to Reuters:
→ Vice Chairman Greg Abel will take over leadership;
→ Buffett will still influence decisions and has said he does “not intend to sell a single share of Berkshire”.
In pre-market trading today, BRK.B shares are priced around $526, compared to Friday’s close above $541, which marked a historic high. The decline suggests a natural negative reaction by market participants to the news.
Technical Analysis of BRK.B Stock Price
The Berkshire Hathaway stock price is moving within an upward channel, and:
→ In 2025, it has outperformed the broader equity index, showing a strong recovery following the early April market selloff;
→ Following the recent news, the price will likely retreat from the upper boundary of the channel toward the median line, which may act as support (as it did in late April, as shown by the arrow).
The recent price action appears to be a false bullish breakout above the $535 resistance — a bearish signal.
It’s possible that the initial emotional market reaction may fade, and BRK.B shares could continue to outperform the S&P 500 (tracked via the US SPX 500 mini on FXOpen). Whether this scenario plays out will depend on the leadership and decisions of Greg Abel, especially as the company now holds a record cash reserve of nearly $350 billion.
This article represents the opinion of the Companies operating under the FXOpen brand only. It is not to be construed as an offer, solicitation, or recommendation with respect to products and services provided by the Companies operating under the FXOpen brand, nor is it to be considered financial advice.
