MSFT futurethis is fundamental for msft for showing how correlative analysis' works. if this breaks then tesla is a long and so is the SPY and QQQ

Take - Two Interactive SoftwareIn this idea, I will analyze the current situation of TTWO and continue the analysis I previously carried out ( ).
Following everything that was mentioned in the previous idea, it has been said that GTA VI will only be released on May 26, 2026 (something that can only be confirmed with 100% certainty on that day).
This same news delayed, to some extent, the upward trend that could have occurred with the release of the game (GTA VI) and its sales this year.
Of course, this company doesn't rely solely on GTA, and I believe that with the release of other games, the company will continue its upward trend. However, I think that with the sales of GTA VI, there will be a strong bullish trend in 2026.
This is a long-term analysis, which should also be accompanied by solid fundamental analysis.
The long position tool shown on the chart serves only as a support for the trade entry.
Several moving averages and a Parabolic SAR were also used in this analysis, to which special attention should be given.

TSLA technically turntUP... so the stock pops on a sob story. there will be action. pullback possible, but doesn't have to. 2-3 week rallies expected while the getting is good.
*weekly bullish close (engulfing)
*pullbacks should not be lower than prev week high (270 good)
*it's big tech earnings, so running during other strong tech success while down is a TSLA thing
tootles

$MSFT Tradespoon – Long Entry $393.41Tradespoon model generated long signal for Microsoft ( NASDAQ:MSFT ) . Predicted range: $393.41–$425.40. Trend: +4.28%. NASDAQ:MSFT

TSLA Technical Analysis🚀 TSLA Long-Term Buy Setup (Educational Trade Idea)
I’ve entered a long position on Tesla (TSLA) at $246.57 based on a clear technical breakout from a downtrend and consolidation pattern.
✅ Target: $487.66
❌ Stop Loss: $209.36
📊 Risk-Reward Ratio: 1:6.58 — extremely favorable setup
Price action shows a textbook breakout from accumulation, followed by bullish structure. This move aligns with the Smart Money Concept — entering after accumulation, not during uncertainty.
🕒 This is a long-term swing trade, meaning it could take weeks or months to fully develop.
⚠️ Disclaimer: This is not financial advice, but an educational breakdown for learning purposes. Always manage your own risk and do your own analysis before trading.

Tesla (TSLA) 4-Hour Chart Analysis: BBofVWAP Strategy in ActionTesla Inc. (TSLA) has been gaining strong momentum lately, and on the 4-hour chart, my BBofVWAP strategy has shown a notable signal. In this post, I’ll walk through how this custom strategy works and what the latest price action could mean for traders.
🔍 What is the BBofVWAP Strategy?
The BBofVWAP (Bollinger Bands of VWAP) strategy I use combines two powerful tools:
VWAP (Volume-Weighted Average Price) – to anchor the trade bias
Bollinger Bands – to track volatility and determine key exit points
Here’s how it works:
✅ Entry Point: When VWAP crosses above the Pivot Point and stays within the Bollinger Bands.
💡 Exit Condition: VWAP crossing below the lower Bollinger Band signals an exit.
💰 Profit Booking:
Partial profits are taken near R3 resistance level
Or when the price drops below the upper Bollinger Band
This method filters out noise and rides trends effectively while maintaining solid risk management.
📊 Current TSLA Chart Insight (4h)
In the current 4-hour setup:
We entered the trade at a pivot breakout (highlighted with a blue arrow on the chart).
VWAP continued to trade within the Bollinger Bands, keeping the position alive.
Price has climbed toward $287.25 and is hovering near key resistance levels.
R3 (328.92) acts as a potential profit-taking zone.
If VWAP crosses under the lower band, we’ll be out – clean and disciplined.
📌 Why This Strategy Works
🎯 Clear rules-based system for entries and exits
📉 Eliminates emotional decision-making
⚖️ Balances trend-following with mean-reversion logic
🔁 Works well across large-cap, high-volume stocks like TSLA
🧠 Final Thoughts on TSLA Setup
Tesla’s recent strength, combined with this BBofVWAP setup, gives a bullish but cautiously managed outlook. As always, managing risk with technical levels like VWAP, Pivot Points, and Bollinger Bands provides a more structured approach to volatile tickers.

Market appears supportive of Tesla's growth prospects**Direction:** **LONG**
**LONG Targets:**
- **T1 = $287.50**
- **T2 = $295.25**
**Stop Levels:**
- **S1 = $275.00**
- **S2 = $268.75**
---
**Wisdom of Professional Traders:**
This analysis synthesizes insights from thousands of professional traders and market experts, leveraging collective intelligence to identify high-probability trade setups. The wisdom of crowds principle suggests that aggregated market perspectives from experienced professionals often outperform individual forecasts, reducing cognitive biases and highlighting consensus opportunities in Tesla.
**Key Insights:**
Tesla continues to dominate the EV sector with substantial global market share and expanding demand across multiple territories. It has consistently outperformed competitors by innovating battery technologies and ramping up production capabilities. Recent improvements in cost efficiency and scaling production have reinforced positive outlooks from traders. Key focus areas include Tesla's development of its 4680 battery production and advancements in energy generation/storage, further suggesting a long-term competitive edge.
The broader market appears supportive of Tesla's growth prospects, particularly with EV subsidies and green energy initiatives in major economic regions. Tesla's brand recognition and consistent product releases continue to draw consumer attention, while strategic efforts like the buildout of gigafactories globally are seen as favorable catalysts for sustained revenue expansion.
**Recent Performance:**
Over the last week, TSLA has displayed steady consolidation and formed a strong technical base approximately near $280. This stability follows a significant bullish rally earlier in the month, and the stock now appears poised for a continuation to test resistance levels. Technical indicators such as the Relative Strength Index (RSI) remain within neutral-to-positive territory, while moving averages support the potential for upward trajectory amidst firm buying support.
**Expert Analysis:**
Analysts broadly expect Tesla to capitalize further on its technological leadership in the automotive market. Hedge funds and institutional investors have shown significant interest in maintaining long positions on Tesla due to growth-driven profitability and aggressive expansion. Experts view Tesla's ability to scale its production and integrate advanced AI technologies into the manufacturing process as differentiating factors in the industry.
Tesla's Q3 production and delivery targets have received favorable feedback, aligning with expectations of robust growth narratives. If global macroeconomic pressures ease, Tesla could benefit further from optimistic market dynamics, broadening its appeal among investors.
**News Impact:**
Tesla's recent progress in scaling production at its factories and updates on the highly anticipated Cybertruck have sparked renewed confidence in the company's product lineup and potential market penetration. News regarding expansions into new territories coupled with strategic collaborations in energy storage solutions bodes well for long-term growth. Positive sentiment in this area tends to support the general bullish narrative among professional traders and market participants.
**Trading Recommendation:**
Tesla exhibits strong fundamentals and resilient technical qualities conducive to a long play this week. Professional trader consensus supports a bullish stance, further backed by favorable news impacts and sustained market demand for Tesla vehicles and innovations. Maintaining stops near broader support levels while aiming for gradual upward price targets is recommended to balance risk and reward. Consider this a solid long opportunity for near-term price advancements.

LMT setup super good for a swing right nowLMT
Monthly
Monthly reversal candle with volume spike at the support trendline
Bulls need to May monthly close above last month high
Weekly
VRVP indicate accumulation at the support trendline
Weekly bullish divergence
Conclusion
Good R/R for a swing

TSLA to 370?This is one scenario for the stock, I think this can play. A recovery testing the 0.618 fib level.

Bullish Engulfing at weekly timeframewolfspeed has shown signs of flying high after making a bullish engulfing on the weekly time frame. Bullish engulfing is one of the signs that the price will go higher.

Coinbase UpdatePrice continues to trade sideways. We have already tagged the 1.0, made it in between the 0.382 & 0.5, and have all the required waves in place for a top to be made. Much like Tesla, the only move higher from here in an impulsive wave is an ED. I find it much more likely that a top has already been struck and we have already begun our minor B wave. We could still make another high, but if we do I think it will be minimal and would be as an irregular b wave. Ideally, we will find out what is in store this week.
Once B starts, as of now, I expect price to fall back to the $150-$160's. Like I said, hopefully we start the move lower this week. I imagine minor B will take 2-4 weeks to complete.

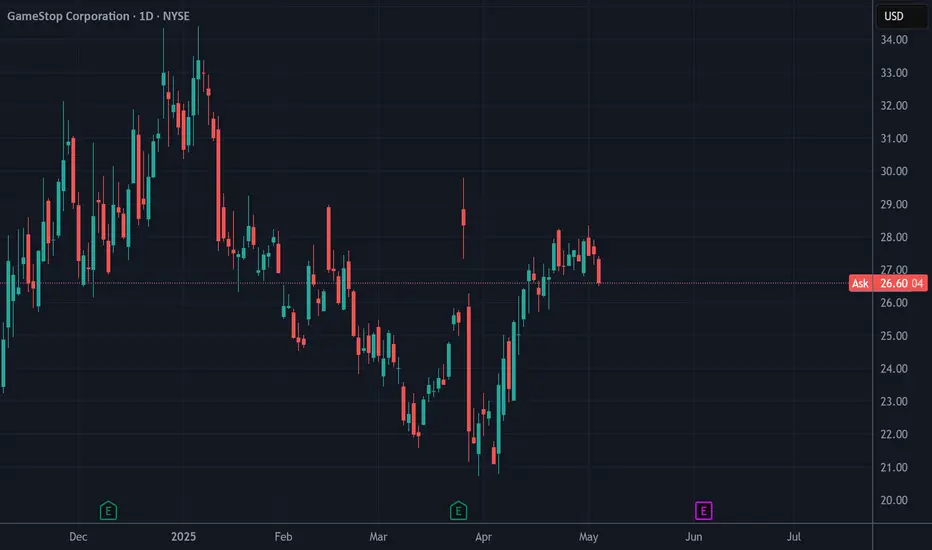
$GME - Late PostingHi guys, sorry i'm a bit late on this post. mMy AI is suggesting that GME will go down from here. Unknown by how much. Just opened a long put position today around this area.
That's all. Thanks.
Visit the Harmonic Museum in the Warren Diamond BuildingThe Diamond Glass Building, home to the Warren Buffett Harmonic Museum, is truly a sight to behold! As you enter, you'll find a fascinating display of creatures.
On the left, there's a charming exhibit featuring a crab vendor that catches the eye.
In the center of the hall, you can marvel at the wild bat, a remarkable fossil that tells a story of the past.
To the right, however, is where things get exciting—a live bloodthirsty shark!
While the crab and bat have been fossilized, the shark is very alive, so be sure to keep your distance and enjoy the view and trade safely.

TSLA daily trading (option)1. Key Level: TSLA was at a risky spot — it hit resistance and has been moving sideways, with about a 50/50 chance of going up or down.
2. Strategy Triggered: It dropped and then retested the 50 SMA on the H1 chart.
3. Pattern Observed: An uptrend breakdown.
➡️ I think TSLA could go up in the long term (next 1–2 weeks), but we might see a red candle tomorrow or Monday

NVDA eyes on $105: Support for one last DIP before new highs?Followup to my warning about $113.56 (click)
NVDA back to the Golden Genesis Fib, a major landmark.
If we are to see one more dip from here, look for $105.08
If we continue then lookout for the Golden Covid at $122.25
.
Big picture view showing the $113.56 Golden Genesis
=======================================================

Is the Golden Arches Losing Its Shine?McDonald's, a global fast-food icon, recently reported its most significant decline in U.S. same-store sales since the peak of the COVID-19 pandemic. The company experienced a 3.6 percent drop in the quarter ending in March, a downturn largely attributed to the economic uncertainty and diminished consumer confidence stemming from President Donald Trump's tariff policies. This performance indicates that the unpredictable nature of the trade war is prompting consumers to curb discretionary spending, directly impacting even seemingly resilient sectors like fast food through reduced customer visits.
The link between sinking consumer sentiment and tangible sales figures is evident, as economic analysts note the conversion of "soft data" (sentiment) into "hard data" (sales). While some commentators suggest that McDonald's price increases have contributed to the sales slump, the timing of the decline aligns closely with a period of heightened tariff-related anxiety and a contraction in the U.S. economy during the first quarter. This suggests that while pricing is a factor, the broader macroeconomic environment shaped by trade tensions plays a critical role.
In response, McDonald's emphasizes value offerings to attract and retain customers navigating a challenging economic landscape. The company's struggles mirror those of other businesses in the hospitality sector, which also report reduced consumer spending on dining out. The situation at McDonald's serves as a clear illustration of how complex trade policies and the resulting economic uncertainty can have far-reaching consequences, affecting diverse industries and altering consumer behavior on a fundamental level.

Plan for yhe next week or two befor quarterly earningsWeekly pre earnings plan.
If you’re already in (or plan to buy this week):
Buy Range: Between $1.26–$1.33 (on dips above 20 SMA).
Stop Loss: Close below $1.13 (or $1.11 if giving more room).
First Target: $1.36–$1.38 breakout.
Second Target: $1.50–$1.60 post-breakout.
If waiting for confirmation:
Only buy on breakout candle above $1.38 with volume > daily average.
Add more if it holds above $1.40 for 1–2 sessions.
Earnings Game Plan (Advanced Prep)
If no breakout before earnings, wait for reaction.
If breakout happens before earnings, either:
Trim partial profits before earnings to reduce risk, or
Hold and use a tight stop (e.g., break-even or below 20 SMA).
Earnings could be the catalyst, so staying flexible is key.
Here’s a breakdown of what the chart is showing:
SMAs:
Red (200 SMA): Clearly acting as long-term support, trending upward.
White (50 SMA): Currently flattening, potentially acting as short-term resistance.
Blue (20 SMA): Curling upward and about to cross above the 50 SMA, which would form your bullish red-white-blue alignment.
Bollinger Bands:
Price touched the upper Bollinger Band and pulled back — a classic resistance point in range-bound or low-volatility setups.
Still holding above the 20 SMA, suggesting strength.
RSI:
RSI is above 50 now (around 50.33), showing neutral to mildly bullish momentum.
The RSI is also crossing above its moving average, another subtle bullish confirmation.
MACD:
MACD line is crossing above the signal line, and the histogram just turned green — a fresh bullish crossover.
While the move is small, it's a constructive signal, especially with price action holding key levels.
What this all means:
Kulr is sitting in a coiled setup:
The SMAs are tightening.
Price is compressing between support (20 SMA) and resistance (50 SMA & Bollinger top).
Momentum indicators (MACD, RSI) are waking up.
A bullish 20/50 crossover is imminent.
This is the kind of setup where a breakout could follow within days. If price closes convincingly above $1.36–$1.38 with volume, it could trigger more buying.

APPLE Set To Grow! BUY!
My dear friends,
Please, find my technical outlook for APPLE below:
The price is coiling around a solid key level - 205.25
Bias - Bullish
Technical Indicators: Pivot Points High anticipates a potential price reversal.
Super trend shows a clear buy, giving a perfect indicators' convergence.
Goal - 208.36
About Used Indicators:
The pivot point itself is simply the average of the high, low and closing prices from the previous trading day.
Disclosure: I am part of Trade Nation's Influencer program and receive a monthly fee for using their TradingView charts in my analysis.
———————————
WISH YOU ALL LUCK

MSTR - Next Wave UpJust made a new high.
That is likely a clue of what happens next with Bitcoin.
It was a running 3 wave 1:0.618 Golden Window correction.
That is a weak ratio and ideal for a continuing uptrend.
But most importantly it was a re-test for support:
That dip buy was there to be gobbled up.
If you didn't see it then this probably goes up and up from here 👍.
Not advice

TSLA Drill Team is Back
Against the background of everything that is happening, from a fundamental point of view, Tesla is facing significant headwinds as we approach its Q1 2025 earnings.
A 13% year-over-year decline in deliveries, ongoing margin pressures from price cuts, and negative consumer sentiment tied to Elon Musk’s political involvement are weighing on the company.
While the energy segment and potential updates on the affordable vehicle could provide some upside, the risk of a disappointing earnings report looms large, potentially exacerbating Tesla’s challenges in a competitive EV market.
Technically
We see that the price is consolidating near the lower boundary of the golden pocket on the FIBO channel on the 1-hour chart. For a few days now, the price has been holding just above the 240.00 support level, but the bearish trend remains dominant with 23 out of 26 technical indicators signaling bearish sentiment as of April 20, 2025.
Entry SHORT around 240$ targeting 220$
Post-earnings, we could see a breakdown below 220.00, targeting the next support at 216.00, from which the future prospects will depend.
Resistance levels: 270, 250, 240
Support levels: 220, 216, 210
The price is struggling to break above the resistance, consolidating over days. With earnings on Tuesday, there’s a high probability of a breakdown if the report misses expectations or lacks clear guidance on growth initiatives.
A break and consolidation below 230.00 could lead to a decline toward 220.00 or even 210.00 in the coming week.
However, if Tesla surprises positively—particularly with strong energy segment growth or clarity on the affordable vehicle—we might see a reversal. Still, the current setup suggests caution, and we’ll need to monitor the price reaction closely post-earnings.
Keep your long term vision NASDAQ:TSLA

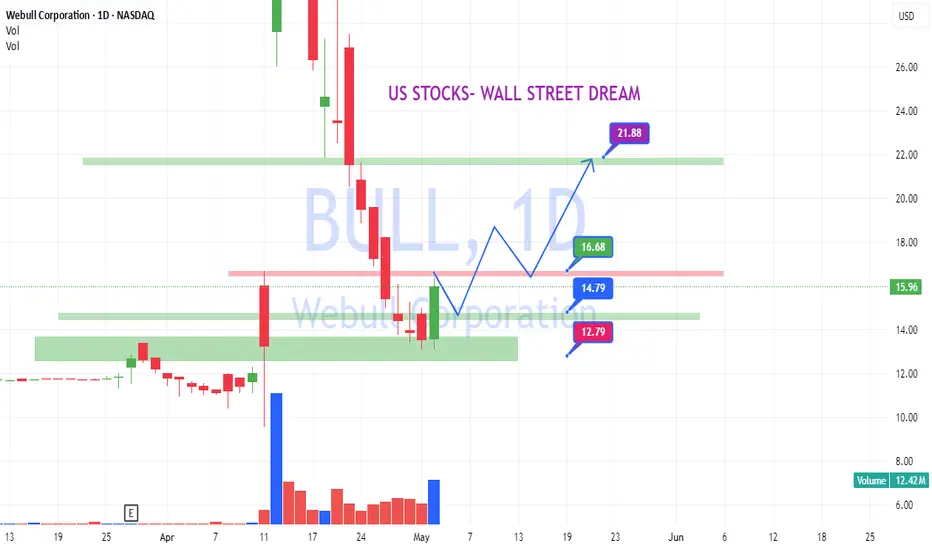
BULL: Ready for a bull run!BULL: Ready for a bulled.
-Demand volume confirmed.
Wait for a backtest with low supply volume and BULL up!
US STOCKS- WALL STREET DREAM- LET'S THE MARKET SPEAK!
Nu Holdings (NU, 1D) — Technical AnalysisNu Holdings (NU, 1D) — Technical Analysis: Trendline Breakout, EMA/MA Confirmation, Recovery Toward Key Levels
On the daily chart, Nu Holdings has broken out of a descending trendline, signaling a potential structural reversal. The breakout was confirmed by a close above key exponential and simple moving averages (EMA 50/100/200), with the EMAs beginning to align in a bullish sequence. The price has held above the critical Fibonacci retracement level at $11.73 (0.618), which now serves as a key demand zone. Volume shows signs of increasing during upward impulses, suggesting accumulation interest. The current recovery structure indicates potential targets at $12.58 (0.5 Fibonacci), followed by $13.42 (0.382) and $14.46 (0.236). A more extended move could lead toward the previous supply zone near $16.15 if momentum persists.
From a fundamental standpoint, Nu Holdings continues to attract investor attention within the fintech sector, especially amid broader rotation back into growth and tech-driven financial platforms. The company's expanding market presence and improving financial metrics may support the current technical setup. As long as the price holds above the broken trendline and maintains strength above the key $11.73 level, the bullish scenario remains in focus with targets pointing toward the $13.42–$14.46 range and potentially higher in the medium term.

APPLE WILL GO UP!Right now, 4th of April I'm standing in APPLE STORE THE GROVE LOS ANGELES
and I'm telling you - the price will turn around ASAP!
That's not financial advice
