Trading Analysis for Microsoft**Current Price:** $387.3
**Direction:** **LONG**
**LONG Targets:**
- **T1 = $395.0**
- **T2 = $405.0**
**Stop Levels:**
- **S1 = $383.0**
- **S2 = $376.0**
---
**Wisdom of Professional Traders:**
This analysis synthesizes insights from thousands of professional traders and market experts, leveraging collective intelligence to identify high-probability trade setups. The wisdom of crowds principle suggests that aggregated market perspectives from experienced professionals often outperform individual forecasts, reducing cognitive biases and highlighting consensus opportunities in Microsoft.
**Key Insights:**
Microsoft is demonstrating robust growth potential, particularly buoyed by its increasing investments in AI infrastructure and cloud computing services. Traders see the stock primed for a continuation of its upward momentum due to growing demand for AI applications across industries and Microsoft’s advancements in integrating AI technology into its product ecosystem. Institutional confidence remains high, with analysts highlighting key drivers such as Azure's market share expansion and strong profitability metrics.
Near-term momentum ahead of earnings is supported by key technical indicators and market sentiment. Resistance at $390 and psychological levels around $400 are being closely monitored by traders. Sustaining movement above these levels could lead to further upside potential that traders are ready to capitalize on.
**Recent Performance:**
Microsoft's stock has been outperforming many peers in the tech sector, consistently trading above its 20-day and 50-day moving averages. This indicates short-term bullish momentum, though it has struggled to break above its 200-day moving average. The consolidation phase observed recently suggests that market participants are awaiting pivotal news such as earnings results to initiate significant directional moves. A notable surge in buying interest has also been seen across its options market, signaling optimism among institutions and retail investors alike.
**Expert Analysis:**
Analysts have been praising Microsoft's execution in fulfilling long-term AI strategies, which could potentially add billions to future revenue streams. Growth in cloud services led by Azure and partnerships with OpenAI further underline the company’s strategic edge in the evolving tech landscape. Technical indicators like RSI and MACD also signal bullish sentiment, with key support levels well-defined at $376 and $383, safeguarding downside risks. Many experts agree that a robust quarterly earnings beat or upward revision of guidance could ignite momentum toward the $405-$413 range.
**News Impact:**
Anticipation is building ahead of Microsoft's earnings announcement, where traders are expecting a strong beat on both revenue and EPS metrics. Positive sector-wide developments in generative AI, alongside broader macro trends benefiting tech, have left investors optimistic about the stock's prospects. Any updates on Microsoft's AI-driven initiatives or its integration into major product lines could significantly impact future share price movements. Additionally, the regulatory environment around AI technologies is being closely monitored as it could influence long-term valuations.
---
**Trading Recommendation:**
Microsoft is well-positioned for long-term bullish momentum, with near-term upside heading into its earnings report. Clear support levels are established at $376 and $383, providing safety nets for traders while resistance levels of $395 and $405 present opportunities for potential gains. This setup aligns with expert analysis and institutional sentiment, making a LONG trade favorable for those seeking an entry point into a high-performing tech giant with strong fundamentals.
```

Trading Analysis for Netflix**Current Price:** $1096.87
**Direction:** **LONG**
**LONG Targets:**
- **T1 = $1150.00**
- **T2 = $1200.00**
**Stop Levels:**
- **S1 = $1070.00**
- **S2 = $1050.00**
---
**Wisdom of Professional Traders:**
This analysis synthesizes insights from thousands of professional traders and market experts, leveraging collective intelligence to identify high-probability trade setups. The wisdom of crowds principle suggests that aggregated market perspectives from experienced professionals often outperform individual forecasts, reducing cognitive biases and highlighting consensus opportunities in Netflix.
**Key Insights:**
Netflix has consistently demonstrated resilience in the streaming sector, maintaining dominance despite fierce competition from rivals such as Disney+, Amazon Prime Video, and emerging platforms. Subscriber growth trends following expansions into new global markets remain pivotal in driving long-term revenue, while strategic investments in original content bolster Netflix's brand strength. Additionally, innovations in ad-supported subscription models may unlock untapped revenue streams, augmenting the company's profitability.
The macroeconomic backdrop, characterized by rising interest rates, inflationary pressures, and potential consumer sentiment shifts, has not deterred Netflix's progress. Instead, the company is proving its adaptability by exploring various monetization strategies and maintaining a healthy level of cash flow, allowing Netflix to weather broader market volatility effectively.
**Recent Performance:**
Netflix shares have experienced a strong rally in recent weeks, highlighting renewed investor confidence. From a medium-term standpoint, the stock notably bounced off critical support levels near the $1,000 mark, confirming positive momentum. This upward trajectory reflects favorable market sentiment, driven by robust earnings reports and strong subscriber retention metrics. While occasional consolidation phases emerged, the overall trend leaned bullish as Netflix delivers a mix of growth and strategic foresight.
**Expert Analysis:**
Technical indicators, including the Relative Strength Index (RSI) and Moving Average Convergence Divergence (MACD), suggest bullish momentum for Netflix. RSI readings hover within comfortable ranges, indicating an upward trajectory without being overbought. The stock is trading above key moving averages, reinforcing positive sentiment. Experts also highlight Netflix's pricing power and ability to retain subscribers amid price hikes, which underscore long-term growth prospects.
Fundamentally, Netflix's revenue diversification strategies, coupled with promising shifts in content economics, provide a solid case for maintaining upward momentum. Analysts anticipate sustained global subscriber growth, particularly in emerging markets, where demand for digital streaming continues to grow.
**News Impact:**
Recent announcements regarding Netflix's advances in franchising popular hits, alongside its increasing push into gaming, further strengthen the company's portfolio diversification. Earnings reports have consistently showcased revenue growth, driven by both increased average revenue per user (ARPU) and sustained subscriber retention. Moreover, the company’s enhanced focus on efficiency and scalable operations has positioned Netflix as a leader not just in content delivery but also in maintaining profitability despite sector-wide economic pressures.
Notably, recent partnerships and potential licensing deals with Hollywood studios underscore Netflix’s commitment to staying ahead in the content game, potentially catalyzing further stock appreciation. Meanwhile, cautiously positive macroeconomic developments contribute additional support for Netflix's outlook.
---
**Trading Recommendation:**
Given the overall bullish sentiment, strong technical performance, robust subscriber growth, and favorable news catalysts, traders could consider a **LONG** position. Netflix remains a dominant force in the streaming landscape, with solid fundamentals and improving technical indicators. Careful positioning with stops below $1050.00 ensures risk management, while targets towards $1150.00 and $1200.00 capitalize on near-term upside potential. This setup suggests an opportunity to benefit from continued Netflix growth while safeguarding against unforeseen volatility.

Trading Analysis for PayPal
**Current Price:** $64.77
**Direction:** **LONG**
**LONG Targets:**
- **T1 = $66.50**
- **T2 = $68.00**
**Stop Levels:**
- **S1 = $62.50**
- **S2 = $60.00**
---
**Wisdom of Professional Traders:**
This analysis synthesizes insights from thousands of professional traders and market experts, leveraging collective intelligence to identify high-probability trade setups. The wisdom of crowds principle suggests that aggregated market perspectives from experienced professionals often outperform individual forecasts, reducing cognitive biases and highlighting consensus opportunities in PayPal.
**Key Insights:**
PayPal is entering a crucial phase ahead of its Q3 earnings report, which is expected to show marginal declines in earnings per share (EPS) to $1.16 and modest revenue growth of 1.8% to $7.84 billion. Despite these challenges, the company continues to maintain stability via its core business model. Traders are keenly watching for updates on metrics such as transaction growth, active accounts, and cost-saving initiatives, as they are crucial to future market sentiment. The stock remains below technical resistance, suggesting price movements are likely to remain in a defined range unless a material catalyst occurs.
**Recent Performance:**
Over the last few months, PayPal has been underperforming relative to the broader tech sector. Weak trading volume and an inability to sustain upward momentum reflect investor concerns regarding competition from emerging fintech players and margin compression. Despite broader tech recovery, PayPal’s growth stock identity has been overshadowed by these concerns, leading to bearish sentiment in its recent price actions.
**Expert Analysis:**
Experts note that PayPal is facing challenges both externally, through macroeconomic pressures, and internally, from difficulties in scaling EPS growth and user engagement. However, its strong position as a key player in digital payments still attracts optimism among institutional investors. Analysts stress the importance of the company’s post-earnings guidance, viewing updates on strategies for boosting active users and enhancing profitability as potentially pivotal for shifting sentiment.
**News Impact:**
The upcoming earnings report places PayPal in the center of a busy week for tech stocks, sharing the spotlight with sector giants such as Meta, Amazon, Visa, and Snap. Sector-wide results may influence PayPal’s performance in the short term. Recent news highlights the increasing competition PayPal faces from both traditional institutions and newer fintech players; however, its ability to innovate and retain market share remains a core focus for investors seeking long-term gains.
---
**Trading Recommendation:**
PayPal’s current price level offers a potential opportunity for a LONG position targeting a recovery to $66.50 and $68.00, assuming earnings and guidance provide a positive surprise. With stop-loss levels defined at $62.50 and $60.00, risk management is key given external macroeconomic challenges and internal operational headwinds. This setup aligns with professional consensus, combining defined upside potential with manageable downside risk.
```

Trading Analysis for Shopify**Current Price:** $95.12
**Direction:** **LONG**
**LONG Targets:**
- **T1 = $98.53**
- **T2 = $102.63**
**Stop Levels:**
- **S1 = $91.57**
- **S2 = $88.57**
---
**Wisdom of Professional Traders:**
This analysis synthesizes insights from thousands of professional traders and market experts, leveraging collective intelligence to identify high-probability trade setups. The wisdom of crowds principle suggests that aggregated market perspectives from experienced professionals often outperform individual forecasts, reducing cognitive biases and highlighting consensus opportunities in Shopify.
**Key Insights:**
Shopify remains a pivotal leader in the e-commerce sector, benefiting from ongoing consumer preference for online shopping. Its robust payment systems and seamless integrations enable merchants to capture larger transaction values, increasing customer retention and loyalty. Recent expansions into mobile commerce further solidify its position as an innovator in the tech-driven retail landscape. The growth in secure credit-card transactions aligns perfectly with Shopify’s business model, underpinning its growth trajectory. Additionally, Shopify benefits from increasing demand for direct-to-consumer channels, providing it with an unparalleled advantage over traditional retail solutions.
**Recent Performance:**
Shopify’s market price has exhibited stability in recent weeks, consolidating around key support levels. The steady inflow of transactions suggests consistent demand for its platform, which is critical for maintaining growth momentum. While broader technology stocks have seen volatility, Shopify’s alignment with scalable e-commerce trends has positioned it as a relative outperformer in the sector. Recent pricing indicates resilience to external macroeconomic pressures, further emphasizing traders’ confidence in the stock’s upside potential.
**Expert Analysis:**
Analysts remain bullish regarding Shopify’s long-term outlook, citing strong fundamentals and sustained revenue growth. The company’s ability to adapt and align with emerging trends like AI-driven shopping experiences and direct-to-consumer ecosystems offers significant upside. Technical analysis highlights critical support levels holding firm, while the current chart patterns suggest potential breakout opportunities toward higher price targets. Experts also note Shopify’s impressive merchant retention rates and continuous investment in innovative tools as differentiators within the e-commerce space.
**News Impact:**
While there were no major recent headlines directly impacting Shopify, the ongoing rise in e-commerce adoption plays a key role in maintaining the company’s growth prospects. Broader economic trends, including digital-first retail strategies and advancements in online payment infrastructure, provide a positive backdrop for Shopify’s performance. Additionally, global shifts in consumer behavior toward mobile commerce and subscription-based shopping platforms continue to drive upside for the company’s market valuation.
---
**Trading Recommendation:**
Shopify presents a compelling long-term growth opportunity fueled by its industry-leading role in e-commerce innovation. With strong underlying fundamentals and solid technical setups, the stock is positioned for upside momentum. Traders should monitor the outlined stop levels to mitigate potential downside risk while targeting gains toward the specified price targets. Overall, SHOP offers a favorable risk-reward profile for investors looking to capitalize on the ongoing shift to digital commerce.
```

Trading Analysis for SoFi Technologie
**Current Price:** $12.31
**Direction:** **LONG**
**LONG Targets:**
- **T1 = $13.50**
- **T2 = $14.00**
**Stop Levels:**
- **S1 = $11.90**
- **S2 = $11.50**
---
**Wisdom of Professional Traders:**
This analysis synthesizes insights from thousands of professional traders and market experts, leveraging collective intelligence to identify high-probability trade setups. The wisdom of crowds principle suggests that aggregated market perspectives from experienced professionals often outperform individual forecasts, reducing cognitive biases and highlighting consensus opportunities in SOFI.
**Key Insights:**
SOFI is currently being buoyed by renewed investor optimism surrounding the resumption of student loan repayments and the company's ability to benefit from prolonged tailwinds in consumer fintech. Analysts observe that SOFI is positioned to scale up its profitability as it diversifies its lending and financial services, adding sustainability to its growth trajectory. The price action has shown strong demand around critical support levels, with a notable push toward multi-month resistance at $13.80.
The macroeconomic environment has shifted favorably for SOFI as rising interest rates may improve net interest margins over time. In addition, trader sentiment is increasingly bullish as earnings week approaches, with many attributing anticipatory momentum to analysts' predictions of improving operating efficiency within the company.
**Recent Performance:**
SOFI recently staged an impressive rally, surging nearly 21% over the past week to trade as high as $13 before retracing slightly. This marks a 60% recovery from its year-to-date low of $8 in April. The stock has managed to break above its 50-day moving average, a key technical level, and is now testing resistance at its longer-term 150-day moving average. Should SOFI maintain its upward bias and surpass $13.80, it could attract significant buying interest, leading to sustained momentum.
**Expert Analysis:**
Technical indicators suggest bullish strength in SOFI's current setup, with the Relative Strength Index (RSI) moving closer to overbought territory, indicating positive momentum but also a need for attention to resistance hurdles. Analysts point to fundamentally supportive elements such as technological innovation in SOFI's products and the expected resumption of student loan payments, which may drive higher revenues in the coming quarters. Recent options market activity signals cautious optimism with robust demand for call contracts near the $13 mark.
**News Impact:**
Recent news about the reinstatement of student loan payments has been a pivotal factor in boosting sentiment around SOFI. Investors are counting on SOFI's infrastructure to handle increased volumes effectively, leading to expected revenue growth. Earnings speculation has also created a sense of opportunity, with traders watching closely for any upward revisions to guidance during the results announcement. Broader market trends and recovery in the financial sector further bolster a favorable outlook.
---
**Trading Recommendation:**
Based on SOFI's current price dynamics and market sentiment, a LONG position is recommended with an initial target (T1) of $13.50 and a secondary target (T2) of $14.00. Traders should manage risk effectively with stop levels at $11.90 (S1) and $11.50 (S2). The fundamental narrative, combined with near-term technical strength, suggests favorable conditions for upward momentum, especially if SOFI crosses the key resistance level at $13.80. Buyers should remain vigilant for earnings news and macroeconomic shifts that may impact volatility. The stock offers solid potential for mid-term appreciation, backed by a strong growth catalyst.
```

Trading Analysis for Toll Brothers**Current Price:** $101.06
**Direction:** **LONG**
**LONG Targets:**
- **T1 = $103.25**
- **T2 = $106.10**
**Stop Levels:**
- **S1 = $99.00**
- **S2 = $97.50**
---
**Wisdom of Professional Traders:**
This analysis synthesizes insights from thousands of professional traders and market experts, leveraging collective intelligence to identify high-probability trade setups. The wisdom of crowds principle suggests that aggregated market perspectives from experienced professionals often outperform individual forecasts, reducing cognitive biases and highlighting consensus opportunities in Toll Brothers.
**Key Insights:**
Toll Brothers, a leading luxury homebuilder, has shown significant strength in navigating current market conditions. Elevated demand for high-end housing has been bolstered by consumer confidence and stabilizing mortgage rates, allowing the company to maintain solid order growth and profitability. Toll Brothers’ focus on affluent markets and effective cost management is enabling it to weather challenges in the broader housing sector, positioning it well for near-term gains. Additionally, Toll Brothers' geographic diversification and premium brand recognition are driving continued client interest in its offerings.
**Recent Performance:**
The stock has demonstrated a strong upward trajectory over the past month, gaining more than 8%, and showing resilience above key technical resistance levels at $98. Growth in its share price has been bolstered by firm institutional buying, which is evident from upward trends in volume. Last week, Toll Brothers reported higher-than-expected revenue and net income figures, leading to renewed investor optimism. The stock's strong momentum following these earnings highlights its potential for further appreciation.
**Expert Analysis:**
Many market experts remain bullish on Toll Brothers, emphasizing its pricing power amid consistent demand for premium homes. Analysts note that its ability to expand gross margins while also maintaining strong delivery numbers is a testament to the company’s effective strategy in a challenging macroeconomic environment. The stock’s breakout above $100 serves as a technical signal to traders that higher price levels are likely to be tested in the near term, with potential upside targets of $103 and beyond.
**News Impact:**
Recent housing industry data reaffirm stable construction trends in Toll Brothers' target markets, strengthening its long-term prospects. Management’s updated guidance further reflects confidence in delivering stronger revenue figures in the upcoming quarters. Additionally, if Federal Reserve policies around interest rates remain consistent or favor stable borrowing costs, Toll Brothers could attract further investment interest. These external factors, combined with Toll Brothers’ internal strategies, contribute to its positive trading outlook.
---
**Trading Recommendation:**
Toll Brothers currently presents a compelling LONG opportunity, driven by robust demand for luxury housing, strong recent financial performance, and bullish technical indicators. The stock's upward momentum and favorable industry conditions suggest targets of $103.25 and $106.10 as achievable milestones in the short term. Conservative stop levels at $99.00 and $97.50 provide downside protection, making this an attractive setup for traders aiming to capitalize on near-term growth potential. Continued monitoring of housing market trends and macroeconomic factors is advised to refine strategies.

Trading Analysis for United Parcel Service**Current Price:** $98.92
**Direction:** **LONG**
**LONG Targets:**
- **T1 = $103**
- **T2 = $105**
**Stop Levels:**
- **S1 = $97**
- **S2 = $95**
---
**Wisdom of Professional Traders:**
This analysis synthesizes insights from thousands of professional traders and market experts, leveraging collective intelligence to identify high-probability trade setups. The wisdom of crowds principle suggests that aggregated market perspectives from experienced professionals often outperform individual forecasts, reducing cognitive biases and highlighting consensus opportunities in United Parcel Service.
**Key Insights:**
UPS benefits from its position as a global leader in logistics and package delivery, especially as key economies worldwide continue to strengthen post-pandemic recovery. The broader transportation sector is experiencing tailwinds due to improved consumer demand and B2B shipments, which provides a favorable backdrop for UPS to capitalize on higher network efficiency and cost controls. Analysts acknowledge that while economic uncertainties persist, UPS’s diversified operations and strategic initiatives, such as investments in automation and infrastructure, position it to maintain competitive advantages.
**Recent Performance:**
In recent weeks, UPS has showcased resilience in volatile market conditions. The stock is trading near its multi-week high, reflecting positive sentiment from both retail and institutional traders. Technical indicators, such as the Relative Strength Index (RSI) at 52.14, suggest neither overbought nor oversold conditions, providing room for continued upward price movement. Despite market uncertainty, the consistent recovery of the transportation and logistics sector has supported UPS, with gains evident in its last quarterly report.
**Expert Analysis:**
Analysts are optimistic about UPS's near-term prospects given its strong operating metrics, cost-cutting strategies, and focus on service improvements. Many experts cite favorable macroeconomic trends, including easing inflation, strong consumer spending, and robust e-commerce activity, as key growth drivers for the company. Furthermore, UPS's valuation, in comparison to its industry peers, appears attractive considering its cash flow strength and dividend-paying history. Technical signals such as a bullish crossover in the moving averages further bolster confidence in a moderate upside scenario.
**News Impact:**
Recent developments, including UPS’s strategic expansion into healthcare logistics, have been well-received by investors. This shift could open access to high-margin business opportunities in medical storage and delivery, which lends long-term growth potential. Additionally, global supply chain improvements and easing raw material costs contribute to optimism around future operating efficiencies. Traders are also paying attention to the upcoming earnings report, which is anticipated to reflect strong seasonal performance and may serve as a stock price catalyst.
---
**Trading Recommendation:**
The strong mix of technical, fundamental, and macroeconomic factors suggests a bullish outlook for United Parcel Service. With momentum indicators supporting upside potential and the stock trading below estimated intrinsic value, traders can consider LONG positions targeting $103 (T1) and $105 (T2), with stops placed at $97 (S1) and $95 (S2). UPS remains well-poised to benefit from improving operational efficiencies, increased network demand, and favorable industry trends, making it a promising candidate for a long-term investment strategy.
```

Tesla trading planTesla is also in my list and is the most hit during trading War n most heated were by even cars n stations were burning down by that it lead musk to lost more than 130 billion dollars in his networthy but it looks promising for further growth as you can see I trust my work and is always put smile in my face n growth,try by all means to position yourselfs in one of the stocks I've sent and note that we don't control the market,no matter clear structure can be we trade responsibly n risk very smart all the best

$MMM, Accumulation area ?Double bottom at $124 after a test of the ema 21 on the ema 50.
Attempt of new relative high supported by a good crossover.
A strong action above $140 would confirm the new setup.

Google trading I deaAs you can see even Google is been buttomed during tarrif am very excited because in stocks if it left you it takes time to slow down if they are growing soo guess what we are going to make alot of money trump is not lying when he said market will explode like you never seen before as a longterm trader I see everything clear,the only thing that is left that am scared of is world war lll that can start mouths end,the person who can stop everything is trump if he can manage to talk with Iran n Israel n also Ukraine n Russia this wars got many tension now n many countries are getting involved in this fights soo my prayer is to find solutions not support of troops,Russia got China n north Korea back up now as saying India n Pakistan can start a.serious war too if they won't have better dealt water supply soo all this matter is a serious things that will slowly down global economic as a trader you can't depend only on analysis but in everything that is going 0n you must be updated thank you.

Nvidia next possible move Hi traders what is your suggestion on this one?am looking at this bullish pennant and I believe it can breakes anytime soon note that this market is been controlled by economics n geopolitical this year soo far since Trump took the office he started trade war globally is not about who knows too much n who don't that's why you findout that things are going bek to were it was after tarrif is pause by that am saying everything we planned n analyst were good n moving accordingly until trade war started,that's the reason we don't only depend in analysis but in everything that is going on around the world wars,diseases n many more things does change very fast just make sure you are updated,soo I suggest you toom advantage of one company to own while they are pulling back don't fight with your mind mag 7 stocks they are all uptrend market don't be confused,understand pull back n were market is trending 😊 I wish you a profitable week

Msft trading I deaHi traders I hope you all doing good,I decided to drop atleast few long term investment analysis this morning,as you can see all mag 7 were going down during tarrif soo after this massive pill back as n investor it was not a threatening but n opportunity to buy lower as many companies were expensive n risky to position yourselfs higher now is your time to own atleast one of mag 7 companies,they are very cheap to invest in though compared to were it was early this year so do what you have to do thank you 😊

Al' set Tesla?Tesla. Take me to "Higher Highs Lane". I believe support is dominate in this case and will most likely send Tesla to new highs. Who knows, Elon may be the first trillionaire.

Tesla short
tesla will go further down
just few reactions from baseless fundamental
aiming at 240-260

Meta: Is the Plunge Inevitable?Despite its vast reach and market presence, Meta Platforms faces significant and compounding challenges that suggest a potentially turbulent future. While appearing dominant, the company is increasingly vulnerable to external pressures stemming from legal, regulatory, and competitive fronts. These growing headwinds threaten to erode its financial stability and alter its fundamental business model.
A critical area of concern involves the human cost of content moderation. Meta faces multiple lawsuits in Africa, alleging severe psychological harm to moderators exposed to disturbing content. These legal actions, particularly in Ghana and Kenya, argue that Meta bears responsibility for the well-being of these outsourced workers, citing inadequate support and exploitative conditions. A loss in these cases could set costly precedents, forcing Meta to significantly invest in or restructure its global content moderation operations and potentially face substantial liabilities.
Simultaneously, Meta confronts escalating regulatory action, particularly in Europe. Recent significant fines from the EU under the Digital Markets Act highlight regulatory intent to control how tech giants handle user data and maintain market dominance. These penalties, including a substantial fine over its "consent or pay" model and a previous one for unfair trading practices, signal a global trend towards stricter oversight that could constrain Meta's core advertising business model. Adding to this pressure is the ongoing US FTC antitrust trial, which seeks to unwind Meta's key acquisitions of Instagram and WhatsApp, citing anti-competitive practices. The potential forced divestiture of these highly lucrative platforms represents an existential threat, as Instagram alone accounts for a significant portion of Meta's advertising revenue.
These intertwined legal and regulatory battles, combined with intense competition in the digital landscape and the uncertain return on large investments like the Metaverse, create a challenging outlook for Meta. The cumulative effect of these pressures could significantly impact the company's profitability, market share, and public perception. Navigating this complex environment requires Meta to address these fundamental issues effectively, or face the increasing likelihood of a substantial downturn.

Trade Idea: Exelixis, Inc. (NASDAQ: EXEL)EXEL is offering a compelling setup, trading just above its 50-day moving average — a key technical level that has historically provided strong support. The stock belongs to a high-quality company with solid financials, reinforcing confidence in the broader trend.
With the price stabilizing above this important moving average, a small initial long position looks attractive to participate in potential upside continuation.
Entry Strategy:
Enter a small long position just above the 50-day moving average to align with the resumption of bullish momentum.
Risk Management:
Set a protective stop-loss at $35.30, providing a well-defined risk level should the trade move against us.
Important Note:
Be mindful that earnings are scheduled for May 13th, which could introduce heightened volatility. Consider adjusting position sizing accordingly or tightening risk management ahead of the announcement.
DISCLAIMER : The content and materials featured are for your information and education only and are not attended to address your particular personal requirements. The information does not constitute financial advice or recommendation and should not be considered as such. Risk Management is Your Shield! Always prioritise risk management. It’s your best defence against losses.

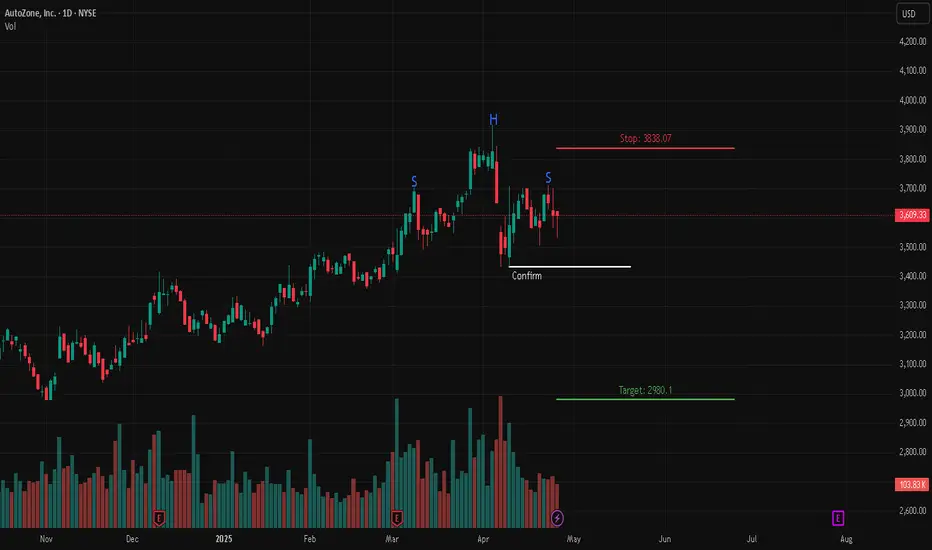
AutoZone Inc. (AZO) - Head & Shoulders Breakdown📉 Short Setup
🔍 Description:
AutoZone Inc. (NYSE: AZO) has formed a Head & Shoulders pattern, a bearish reversal setup. The price is hovering near the neckline, and a breakdown would confirm downside momentum. A retest of the neckline could provide another short entry opportunity.
📊 Trade Details:
🔹 Entry: Below neckline breakdown confirmation
🔴 Stop Loss: 3838.07
🟢 Target: 2980.10
📌 Confirmation:
A breakdown with strong volume adds conviction to the move. If price reclaims the right shoulder highs and holds above, the bearish setup could be invalidated.
Trade wisely! 📉🚨
tesla inc what a beauty in the chart tesla inc can do well a very promising chart, a good upmove can lead to 360+ levels

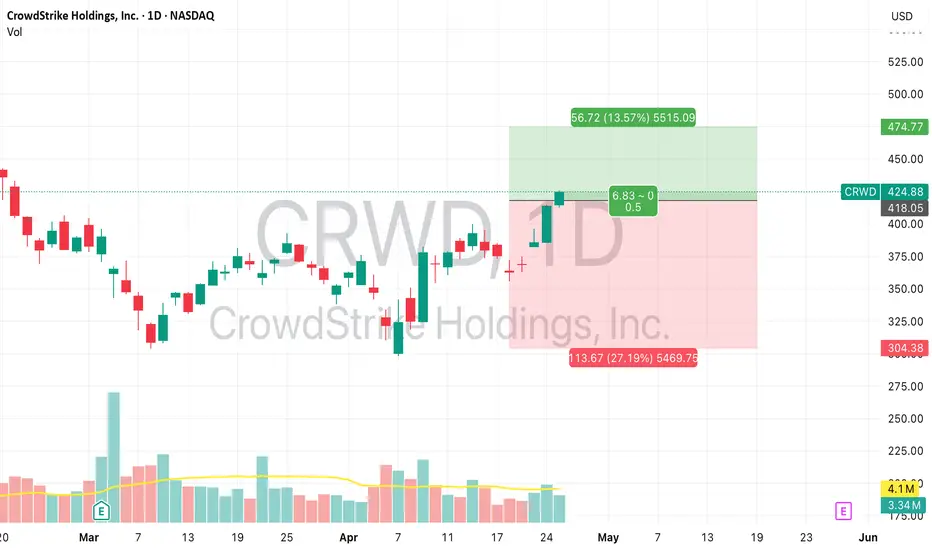
Edges of the GapPrice is testing the edges of a gap area and the 50 EMA and a key level the 3.54 price area. If we get an upward breakout price can possibly go to the 4.12 area, a bearish breakout can take price to the 10 EMA 2.85 price area; oscillators are strong CCI very overbought and Earnings this week. Please be very careful have a great day.

$AVGO #Breakout #Retest GOOOO!!! Price Target: $200Seeing a lot of "Buy The Dip" Opportunities built over the past 3 weeks...
NASDAQ:AVGO giving you a second chance at #WhiteBoySummer if you missed the first go around ;p
Look for High Volume Buying in the coming days, AI narrative isn't dead, NASDAQ:AVGO trying to challenge NASDAQ:NVDA ? I'm looking at both and also monitoring NASDAQ:SMH as well. Below red line idea is DEAD...
Paytience Pays!
- Prophecies

PalantirPalantir has continued to push higher, but if you look at MACD, it is running into resistance. Also, it is within the white target box for an impulsive wave, and has officially hit the yellow 1.0 if it is to be an abc pattern for the (a) of minor B. Due to the impulsive looking structure it seems to be turning into, and the duration/level of this move higher, I am officially making the bullish count my primary. That being said, the yellow count can still play out, but given the current price action and time duration, I find the white count most plausible.
We're due for a consolidation lower regardless of what count comes to fruition. Both patterns point to an abc move next to the $80 area if it is to be standard. The part that comes after that is what will answer the question of which count is correct. Once we get that move lower, if it is in the form of an abc, I will try to enter into a long position around the 0.618 retracement fib. That will be the least risky place to enter.
If the white count is what is playing out, then a minor wave 3 will come after the consolidation lower. If the yellow count is to play out, then it will be a minor C wave that takes us to the $120's. Either way you look at it, I am forecasting price to move significantly higher after our next move lower.
Let me know if any questions linger. I have added an orange label above the white box to signify we can still very easily get another high for minor wave 1. Once we do have a top in, I will add some retracement fibs to track the move lower.

LIVE NATIONS Stock Chart Fibonacci Analysis 042725Trading Idea
1) Find a FIBO slingshot
2) Check FIBO 61.80% level
3) Entry Point > 127/61.80%
Chart time frame:B
A) 15 min(1W-3M)
B) 1 hr(3M-6M)
C) 4 hr(6M-1year)
D) 1 day(1-3years)
Stock progress: A
A) Keep rising over 61.80% resistance
B) 61.80% resistance
C) 61.80% support
D) Hit the bottom
E) Hit the top
Stocks rise as they rise from support and fall from resistance. Our goal is to find a low support point and enter. It can be referred to as buying at the pullback point. The pullback point can be found with a Fibonacci extension of 61.80%. This is a step to find entry level. 1) Find a triangle (Fibonacci Speed Fan Line) that connects the high (resistance) and low (support) points of the stock in progress, where it is continuously expressed as a Slingshot, 2) and create a Fibonacci extension level for the first rising wave from the start point of slingshot pattern.
When the current price goes over 61.80% level , that can be a good entry point, especially if the SMA 100 and 200 curves are gathered together at 61.80%, it is a very good entry point.
As a great help, tradingview provides these Fibonacci speed fan lines and extension levels with ease. So if you use the Fibonacci fan line, the extension level, and the SMA 100/200 curve well, you can find an entry point for the stock market. At least you have to enter at this low point to avoid trading failure, and if you are skilled at entering this low point, with fibonacci6180 technique, your reading skill to chart will be greatly improved.
If you want to do day trading, please set the time frame to 5 minutes or 15 minutes, and you will see many of the low point of rising stocks.
If want to prefer long term range trading, you can set the time frame to 1 hr or 1 day.
