Meta: Is the Plunge Inevitable?Despite its vast reach and market presence, Meta Platforms faces significant and compounding challenges that suggest a potentially turbulent future. While appearing dominant, the company is increasingly vulnerable to external pressures stemming from legal, regulatory, and competitive fronts. These growing headwinds threaten to erode its financial stability and alter its fundamental business model.
A critical area of concern involves the human cost of content moderation. Meta faces multiple lawsuits in Africa, alleging severe psychological harm to moderators exposed to disturbing content. These legal actions, particularly in Ghana and Kenya, argue that Meta bears responsibility for the well-being of these outsourced workers, citing inadequate support and exploitative conditions. A loss in these cases could set costly precedents, forcing Meta to significantly invest in or restructure its global content moderation operations and potentially face substantial liabilities.
Simultaneously, Meta confronts escalating regulatory action, particularly in Europe. Recent significant fines from the EU under the Digital Markets Act highlight regulatory intent to control how tech giants handle user data and maintain market dominance. These penalties, including a substantial fine over its "consent or pay" model and a previous one for unfair trading practices, signal a global trend towards stricter oversight that could constrain Meta's core advertising business model. Adding to this pressure is the ongoing US FTC antitrust trial, which seeks to unwind Meta's key acquisitions of Instagram and WhatsApp, citing anti-competitive practices. The potential forced divestiture of these highly lucrative platforms represents an existential threat, as Instagram alone accounts for a significant portion of Meta's advertising revenue.
These intertwined legal and regulatory battles, combined with intense competition in the digital landscape and the uncertain return on large investments like the Metaverse, create a challenging outlook for Meta. The cumulative effect of these pressures could significantly impact the company's profitability, market share, and public perception. Navigating this complex environment requires Meta to address these fundamental issues effectively, or face the increasing likelihood of a substantial downturn.

Trade Idea: Exelixis, Inc. (NASDAQ: EXEL)EXEL is offering a compelling setup, trading just above its 50-day moving average — a key technical level that has historically provided strong support. The stock belongs to a high-quality company with solid financials, reinforcing confidence in the broader trend.
With the price stabilizing above this important moving average, a small initial long position looks attractive to participate in potential upside continuation.
Entry Strategy:
Enter a small long position just above the 50-day moving average to align with the resumption of bullish momentum.
Risk Management:
Set a protective stop-loss at $35.30, providing a well-defined risk level should the trade move against us.
Important Note:
Be mindful that earnings are scheduled for May 13th, which could introduce heightened volatility. Consider adjusting position sizing accordingly or tightening risk management ahead of the announcement.
DISCLAIMER : The content and materials featured are for your information and education only and are not attended to address your particular personal requirements. The information does not constitute financial advice or recommendation and should not be considered as such. Risk Management is Your Shield! Always prioritise risk management. It’s your best defence against losses.

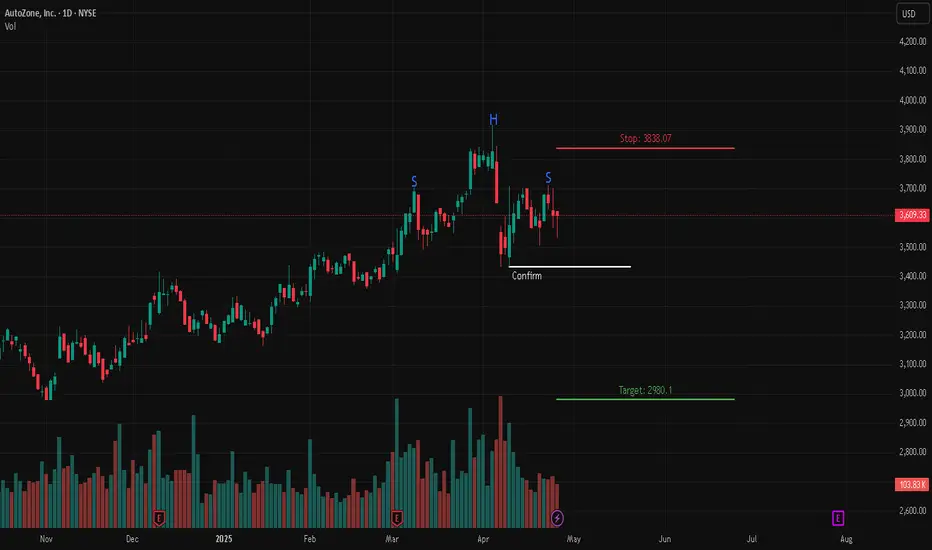
AutoZone Inc. (AZO) - Head & Shoulders Breakdown📉 Short Setup
🔍 Description:
AutoZone Inc. (NYSE: AZO) has formed a Head & Shoulders pattern, a bearish reversal setup. The price is hovering near the neckline, and a breakdown would confirm downside momentum. A retest of the neckline could provide another short entry opportunity.
📊 Trade Details:
🔹 Entry: Below neckline breakdown confirmation
🔴 Stop Loss: 3838.07
🟢 Target: 2980.10
📌 Confirmation:
A breakdown with strong volume adds conviction to the move. If price reclaims the right shoulder highs and holds above, the bearish setup could be invalidated.
Trade wisely! 📉🚨
tesla inc what a beauty in the chart tesla inc can do well a very promising chart, a good upmove can lead to 360+ levels

Edges of the GapPrice is testing the edges of a gap area and the 50 EMA and a key level the 3.54 price area. If we get an upward breakout price can possibly go to the 4.12 area, a bearish breakout can take price to the 10 EMA 2.85 price area; oscillators are strong CCI very overbought and Earnings this week. Please be very careful have a great day.

$AVGO #Breakout #Retest GOOOO!!! Price Target: $200Seeing a lot of "Buy The Dip" Opportunities built over the past 3 weeks...
NASDAQ:AVGO giving you a second chance at #WhiteBoySummer if you missed the first go around ;p
Look for High Volume Buying in the coming days, AI narrative isn't dead, NASDAQ:AVGO trying to challenge NASDAQ:NVDA ? I'm looking at both and also monitoring NASDAQ:SMH as well. Below red line idea is DEAD...
Paytience Pays!
- Prophecies

PalantirPalantir has continued to push higher, but if you look at MACD, it is running into resistance. Also, it is within the white target box for an impulsive wave, and has officially hit the yellow 1.0 if it is to be an abc pattern for the (a) of minor B. Due to the impulsive looking structure it seems to be turning into, and the duration/level of this move higher, I am officially making the bullish count my primary. That being said, the yellow count can still play out, but given the current price action and time duration, I find the white count most plausible.
We're due for a consolidation lower regardless of what count comes to fruition. Both patterns point to an abc move next to the $80 area if it is to be standard. The part that comes after that is what will answer the question of which count is correct. Once we get that move lower, if it is in the form of an abc, I will try to enter into a long position around the 0.618 retracement fib. That will be the least risky place to enter.
If the white count is what is playing out, then a minor wave 3 will come after the consolidation lower. If the yellow count is to play out, then it will be a minor C wave that takes us to the $120's. Either way you look at it, I am forecasting price to move significantly higher after our next move lower.
Let me know if any questions linger. I have added an orange label above the white box to signify we can still very easily get another high for minor wave 1. Once we do have a top in, I will add some retracement fibs to track the move lower.

LIVE NATIONS Stock Chart Fibonacci Analysis 042725Trading Idea
1) Find a FIBO slingshot
2) Check FIBO 61.80% level
3) Entry Point > 127/61.80%
Chart time frame:B
A) 15 min(1W-3M)
B) 1 hr(3M-6M)
C) 4 hr(6M-1year)
D) 1 day(1-3years)
Stock progress: A
A) Keep rising over 61.80% resistance
B) 61.80% resistance
C) 61.80% support
D) Hit the bottom
E) Hit the top
Stocks rise as they rise from support and fall from resistance. Our goal is to find a low support point and enter. It can be referred to as buying at the pullback point. The pullback point can be found with a Fibonacci extension of 61.80%. This is a step to find entry level. 1) Find a triangle (Fibonacci Speed Fan Line) that connects the high (resistance) and low (support) points of the stock in progress, where it is continuously expressed as a Slingshot, 2) and create a Fibonacci extension level for the first rising wave from the start point of slingshot pattern.
When the current price goes over 61.80% level , that can be a good entry point, especially if the SMA 100 and 200 curves are gathered together at 61.80%, it is a very good entry point.
As a great help, tradingview provides these Fibonacci speed fan lines and extension levels with ease. So if you use the Fibonacci fan line, the extension level, and the SMA 100/200 curve well, you can find an entry point for the stock market. At least you have to enter at this low point to avoid trading failure, and if you are skilled at entering this low point, with fibonacci6180 technique, your reading skill to chart will be greatly improved.
If you want to do day trading, please set the time frame to 5 minutes or 15 minutes, and you will see many of the low point of rising stocks.
If want to prefer long term range trading, you can set the time frame to 1 hr or 1 day.

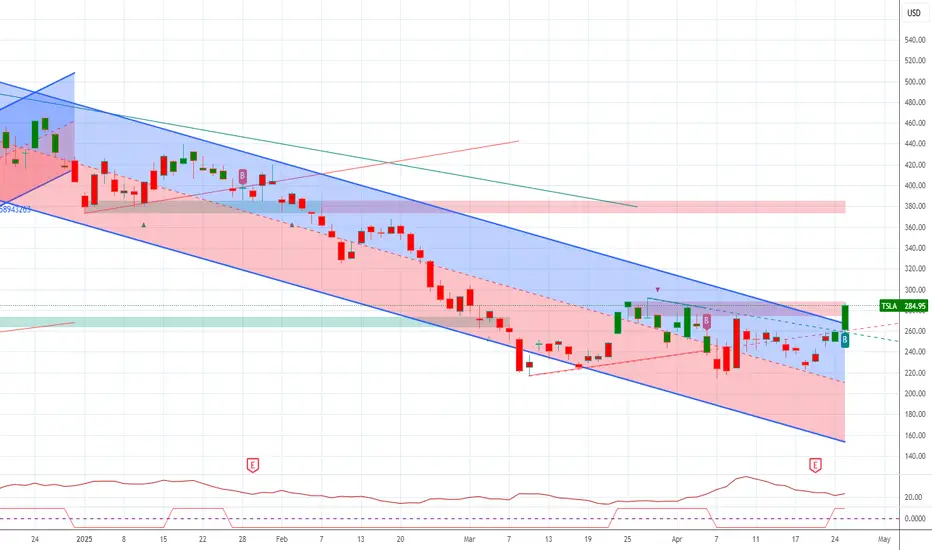
TeslaI hope y'all had the opportunity to buy into Tesla last week. As for me, I bought in @ $237 and sold @ 284.20. I only had 25 shares but made a nice 20% profit in about one week. It's trades like these that build your account and create wealth in the very long-term. Yes, I sold before we made it into the target box, but you have to remember, this is a larger (B) wave we're currently in. They can be very complex and unpredictable at times. Price is right in the area of the 0.382, it hit the smaller red 1.0, and has made a new high above the a wave made on 09 April. I would like to see it breach the (a) wave high of 25 March, but that isn't required. This means it has all the pre-requisites of completion. Will it hit the target box for another high? I think so, but I'm not greedy or try to top tick. 20% profit is good enough for me. The last thing I want to happen is the volatility of Tesla kick in and lose all the profits I just made. Don't be so scared of missing POTENTIAL profits that is causes you to lose the ones you ALREADY earned.
All that being said, I find it likely that we make another high into the target box due to the structure. It looks like it needs one more slight high. The red box is the "sweet" spot, but price can top at any moment. Also, if you look at MACD, it is coming into the trend line and thus is running into resistance. This should make you think a local top is near if not already struck. Let me know if y'all have any questions.
P.S: Don't ask me if you should sell. I already stated I sold my shares and cannot give you financial advice. Trade according to your own portfolio / risk tolerance.

NVIDIA Chart with Advance Smart TP, SL, and EMA Trailing"Technical Analysis of This New Chart (NVIDIA 15-min, Heikin Ashi)
Setup:
Entry: 105.23
Forecast EMA: 103.02 (trending nicely upwards under the price = bullish support)
🧠 Key Observations:
The Forecast EMA result varies based on your settings and the selected chart timeframe."
Stop Loss: 99.97 (tight but safe under previous consolidation zone)
Take Profits:
TP1: 110.50 ✅
TP2: 115.76 ✅
TP3: 121.02 ✅
🧠 Key Observations:
Strong Breakout: You caught the move perfectly after a big consolidation phase (accumulation area visible).
Healthy Pullback: Small pullback after TP2 — healthy behavior, not a sharp reversal yet.
Forecast EMA Position: Price is well above Forecast EMA (103.02), and EMA is rising ➔ very bullish.
🛡️ Upgraded Trade Management Plan (for this chart):
1. If still holding the trade:
✅ Stop Loss Adjustment:
Now that TP1 (110.50) was hit, you should move Stop Loss up to your Entry (105.23) ➔ You are now risk-free.
2. Partial Take Profits Plan:
🎯 At TP2 (115.76):
➔ Sell 50% of remaining position.
➔ Activate a trailing stop for the rest.
🎯 At TP3 (121.02):
➔ Let the trailing stop follow.
➔ Tighten the trail after every new 15-min high is broken.
3. Trailing Stop Strategy After TP2:
📈 Trail the stop 2 bars behind the most recent swing low on the 15-min chart.
Example: If a candle makes a higher high and a higher low ➔ move stop 2 candles back to protect gains.
✍️ Special Notes:
If price suddenly drops and closes a full 15-min candle below Forecast EMA (103.02), it’s a sign momentum is weakening — you may want to close manually if that happens instead of risking trailing stop whipsaws.
Heikin Ashi candles make it easier to spot strong trends — watch for small-bodied candles (like dojis) at TP2/TP3 ➔ potential reversal signals.

NIKE DCA OpportunityThis is another significant demand zone that's worth buying from. Targets are previous all time high with the expectation of breaking previous highs. Stay ahead of the curve and good luck

ALB DCA Opportunitywe are at another significant level from which demand can push the price of this stock up. Our targets are the next two significant supply levels. This is a high return yielding opportunity. Stay ahead of the curve and good luck

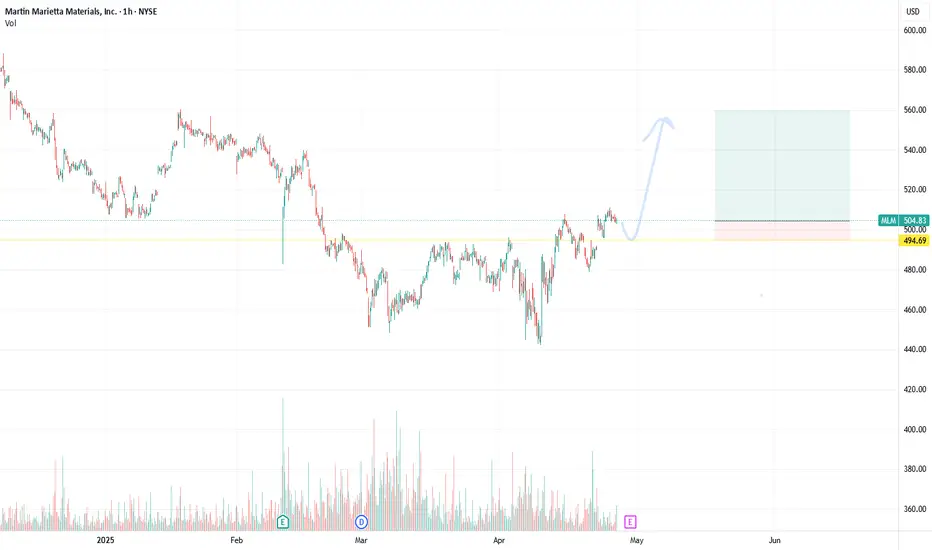
MLAan upward trend in the prices of an industry's stocks or the overall rise in broad market indices, characterized by high investor confidence
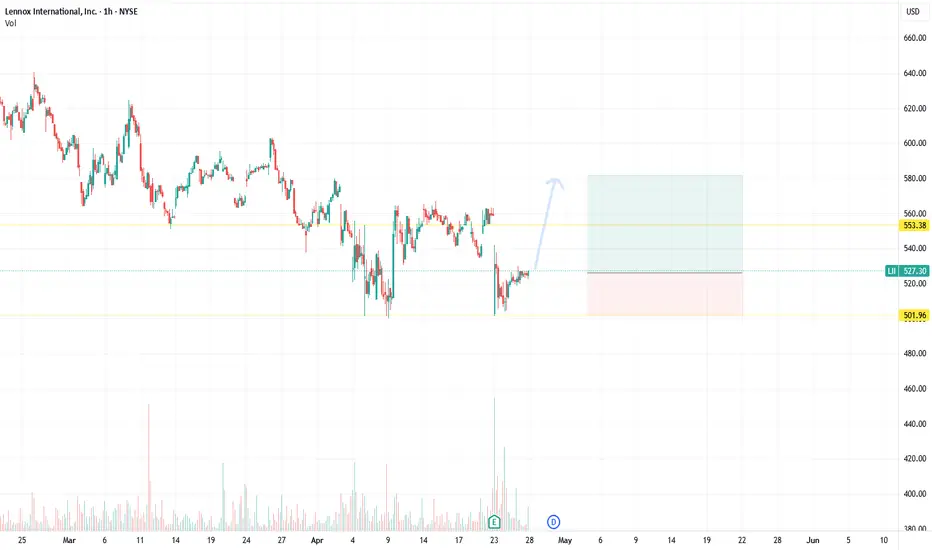
LIIan upward trend in the prices of an industry's stocks or the overall rise in broad market indices, characterized by high investor confidence
MSCIan upward trend in the prices of an industry's stocks or the overall rise in broad market indices, characterized by high investor confidence

REGNan upward trend in the prices of an industry's stocks or the overall rise in broad market indices, characterized by high investor confidence

URIan upward trend in the prices of an industry's stocks or the overall rise in broad market indices, characterized by high investor confidence

PARAMOUNT Stock Chart Fibonacci Analysis 042725Trading Idea
1) Find a FIBO slingshot
2) Check FIBO 61.80% level
3) Entry Point > 11.4/61.80%
Chart time frame: C
A) 15 min(1W-3M)
B) 1 hr(3M-6M)
C) 4 hr(6M-1year)
D) 1 day(1-3years)
Stock progress: D
A) Keep rising over 61.80% resistance
B) 61.80% resistance
C) 61.80% support
D) Hit the bottom
E) Hit the top
Stocks rise as they rise from support and fall from resistance. Our goal is to find a low support point and enter. It can be referred to as buying at the pullback point. The pullback point can be found with a Fibonacci extension of 61.80%. This is a step to find entry level. 1) Find a triangle (Fibonacci Speed Fan Line) that connects the high (resistance) and low (support) points of the stock in progress, where it is continuously expressed as a Slingshot, 2) and create a Fibonacci extension level for the first rising wave from the start point of slingshot pattern.
When the current price goes over 61.80% level , that can be a good entry point, especially if the SMA 100 and 200 curves are gathered together at 61.80%, it is a very good entry point.
As a great help, tradingview provides these Fibonacci speed fan lines and extension levels with ease. So if you use the Fibonacci fan line, the extension level, and the SMA 100/200 curve well, you can find an entry point for the stock market. At least you have to enter at this low point to avoid trading failure, and if you are skilled at entering this low point, with fibonacci6180 technique, your reading skill to chart will be greatly improved.
If you want to do day trading, please set the time frame to 5 minutes or 15 minutes, and you will see many of the low point of rising stocks.
If want to prefer long term range trading, you can set the time frame to 1 hr or 1 day.

TSLA bottom on Weekly chartI am calling a temporary bottom on TSLA stock due to Ichimoku cloud support on the Weekly chart. Ignore the bad news and all the other things going on. Price is everything. Stop losses should be placed below the cloud support. If It keeps going down and I end up being wrong SO BE IT. If it goes up from here then you can thank me later by buying me a coffee with your profits. But no Starbucks coffee please. I don't consider that coffee, more like road tar. Carry on recruits.

HIMS: how I charted this + bullish/bearish/neutral scenarios! Bullish
A break and hold above the 20EMA would shift momentum back to the upside.
Initial resistance would be around 30, where previous price congestion sits.
If buyers can push through, next target would be around 35–36, near the declining 50SMA.
There is a short-term intraday trendline forming on the hourly chart that could act as a support guide if the stock starts climbing.
Bearish
A rejection from the downtrend line or failure to hold above the 20EMA could lead to a move lower.
Breaking below the 24–25 support area would be a key bearish trigger.
If that level fails, the next major downside target would be near 19.5.
Neutral
Continued sideways chop around the moving averages.

Quantum's Walmart (WMT) Trading Guide 4/28/25WMT’s weekly outlook balances its defensive resilience against macroeconomic headwinds, with a comprehensive synthesis of technical, market, and strategic factors guiding its trajectory for weekly options contracts. The FAME framework underscores WMT’s long-term bullish potential, driven by robust fundamentals (+5% revenue, $0.58 EPS, 21% e-commerce growth) and adaptability (AI, Walmart+), positioning it as a resilient player in a risk-off regime. However, elevated yields (10-year 4.255%, 20-year 4.738%, 30-year 4.721%) and a stable DXY at 99.58 amplify tariff pressures and margin concerns, capping upside and reinforcing a cautious stance. A tactical long bias is favored for weekly contracts, targeting a bounce from $94.36 to $96.47–$98.50, with a short stance viable below $88.50 if support fails.
Technical implications highlight bullish momentum on daily (RSI ~40, Stochastic ~28) and weekly (RSI ~44, Stochastic ~32) timeframes, with oversold conditions signaling a rebound potential for weekly contracts if $94.36 holds. Monthly neutral momentum (RSI ~50) suggests consolidation, requiring a breakout above $96.47 to confirm bullish strength. This supports a short-term bounce but advises monitoring for sustained moves.
Market influence implications reflect a risk-off environment, with high yields and a stable DXY increasing import costs, particularly amid tariff uncertainty from WMT’s upcoming Trump meeting. The VIX at 24.84 amplifies volatility, favoring WMT’s defensive appeal but heightening risks. WMT’s Q3 FY25 strength and e-commerce growth provide stability, supporting resilience near $94.36.
OFD summary and implications reveal bearish pressure from Vanna (-$0.04), Charm (-$0.02), and DEX (-$0.06), driven by put-heavy flow and hedging demand tied to tariff fears. However, GEX (+$0.08) at the $95 strike pins price, stabilizing volatility and supporting a neutral-to-bullish bounce for weekly contracts if $94.36 holds, aligning with oversold technicals.
Edge insights bolster the case for a bounce, with institutional buying at $94–$95 signaling accumulation, defensive retail sector strength outperforming cyclicals, and low short interest (1.4%) offering squeeze potential above $96.47. These factors enhance confidence in a tactical long bias for weekly contracts, provided support holds.
Strategic outlook implications emphasize consolidation near $95.09, with $94.36 as a critical pivot. A break below risks $88.50, driven by tariff fears and bearish options flow, while a move above $96.47 targets $98.50, fueled by oversold signals and institutional support. The VIX at 24.84 and put-heavy options flow underscore volatility, but WMT’s defensive positioning mitigates downside, favoring a bounce in a risk-off regime.
In summary, WMT’s weekly outlook hinges on defending $94.36, with oversold technicals, GEX pinning, and institutional buying supporting a bounce to $96.47–$98.50 for weekly contracts. Tariff risks, high yields, and DXY stability maintain a risk-off backdrop, capping upside and requiring vigilance for a break below support, which could shift bias to bearish. This balanced approach leverages WMT’s defensive strengths while navigating weekly volatility, aligning with Buffett’s preference for resilient businesses with tactical opportunities.
