JPMorgan Chase (JPM) Momentum in MotionJPMorgan Chase (JPM) | 3W Chart 📊
“Momentum in motion.”
After a textbook bounce off the Fib 0.236 (220.38) and reclaim of the 0.382 (231.63), JPM is charging into the golden zone, currently hovering around the 0.5 level (240.72). With $243.55 on the board and a bullish 3-week candle, all eyes are now on the 0.618 (249.82) and ultimately the 0.786 (262.77).
🔁 Previous High: $279.23
📈 Structure: Curved base forming, signaling accumulation.
🧠 Psychology: Dip buyers stepping in, confirming demand zone.
If volume and macro conditions align, this setup could turn into a multi-quarter expansion leg.

COINBASE (COIN) | 3W Outlook
Price just closed above $209.64 — reclaiming the 0.236 Fib level with a +19.77% candle! We're now watching to see if this breakout has the momentum to continue toward the 0.382 ($221.54) and eventually retest the 0.5 zone ($245.99).
🟣 Previous High at $349.75 remains a major target — but notice how price respected that $142.58 support and launched with force.
🔄 Market structure still favors bulls in this mid-term reversal setup. A break and hold above $221 could be the confirmation many are waiting for.
🚀 Next stops: $245.99 → $270.43 → $305.24 🎯 Long-term goal: $349.75 and beyond.

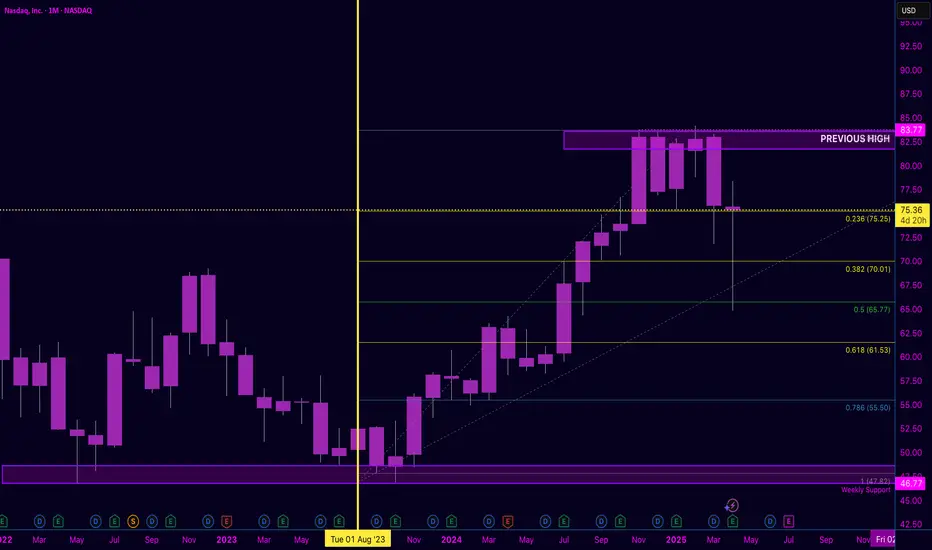
NASDAQ Monthly | Healthy Correction or Trend Shift?
Price has pulled back from the $83.77 previous high, now hovering right on the 0.236 Fib level at $75.25 — a critical area to watch.
🟣 Rejection at the top shows momentum cooling. 🟡 If support fails here, eyes shift to $70.01 (0.382) and possibly $65.77 (0.5) as next key levels.
This move may be the correction the market needs before resuming trend — or the start of a deeper retracement.
📉 Stay sharp. Structure tells the story.
ACCENTURE Stock Chart Fibonacci Analysis 042525Trading Idea
1) Find a FIBO slingshot
2) Check FIBO 61.80% level
3) Entry Point > 290/61.80%
Chart time frame: D
A) 15 min(1W-3M)
B) 1 hr(3M-6M)
C) 4 hr(6M-1year)
D) 1 day(1-3years)
Stock progress: A
A) Keep rising over 61.80% resistance
B) 61.80% resistance
C) 61.80% support
D) Hit the bottom
E) Hit the top
Stocks rise as they rise from support and fall from resistance. Our goal is to find a low support point and enter. It can be referred to as buying at the pullback point. The pullback point can be found with a Fibonacci extension of 61.80%. This is a step to find entry level. 1) Find a triangle (Fibonacci Speed Fan Line) that connects the high (resistance) and low (support) points of the stock in progress, where it is continuously expressed as a Slingshot, 2) and create a Fibonacci extension level for the first rising wave from the start point of slingshot pattern.
When the current price goes over 61.80% level , that can be a good entry point, especially if the SMA 100 and 200 curves are gathered together at 61.80%, it is a very good entry point.
As a great help, tradingview provides these Fibonacci speed fan lines and extension levels with ease. So if you use the Fibonacci fan line, the extension level, and the SMA 100/200 curve well, you can find an entry point for the stock market. At least you have to enter at this low point to avoid trading failure, and if you are skilled at entering this low point, with fibonacci6180 technique, your reading skill to chart will be greatly improved.
If you want to do day trading, please set the time frame to 5 minutes or 15 minutes, and you will see many of the low point of rising stocks.
If want to prefer long term range trading, you can set the time frame to 1 hr or 1 day.

Long on $TTD ; It should test 75-80 range- Many good news have come for NASDAQ:TTD in the last 2 weeks and one of that is Judge ruling against Google Ad business which might lead to relaxed rules by Google which will help other advertisers expand their TAM
- Netflix ads should allow DSPs like NASDAQ:TTD to get more investment dollars flowing through their platform.
- EPS is growing massively in FY 2027/2028.
- I'm not sure if we could get all time high before 2027 but firmly believe NASDAQ:TTD should test 200 weekly SMA.

CORZ / 4h#CoreScientific closed the week with a 31% rising tide. So, the wave structure of impulsive advance quite well suggests adjusting a differing analysis on the prior wave C, in which its wave ((v)) diagonally could have ended last week, so the trend in Minor-degree should have turned upward.
>> Technically, continuing to advance towards the origin of the ending diagonal wave ((v)) will highly confirm the trend change( in Minor degree ).
#CryptoStocks #CORZ #BTCMining #Bitcoin #BTC

MERCK Stock Chart Fibonacci Analysis 042525Trading Idea
1) Find a FIBO slingshot
2) Check FIBO 61.80% level
3) Entry Point > 82/61.80%
Chart time frame: D
A) 15 min(1W-3M)
B) 1 hr(3M-6M)
C) 4 hr(6M-1year)
D) 1 day(1-3years)
Stock progress: A
A) Keep rising over 61.80% resistance
B) 61.80% resistance
C) 61.80% support
D) Hit the bottom
E) Hit the top
Stocks rise as they rise from support and fall from resistance. Our goal is to find a low support point and enter. It can be referred to as buying at the pullback point. The pullback point can be found with a Fibonacci extension of 61.80%. This is a step to find entry level. 1) Find a triangle (Fibonacci Speed Fan Line) that connects the high (resistance) and low (support) points of the stock in progress, where it is continuously expressed as a Slingshot, 2) and create a Fibonacci extension level for the first rising wave from the start point of slingshot pattern.
When the current price goes over 61.80% level , that can be a good entry point, especially if the SMA 100 and 200 curves are gathered together at 61.80%, it is a very good entry point.
As a great help, tradingview provides these Fibonacci speed fan lines and extension levels with ease. So if you use the Fibonacci fan line, the extension level, and the SMA 100/200 curve well, you can find an entry point for the stock market. At least you have to enter at this low point to avoid trading failure, and if you are skilled at entering this low point, with fibonacci6180 technique, your reading skill to chart will be greatly improved.
If you want to do day trading, please set the time frame to 5 minutes or 15 minutes, and you will see many of the low point of rising stocks.
If want to prefer long term range trading, you can set the time frame to 1 hr or 1 day.

MOELIS Stock Chart Fibonacci Analysis 042525Trading Idea
1) Find a FIBO slingshot
2) Check FIBO 61.80% level
3) Entry Point > 49/61.80%
Chart time frame: D
A) 15 min(1W-3M)
B) 1 hr(3M-6M)
C) 4 hr(6M-1year)
D) 1 day(1-3years)
Stock progress: A
A) Keep rising over 61.80% resistance
B) 61.80% resistance
C) 61.80% support
D) Hit the bottom
E) Hit the top
Stocks rise as they rise from support and fall from resistance. Our goal is to find a low support point and enter. It can be referred to as buying at the pullback point. The pullback point can be found with a Fibonacci extension of 61.80%. This is a step to find entry level. 1) Find a triangle (Fibonacci Speed Fan Line) that connects the high (resistance) and low (support) points of the stock in progress, where it is continuously expressed as a Slingshot, 2) and create a Fibonacci extension level for the first rising wave from the start point of slingshot pattern.
When the current price goes over 61.80% level , that can be a good entry point, especially if the SMA 100 and 200 curves are gathered together at 61.80%, it is a very good entry point.
As a great help, tradingview provides these Fibonacci speed fan lines and extension levels with ease. So if you use the Fibonacci fan line, the extension level, and the SMA 100/200 curve well, you can find an entry point for the stock market. At least you have to enter at this low point to avoid trading failure, and if you are skilled at entering this low point, with fibonacci6180 technique, your reading skill to chart will be greatly improved.
If you want to do day trading, please set the time frame to 5 minutes or 15 minutes, and you will see many of the low point of rising stocks.
If want to prefer long term range trading, you can set the time frame to 1 hr or 1 day.

LOCKHEED MARTIN Stock Chart Fibonacci Analysis 042525Trading Idea
1) Find a FIBO slingshot
2) Check FIBO 61.80% level
3) Entry Point > 464/61.80%
Chart time frame: D
A) 15 min(1W-3M)
B) 1 hr(3M-6M)
C) 4 hr(6M-1year)
D) 1 day(1-3years)
Stock progress: A
A) Keep rising over 61.80% resistance
B) 61.80% resistance
C) 61.80% support
D) Hit the bottom
E) Hit the top
Stocks rise as they rise from support and fall from resistance. Our goal is to find a low support point and enter. It can be referred to as buying at the pullback point. The pullback point can be found with a Fibonacci extension of 61.80%. This is a step to find entry level. 1) Find a triangle (Fibonacci Speed Fan Line) that connects the high (resistance) and low (support) points of the stock in progress, where it is continuously expressed as a Slingshot, 2) and create a Fibonacci extension level for the first rising wave from the start point of slingshot pattern.
When the current price goes over 61.80% level , that can be a good entry point, especially if the SMA 100 and 200 curves are gathered together at 61.80%, it is a very good entry point.
As a great help, tradingview provides these Fibonacci speed fan lines and extension levels with ease. So if you use the Fibonacci fan line, the extension level, and the SMA 100/200 curve well, you can find an entry point for the stock market. At least you have to enter at this low point to avoid trading failure, and if you are skilled at entering this low point, with fibonacci6180 technique, your reading skill to chart will be greatly improved.
If you want to do day trading, please set the time frame to 5 minutes or 15 minutes, and you will see many of the low point of rising stocks.
If want to prefer long term range trading, you can set the time frame to 1 hr or 1 day.

Stock Of The Day / 04.25.25 / SMMT04.25.2025 / NASDAQ:SMMT #SMMT
Fundamentals. Neutral news background
Technical analysis.
Daily chart: The price updated the All Time High during the previous trading session. The nearest support level is 33.60, formed by the trend break in September 2024.
Premarket: Gap Down on moderate volume. The price tests the level of 33.60, but holds above.
Trading session: The price tests the level of 33.60 twice and gradually tightens towards it in the first hour of trading session. We also note that the premarket high was not updated. The price makes 2 unsuccessful attempts to return back above the level after breakdown of 33.60. We are considering a short trade in case the level is held below.
Trading scenario: #breakout with retest of level 33.60
Entry: 32.99 when the level is held below and the lower low is updated.
Stop: 33.71 we hide it behind the high of the retest.
Exit: We observe a strong impulse movement without a trend structure. It is optimal to take profit in such movements in parts upon reaching certain target profit goals (RR 1/3, 1/4, etc.) with subsequent tightening of the stop. Close the last part of the position at a price of 25.36 when a reversal candlestick pattern appears.
Risk Rewards: 1/10 max
P.S. In order to understand the idea of the Stock Of The Day analysis, please read the following information .

GLOBAL-E Stock Chart Fibonacci Analysis 042525Trading Idea
1) Find a FIBO slingshot
2) Check FIBO 61.80% level
3) Entry Point > 32/61.80%
Chart time frame: D
A) 15 min(1W-3M)
B) 1 hr(3M-6M)
C) 4 hr(6M-1year)
D) 1 day(1-3years)
Stock progress: A
A) Keep rising over 61.80% resistance
B) 61.80% resistance
C) 61.80% support
D) Hit the bottom
E) Hit the top
Stocks rise as they rise from support and fall from resistance. Our goal is to find a low support point and enter. It can be referred to as buying at the pullback point. The pullback point can be found with a Fibonacci extension of 61.80%. This is a step to find entry level. 1) Find a triangle (Fibonacci Speed Fan Line) that connects the high (resistance) and low (support) points of the stock in progress, where it is continuously expressed as a Slingshot, 2) and create a Fibonacci extension level for the first rising wave from the start point of slingshot pattern.
When the current price goes over 61.80% level , that can be a good entry point, especially if the SMA 100 and 200 curves are gathered together at 61.80%, it is a very good entry point.
As a great help, tradingview provides these Fibonacci speed fan lines and extension levels with ease. So if you use the Fibonacci fan line, the extension level, and the SMA 100/200 curve well, you can find an entry point for the stock market. At least you have to enter at this low point to avoid trading failure, and if you are skilled at entering this low point, with fibonacci6180 technique, your reading skill to chart will be greatly improved.
If you want to do day trading, please set the time frame to 5 minutes or 15 minutes, and you will see many of the low point of rising stocks.
If want to prefer long term range trading, you can set the time frame to 1 hr or 1 day.

EXPD, bullish action on the hourly chartHourly Chart. The price shows a bullish price action of 2 weeks after a drop of 21% from $128 to $100.
Second bullish crossover after the first one failed.
There is a good gap left open at $121

HIMS higher RR Hello,
Technical prespective only:
Equal Low of the Bullish Breaker, as long it holds the channel is valid and we could see higher prices towards the algotargets (red), if the price dips then i'll be adding more to the bag.
NFA

How much is Nvidia worth next week?Nvidia is holding up a good 16% past the last post. I am currently neutral to the fact it has swung up and down and is now back to its price it was at last friday , $111.00 is ideal stable line average in 2%-3% either direction .The VIX is getting lower. If im bear i see potential for 3%-8% low(with no fear news).As for another up trending after consolidation a 5% - 12% gain ,high getting to $124.

Rimini Street (RMNI): ERP Support Demand Powers Stock StrengthRimini Street, Inc. (RMNI) is a global provider of enterprise software support services, helping businesses optimize and extend the life of their existing ERP systems like Oracle and SAP. By offering a more cost-effective alternative to traditional vendor support, Rimini Street helps clients free up resources for innovation and strategic initiatives. As companies look for ways to reduce IT expenses and increase flexibility, Rimini Street is well-positioned to capitalize on the growing demand for third-party support solutions.
Currently, the stock is sitting just under the 0.236 Fibonacci retracement level, about to enter the momentum zone. RMNI is testing recent highs, showing bullish strength and signaling the potential for a breakout if buyers continue to support the move with strong volume.

WARNER BROS Stock Chart Fibonacci Analysis 042525Trading Idea
1) Find a FIBO slingshot
2) Check FIBO 61.80% level
3) Entry Point > 8/61.80%
Chart time frame: D
A) 15 min(1W-3M)
B) 1 hr(3M-6M)
C) 4 hr(6M-1year)
D) 1 day(1-3years)
Stock progress: A
A) Keep rising over 61.80% resistance
B) 61.80% resistance
C) 61.80% support
D) Hit the bottom
E) Hit the top
Stocks rise as they rise from support and fall from resistance. Our goal is to find a low support point and enter. It can be referred to as buying at the pullback point. The pullback point can be found with a Fibonacci extension of 61.80%. This is a step to find entry level. 1) Find a triangle (Fibonacci Speed Fan Line) that connects the high (resistance) and low (support) points of the stock in progress, where it is continuously expressed as a Slingshot, 2) and create a Fibonacci extension level for the first rising wave from the start point of slingshot pattern.
When the current price goes over 61.80% level , that can be a good entry point, especially if the SMA 100 and 200 curves are gathered together at 61.80%, it is a very good entry point.
As a great help, tradingview provides these Fibonacci speed fan lines and extension levels with ease. So if you use the Fibonacci fan line, the extension level, and the SMA 100/200 curve well, you can find an entry point for the stock market. At least you have to enter at this low point to avoid trading failure, and if you are skilled at entering this low point, with fibonacci6180 technique, your reading skill to chart will be greatly improved.
If you want to do day trading, please set the time frame to 5 minutes or 15 minutes, and you will see many of the low point of rising stocks.
If want to prefer long term range trading, you can set the time frame to 1 hr or 1 day.

Trading idea - Entry point > 12.24/61.80%Trading Idea
1) Find a FIBO slingshot
2) Check FIBO 61.80% level
3) Entry Point > 12.24/61.80%
Chart time frame: D
A) 15 min(1W-3M)
B) 1 hr(3M-6M)
C) 4 hr(6M-1year)
D) 1 day(1-3years)
Stock progress: A
A) Keep rising over 61.80% resistance
B) 61.80% resistance
C) 61.80% support
D) Hit the bottom
E) Hit the top
Stocks rise as they rise from support and fall from resistance. Our goal is to find a low support point and enter. It can be referred to as buying at the pullback point. The pullback point can be found with a Fibonacci extension of 61.80%. This is a step to find entry level. 1) Find a triangle (Fibonacci Speed Fan Line) that connects the high (resistance) and low (support) points of the stock in progress, where it is continuously expressed as a Slingshot, 2) and create a Fibonacci extension level for the first rising wave from the start point of slingshot pattern.
When the current price goes over 61.80% level , that can be a good entry point, especially if the SMA 100 and 200 curves are gathered together at 61.80%, it is a very good entry point.
As a great help, tradingview provides these Fibonacci speed fan lines and extension levels with ease. So if you use the Fibonacci fan line, the extension level, and the SMA 100/200 curve well, you can find an entry point for the stock market. At least you have to enter at this low point to avoid trading failure, and if you are skilled at entering this low point, with fibonacci6180 technique, your reading skill to chart will be greatly improved.
If you want to do day trading, please set the time frame to 5 minutes or 15 minutes, and you will see many of the low point of rising stocks.
If want to prefer long term range trading, you can set the time frame to 1 hr or 1 day.

Long at 131.61 for a quick flipNothing special about this trade except that it was one of only 6 large cap stocks that registered as a buy for me today and was the best of the bunch, technically, imo.
Historically, the returns here are only about 20% better than an average market return per day, but using this trading technique, it has never lost money - 1027 wins, 0 losses (real and backtested) going all the way back to January of 1968. Having been through everything that 50+ year trading history threw at it and coming out perfect, I'm comfortable making this trade now.
Per my usual strategy, I'll add to my position periodically at the close on and I will likely use FPC (first profitable close) to exit any lot on the day it closes at any profit, though I have been playing around with a new exit strategy, so FPC may or may not be used - I'll have to see how things play out.
As always - this is intended as "edutainment" and my perspective on what I am or would be doing, not a recommendation for you to buy or sell. Act accordingly and invest at your own risk. DYOR and only make investments that make good financial sense for you in your current situation.

Lithium Americas Corp. (LAC) - LongLong entry at 2,52 USD with a stop loss 1,98 USD.
Profit taking: 4,14 USD, 6,71 USD and 10,55 USD.

Google stock oscillates below $170 after earnings releaseGoogle's stock managed to post a bullish gap of more than 3% in the last session, shortly after the company announced its quarterly results. Initially, it was reported that total sales for the last published quarter reached $90.23 billion, compared to the expected $89.12 billion. In addition, the company posted earnings per share of $2.81, beating expectations of $2.00. This positive outcome initially triggered a spike in investor confidence, but for now, the market sentiment has stabilized, and the stock is closing the week with a bearish candlestick on the chart.
Previous trendline break:
The recent consistent bullish movements in Google have been important in breaking a downward trendline that was previously dominant on the chart. For now, this has paved the way for a new bullish bias, and a new upward trendline could be forming, potentially becoming the most relevant technical structure for the stock in the coming sessions. However, it is important to note that this early bullish trendline still requires new price highs to confirm its strength.
ADX:
Although ADX oscillations remain above the neutral 20 level, the slope of the line has started to turn negative. This suggests that, despite the positive earnings, volatility may be beginning to decline, which could eventually lead to a sideways bias in the stock’s movements in the short term.
MACD:
The MACD histogram continues to show oscillations above the neutral 0 line, but it is becoming increasingly necessary for this to be sustained to confirm the buying strength reflected in the moving averages. If the MACD starts to decline, it could be interpreted as a bearish correction signal that may weigh on Google's price.
Key Levels:
$175: A relevant resistance aligned with the 100- and 200-period moving averages. Buying oscillations reaching this level could reactivate bullish momentum and give way to a new relevant uptrend.
$160: A nearby support zone aligned with the 23.6% Fibonacci retracement level. It could serve as a tentative barrier where potential short-term downside corrections might occur.
$143: A definitive support that coincides with the recent lows of the stock. A pullback toward this level could reactivate the previous bearish trend in this market.
Written by Julian Pineda, CFA – Market Analyst

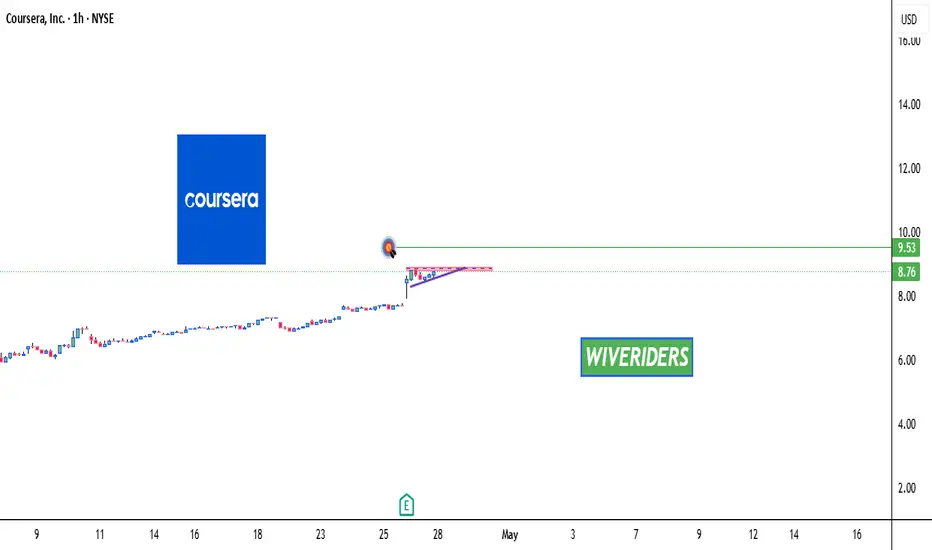
COURSERA Forming Bullish Continuation Patterns 🚨 $COURSERA Forming Bullish Continuation Patterns 🚨
$COURSERA is forming bullish continuation patterns and is approaching a key red resistance zone. A breakout above this level could signal a strong bullish move, with the first target at the green line level.
📈 Technical Overview:
Pattern: Bullish Continuation
Resistance Zone: Red area currently being tested.
🎯 Breakout Target: Green line level upon confirmation.
$AMD - Back above support, Daily & Weekly MACD Pressing HigherWe have 1Day and Weekly MACD's applying upward pressure now. Monthly timeframe is also fully reset. AMD is now back in above key support. Accumulate quickly.

Long CBOE at 211.42 - some stocks LOVE volatilityCBOE is a stock that has held up unusually well during the tariff tumult lately. It's not that surprising - they benefit from all the hedging that everyone is doing with options. It hasn't really done much substantively since September, call it a 7+ month consolidation after a 75% run-up from March of '23 to September of '24. That "nothing" is something for the trading I do, that benefits from "noise" rather than trend. I have traded CBOE multiple times over the last few months and unsurprisingly, given the chart and CBOE's history, they've all been wins.
Historically, this trading method is 394-0 (real and backtested trades) on CBOE, so I expect a win, even in this difficult market situation. The average gain is 1.16% in an average of 6 trading days - that's .19% per day or about 4x the average historical daily market return. It's not a flashy trade, but it has always been a profitable one, so I"m taking it here. Another plus is 4 consecutive down days, which usually is a good short term contrarian indicator.
Per my usual strategy, I'll add to my position at the close on any day it still rates as a “buy” and I will probably use FPC (first profitable close) to exit any lot on the day it closes at any profit, though depending on how things go, I may let it run a little.
As always - this is intended as "edutainment" and my perspective on what I am or would be doing, not a recommendation for you to buy or sell. Act accordingly and invest at your own risk. DYOR and only make investments that make good financial sense for you in your current situation.
