Chevron: The Chart’s Reaching a Critical PointChevron is starting to look very interesting again — but let’s be clear from the start: Chevron, like every oil giant, lives and dies by the price of oil. If oil rips higher or collapses due to global politics, supply shocks, or economic chaos, Chevron NYSE:CVX follows. No exceptions.
That said, what we’re seeing on the chart right now is increasingly pointing toward a deeper correction — specifically down to the $113–$100 zone. That would make sense structurally as a Wave 4 retracement.
But there’s a technical nuance here. Wave 1’s high sits at $103 — and depending on how strict your Elliott Wave rules are, Wave 4 dipping into Wave 1 is bad territory. Personally, I’m okay with a brief touch into that range, but I don’t want to see price hanging around below $103 for long.
From a trend perspective, we’re clearly in a downward channel. We just saw a textbook bull trap:
Chevron broke out with a solid +7% move over two weeks,
Followed immediately by a massive 22% drop,
One of the sharpest two-week declines since — yeah — March 2020, pandemic levels.
Now, price is hovering around $130, and the setup is simple:
If this level holds, great — maybe we’re bottoming.
If it breaks, I’m looking to buy between $113 and $100. That’s where the structure aligns, the volume kicks in, and risk/reward starts to make sense again.
So here’s the real question:
Do we see $200 first — or $100?
I’m leaning $100 first.
Not because I’m bearish long-term— but because that level would clean up the chart, shake out the noise, and give us a real shot at riding the next strong leg higher with conviction.
Would love to hear what you think — where’s your bet?

TTD could return 200% in the next yearsThe Trade Desk is this big American tech company that basically helps advertisers buy digital ads in a super smart, automated way. They run a platform (called a DSP, or Demand Side Platform) where brands and agencies can set up, manage, and optimize their ad campaigns across tons of channels—like websites, mobile apps, streaming TV, audio, you name it. They’re pretty much the biggest independent player in this space, competing with giants like Google and Amazon.
Now, about the stock crash ,things have been rough lately. Their share price tanked, and here’s why:
First off, their latest financial results were kind of a letdown. For the first time in over eight years , they didn’t hit their own revenue targets. Investors hate surprises like that, so the stock dropped hard, almost 30% in a single day.
On top of that, they’ve been rolling out a new AI-powered platform called Kokai, but apparently, there were some hiccups with the launch. The company admitted they messed up a bit on execution, which didn’t help investor confidence.
Another thing: their stock had gone up a ton last year, it more than doubled at one point. So when the results disappointed, people freaked out and started selling. The valuation was super high, and the market just corrected itself, wiping out a huge chunk of their market cap.
There’s also some bigger-picture stuff going on.
The ad industry is getting more competitive, with Google and Amazon pushing hard, and there are worries about the economy slowing down. Plus, new privacy rules and regulations are making things trickier for digital ad companies in general.
All this led to a bit of a panic, with people selling off their shares and the price dropping even more because of technical trading stuff.
Fortunately, the price stopped near the previous lows where there is a major support and this could be a masive opportunity for mid to long term investors seeking a low risk entry with a +200% returns opportunity. A Stop Loss under the supports would be fine to keep your money safe.
In short, The Trade Desk is still a major player in digital ads, but they hit a rough patch because of disappointing results, some mistakes with their new tech, and a reality check on their sky-high stock price. Some people still think they’ll bounce back if they fix these issues, but for now, it’s been a wild ride!

Tesla: At a Crossroads – Accumulation or Breakdown?One of the most talked-about stocks right now — Tesla NASDAQ:TSLA . And for good reason. Between the constant media buzz around Elon Musk and the recent surge in vandalism against Tesla vehicles, it’s been getting plenty of attention. But I’m not here to talk politics or headlines — I’m here for the chart.
And honestly? It’s looking better than you’d think. Despite all the noise, price has held steady in the $225 to $270 range, showing signs of a sideways accumulation phase — right at the Point of Control (POC) since 2021. That’s a pretty strong area, technically speaking.
Over the next few weeks, we’re likely to get clarity:
Either we break above $350, which opens up serious upside potential,
Or we break down toward the Volume Area Low — specifically the 2024 VAL at $161.18.
The real danger zone? Below $138. If price breaks that level, we have to assume that Wave 2 isn’t done yet — even though it was originally considered complete in 2023.
Until then, the structure actually looks constructive: we’ve been putting in higher lows and higher highs since 2023, which signals a potential uptrend.
How far that uptrend goes is hard to call. But if we break and hold above $325, then a pullback toward $300–$270 could offer a clean entry opportunity.
On the flip side, yes — if the market collapses and Wave II is still unfolding, we could be staring at $175, $125, or even as low as $75–$50 in an extreme scenario. And that would be wild for a stock that once touched $485.
But that’s why it’s crucial to zoom out. Ask yourself:
What do I want from Tesla — long-term conviction or short-term plays?
Then build your view. If the macro fits, dial into the lower time frames to find your edge. The setup is building — and it’s looking like Tesla is prepping for a big move.
Question is: which direction are you positioned for?

What Amazon’s Chart Says Ahead of Next Week’s Earnings ReportAmazon NASDAQ:AMZN has been reducing its exposure to U.S. tariffs on Chinese imports recently, and is also possibly slowing down its AI-related infrastructure purchases as the online-retail giant prepares to report Q1 earnings next week. What does fundamental and technical analysis say could happen next for the stock?
Let’s check it out:
Amazon’s Fundamental Analysis
AMZN plans to release its earnings after the bell next Thursday (May 1) in the middle of an interesting period for the company.
Published reports recently indicated that Amazon has been canceling orders from some Chinese vendors in a bid to avoid the Trump administration’s new 145% tariffs on the Asian nation’s goods.
After all, Amazon would be the "importer of record" for items purchased at the wholesale level, and that’s who actually gets Uncle Sam’s tariff bills.
Of course, the tariff situation remains murky, as the Trump administration appeared this week to seek a de-escalation of its trade wars with China and other countries.
Meanwhile, Wells Fargo this week released a research note implying that Amazon could possibly become the second hyper-scaler to slow down on AI-related infrastructure purchases.
The report posited that AMZN has put some leasing discussions for the co-location of its data centers on hold. If true, that would make Amazon the second hyper-scaler to ease AI-focused capital-expenditure spending, following the lead of its key cloud competitor Microsoft NASDAQ:MSFT .
However, TD Cowen published its own research note on Monday that offered a potentially different explanation of what's going on at Amazon.
Cowen agreed that AMZN has been walking away from some co-location deals, but argued that the change stems from Amazon shifting to a preference for operating its data centers on company-owned properties.
Cowen noted that Amazon “continues to move ahead with powered shells and self-builds." The firm also pointed out that other major hyper-scalers Meta Platforms NASDAQ:META , Alphabet NASDAQ:GOOG NASDAQ:GOOGL and Oracle NYSE:ORCL haven’t shown any signs of slowing down their collective appetite for securing increased capacity through co-location.
In fact, Amazon CEO Andy Jassy recently wrote in his annual letter to shareholders that generative AI “is going to reinvent virtually every customer experience we know and enable altogether new ones about which we've only fantasized.”
He also said that’s why Amazon’s Amazon Web Services cloud business is “quickly developing the key primitives (or building blocks) for AI development.”
Jassy said those efforts includes such things as “custom silicon AI chips in Amazon Trainium to provide better price-performance on training and inference, highly flexible model-building and inference services in Amazon SageMaker and Amazon Bedrock, our own frontier models in Amazon Nova to provide lower cost and latency for customers’ applications and agent creation and management capabilities."
Hmm, does that sound like a CEO who’s cutting back on AI investment? Not to me.
Jassy did say that chips or GPUs are the reason why Amazon’s AI investments are so expensive, but added that those costs should be headed lower in the future.
Why? Because the firm's own Trainium2 chips offer performance that is 30% to 40% better in some ways than what the firm is purchasing from exterior providers.
That might not be so great for Nvidia NASDAQ:NVDA , but it doesn't sound like a problem for Amazon.
All in, the Street is looking for Amazon to report about $1.36 of Q1 GAAP earnings per share on roughly $155 billion of revenue.
That would represent a 38.8% EPS gain compared to the company’s year-ago results of $0.98, as well as more than 8% y/y growth in revenues.
While many investors would view such year-on-year growth as reflecting a solid quarter, that would also mark a deceleration of growth rates for Amazon. After all, the company hasn’t seen less than 8.5% y/y sales growth for any single quarter since Q2 2022.
I also don't know if Amazon will issue any forward guidance given our current environment of unclear tariff policies.
Amazon’s Technical Analysis
Now let’s check out AMZN’s chart going back some seven months:
Readers will first see a sloppy-looking “head-and-shoulders” pattern that formed over recent months, marked with purple boxes above. That appeared to point to a bearish reversal.
In fact, that’s exactly what happened to Amazon, leading to a sell-off that bottomed out in early April at close to $161.
But interestingly, this pattern seems to have since morphed into a potentially bullish small “double-bottom” pattern (the black diagonal lines at right) that shows a $191 pivot at its conclusion. (AMZN was trading at $186.92 Friday morning.)
Amazon also appears to have suffered a so-called "death cross" in recent days without being adversely impacted.
A “death cross” occurs when a stock’s 50-day Simple Moving average (or “SMA,” marked with a blue line above) crosses below its 200-day SMA (marked with a red line above). This is historically a bearish signal -- but anecdotally, I’ve noticed that to be true less and less often with stocks of late.
Meanwhile, readers will notice that Amazon’s Relative Strength Index (the gray line at the chart’s top) is neutral, although rising.
Separately, the stock’s daily Moving Average Convergence Divergence indicator (or “MACD,” marked with gold and black lines and blue bars at the chart’s bottom) is postured rather bullishly.
True, Amazon’s 12-day Exponential Moving Average (or “EMA,” marked with a black line) and 26-day EMA (the gold line) are both below zero. That’s historically a bearish signal.
But on the positive side, that 12-day line is above the 26-day line, which is typically bullish. The histogram of Amazon’s 9-day EMA (the blue bars above) has also moved above the zero bound, which is also often a bullish sign.
(Moomoo Technologies Inc. Markets Commentator Stephen “Sarge” Guilfoyle had no position in AMZN at the time of writing this column.)
This article discusses technical analysis, other approaches, including fundamental analysis, may offer very different views. The examples provided are for illustrative purposes only and are not intended to be reflective of the results you can expect to achieve. Specific security charts used are for illustrative purposes only and are not a recommendation, offer to sell, or a solicitation of an offer to buy any security. Past investment performance does not indicate or guarantee future success. Returns will vary, and all investments carry risks, including loss of principal. This content is also not a research report and is not intended to serve as the basis for any investment decision. The information contained in this article does not purport to be a complete description of the securities, markets, or developments referred to in this material. Moomoo and its affiliates make no representation or warranty as to the article's adequacy, completeness, accuracy or timeliness for any particular purpose of the above content. Furthermore, there is no guarantee that any statements, estimates, price targets, opinions or forecasts provided herein will prove to be correct.
Moomoo is a financial information and trading app offered by Moomoo Technologies Inc. In the U.S., investment products and services on Moomoo are offered by Moomoo Financial Inc., Member FINRA/SIPC.
TradingView is an independent third party not affiliated with Moomoo Financial Inc., Moomoo Technologies Inc., or its affiliates. Moomoo Financial Inc. and its affiliates do not endorse, represent or warrant the completeness and accuracy of the data and information available on the TradingView platform and are not responsible for any services provided by the third-party platform.

4/25/25 - $pep - ST trade... *again* low $130s4/25/25 :: VROCKSTAR :: NASDAQ:PEP
ST trade... *again* low $130s
- have seemed to bottom tick entries in the past
- i "get" results "sucked", what's new in this environment for a co like this NYSE:PG results weren't much better IMHO
- but the global snack king is unlikely to be dethroned anytime soon
- 4.5% fcf yields legit
- mid teens PE too cheap, or closer to 20x debt-adjusted for great brands
- so swinging on the ST action
V

GE Healthcare Technology | GEHC | Long at $62.25GE Healthcare Technology $NASDAQ:GEHC. An aging and unhealthy population will only create an increased need for healthcare imaging services. Add AI to the diagnostic mix, and imaging will be imperative for routine health maintenance and screening. With a P/E of 15x, debt-to equity of 1x, earnings forecast growth of 8.36% per year, and bullish analyst ratings, this could be a good value play for the patient.
Thus, at $62.25, NASDAQ:GEHC is in a personal buy zone. Further drops are possible if trade wars make imaging materials/technology difficult to obtain, but that general statement applies to the whole market at this time...
Targets:
$70.00
$78.00

$NVDA forming local higher low and above 20-Day SMA NASDAQ:NVDA has traded very poorly recently. Today we are looking at a daily price chart of NASDAQ:NVDA and we have seen many lower lows and lower highs since GTC Conference. After touching the ATH of 150 $, the price is making new lows and has recently touched the lows of 85 $ and made new higher low of 95 $. So, this marks a double higher bottom and now the at 105 $ is now above 20 Day SMA. This might mark a bullish reversal in my opinion.
So why not a trade idea on a Friday. #TGIF. I say we go long NASDAQ:NVDA here and now. Remain long if it remains over the 50-Day, 100-Day and 200-Day SMA. 200-Day SMA ist currently @ 125 $. If NVDA has a weekly close above 125 $ then we go all in on $NVDA.
Verdict: Long NASDAQ:NVDA here until 125 $. Keep watching this space for next levels.

SAIA measured move LONGTypically when you see two corresponding measured moves you can expect a reaction.
Although this is a counter trend trade in the short term, im ok with it because the longer term prospects are good here.

Monday.com May Start MovingMonday.com has drifted for the last year, but some traders may think the business-software company is ready to start moving.
The first pattern on today’s chart is the bullish price gap on February 10 after earnings, revenue and guidance beat estimates. The shares touched their highest level since late 2021, only to decline with the broader market.
However, the slide wasn’t significant and MNDY stabilized at lows from January. The shallowness of the pullback may reflect a lack of selling pressure.
Second, the 50-, 100- and 200-day simple moving averages are virtually on top of each other. Does that long-term neutrality create potential for price expansion?
Next, MNDY has pushed above a falling trendline.
Finally, MACD is rising.
TradeStation has, for decades, advanced the trading industry, providing access to stocks, options and futures. If you're born to trade, we could be for you. See our Overview for more.
Past performance, whether actual or indicated by historical tests of strategies, is no guarantee of future performance or success. There is a possibility that you may sustain a loss equal to or greater than your entire investment regardless of which asset class you trade (equities, options or futures); therefore, you should not invest or risk money that you cannot afford to lose. Online trading is not suitable for all investors. View the document titled Characteristics and Risks of Standardized Options at www.TradeStation.com . Before trading any asset class, customers must read the relevant risk disclosure statements on www.TradeStation.com . System access and trade placement and execution may be delayed or fail due to market volatility and volume, quote delays, system and software errors, Internet traffic, outages and other factors.
Securities and futures trading is offered to self-directed customers by TradeStation Securities, Inc., a broker-dealer registered with the Securities and Exchange Commission and a futures commission merchant licensed with the Commodity Futures Trading Commission). TradeStation Securities is a member of the Financial Industry Regulatory Authority, the National Futures Association, and a number of exchanges.
TradeStation Securities, Inc. and TradeStation Technologies, Inc. are each wholly owned subsidiaries of TradeStation Group, Inc., both operating, and providing products and services, under the TradeStation brand and trademark. When applying for, or purchasing, accounts, subscriptions, products and services, it is important that you know which company you will be dealing with. Visit www.TradeStation.com for further important information explaining what this means.

NOW watch $805: Major resistance zone to break could pop 9%NOW is testing a key resistance zone at $804.36-806.76
Break-n-Retest may easily pop to target $884.44-886.81
Stop loss is also a good distance below at $753.37-758.73

CRM watch $236.70-239.08: Resistance flip to support for bottomCRM looking weak along with the tech sector.
Watching a key support zone at $236.70-239.08
Look for Break-n-Retest or consolidation above.
.
Previous Plots below:
Topping Call after Tariff Relief pump:
Bottom Call at $212:
Profit Taking levels after bottom pump
===========================================
.

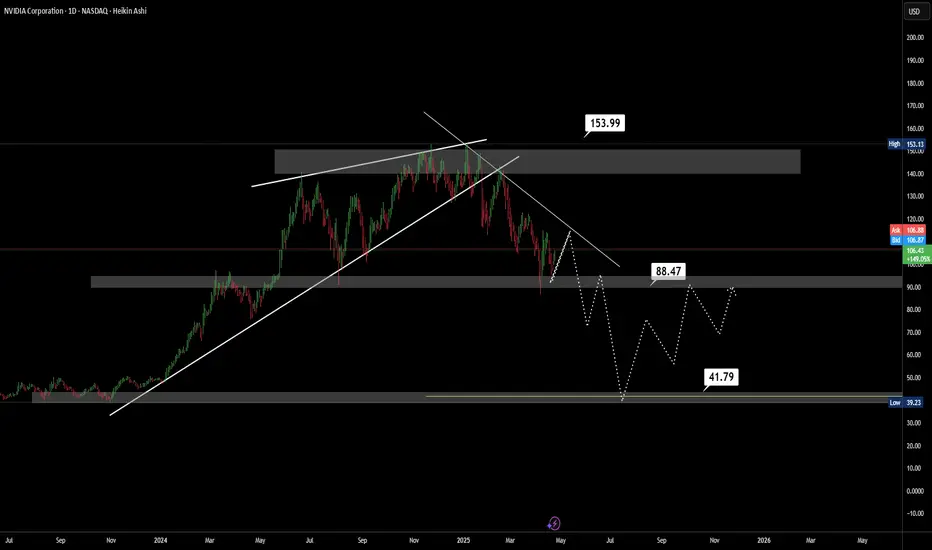
Bearish Continuation in PlayAfter an extended distribution phase near the premium zone and a clear break of the ascending channel, NVDA has shifted into a bearish market structure.
Price is currently pulling back into a key supply zone and retesting the bearish trendline. If this area holds, we could see further downside movement with the following targets:
🔻 $88.47 – potential support and short-term consolidation area.
🔻 $41.79 – medium-term target if bearish momentum continues and support breaks.
This bearish outlook remains valid as long as price stays below $153.99, which marks the invalidation level and the potential start of a bullish reversal.
🔍 Market structure is showing consistent lower highs and lower lows, confirming bearish pressure.
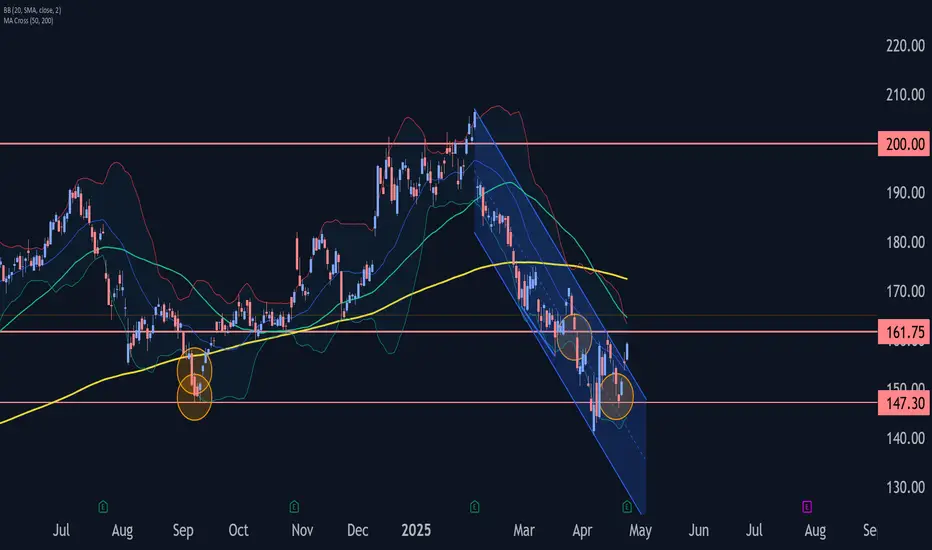
Google Wave Analysis – 25 April 2025
- Google reversed from the support zone
- Likely to rise to the resistance level 161.75
Google recently reversed sharply from the support zone between the long-term support level 147.30 (which has been reversing the price from September of 2024) and the lower daily Bollinger Band.
The price previously broke the resistance trendline of the daily down channel from February – which strengthened the bullish pressure on Google.
Google can be expected to rise toward the next resistance level 161.75 (top of wave 2 from the middle of April).
CMI - Cummins Inc. (2 hours chart, NYSE) - Long PositionCMI - Cummins Inc. (2 hours chart, NYSE) - Long Position; Short-term research idea.
Risk assessment: High {support & market structure integrity risk}
Risk/Reward ratio ~2.53
Current Market Price (CMP) ~ 293.45 {pre-market}
Entry limit ~ 288.50 to 285.50 (Avg. - 287) on April 25, 2025
1. Target limit ~ 294.50 (+2.61%; +7.5 points)
2. Target limit ~ 306 (+6.62%; +19 points)
Stop order limit ~ 279.50 (-2.61%; -7.5 points)
Disclaimer: Investments in securities markets are subject to market risks. All information presented in this group is strictly for reference and personal study purposes only and is not a recommendation and/or a solicitation to act upon under any interpretation of the letter.
LEGEND:
{curly brackets} = observations
= important updates
(parentheses) = information
~ tilde/approximation = variable value
-hyphen = fixed value

Alphabet Shares Surge 6% In Premarket Amid Earnings BeatShares of Alphabet Inc. (NASDAQ: NASDAQ:GOOG ) spike 6% in Friday's premarket session amidst earnings beat.
Google parent Alphabet (NASDAQ: NASDAQ:GOOG ) reported first-quarter revenue and profit that exceeded analysts’ expectations, sending shares higher in extended trading Thursday.
The tech giants reported revenue of $90.23 billion, up 12% year-over-year and above the analyst consensus from Visible Alpha.1 Net income of $34.54 billion, or $2.81 per share, compared to $23.66 billion, or $1.89 per share, a year earlier, also topping Wall Street’s estimates. Google Cloud revenue rose 28% to $12.3 billion, while Search & Other segment revenue grew 10% to $50.7 billion.
Alphabet also raised its quarterly dividend by 5% to 21 cents, and announced an additional $70 billion in stock buybacks. Alphabet's Class A shares rose close to 5% in after-hours trading. The stock was down about 16% for 2025 through Thursday’s close.
Alphabet Reiterates Spending Plans as AI Features Expand Reach and Engagement
CEO Sundar Pichai said Search growth was driven by "engagement we’re seeing with features like AI Overviews, which now has 1.5 billion users per month" after launching in May 2024.2
“We do see a tremendous opportunity ahead of us across the organization,” CFO Anat Ashkenazi said, adding that Alphabet ended the quarter with more Cloud demand than it had capacity.
Technical Outlook
As of the time of writing, shares of NASDAQ:GOOG are up 5% in Friday's premarket trading, bouncing off from the critical support zone of $146. NASDAQ:GOOG 's next top is the $200 resistant a move that will deliver a stunning 29% in gains. All present metrics are pointing to a bullish campaign, the asset is already trading below key moving averages giving NASDAQ:GOOG room to capitalize on this technical to make a comeback.

Stock Of The Day / 04.01.25 / ICCT04.01.2025 / NASDAQ:ICCT #ICCT
Fundamentals. Neutral news background.
Technical analysis.
Daily chart: Short Squeeze on 2nd day after a strong close in the previous session.
Premarket: Gap Up on increased volume.
Trading session : There was a pullback, which was stopped at the level of 3.70 after the initial impulse at the beginning of the session. After that, the price began to tighten to the level against the initial movement, making pullbacks, each subsequent one was smaller than the previous one. We are considering a long trade in case the level holds.
Trading scenario: pullback along the trend (false tightening) to level 3.70
Entry: 3.86 when trend line is broken upwards, tightening structure is broken
Stop: 3.66 we hide it below the level with a small reserve
Exit: Close part of the position after the impulse movement on increased volume at 12:00 p.m. We close the rest of the position at a price of 4.49 when exit down the trade range.
Risk Rewards: 1/3
P.S. In order to understand the idea of the Stock Of The Day analysis, please read the following information .

INTEL DROP --- FIELD COMM LOG #02242025🪖 WAR ROOM DISPATCH — FIELD REPORT FROM CAMP JARVIS & CAMP LIVERMORE
Date: 4/24/2025
Status: STANDBY
Volume: Normal
Current Order: HOLD
⚔️ SUMMARY OF ENGAGEMENTS – LAST 30 DAYS
The battlefield has been blood-red. Abnormal reactions litter the map. Morale was tested—but our troops never broke. The Red Army pushed hard, exploiting weakness, creating chaos. Yet we held.
📍Camp Jarvis
Coordinates: 115.10
☑️ Status: HOLD
📈 Trend: UPTREND
📊 ATR: Tightening (3.39)
🟩 Zone: Top of box: 115.10 | Bottom: 86.62
📢 Latest: “We’re nearing breakout. Position secure. Scouting volume now.”
Jarvis is seeing a shift—momentum is whispering beneath the soil. There's life stirring. But RSI is low (sub-45). This isn't the time for heroes—it’s a time for patience. Let the weak exhaust themselves.
📍Camp Livermore
Position: Natural Reaction Zone
☑️ Status: HOLD
📉 Trend: Weak uptrend but too early to act
🔄 Recent movement: Mixed signals, sporadic action, no confirmation.
Livermore's forces are strong in discipline, but not yet in numbers. They report: “Volume’s stable, but not convincing. We’ll move when the field confirms it—not before.”
📛 INTEL WARNING
The maps are clear—we are not in breakout yet.
There’s a false calm in the air.
Do NOT chase. Do NOT preempt.
This is how armies get slaughtered in the fog.
💡 Key Quote from Command:
“The Red Army still has strength. We’re holding—but holding isn’t winning. We wait for the flinch. The break. The rally cry. That’s when we move.”
🎖️ Current Position: HOLD
🛡️ Camp Jarvis: Monitoring breakout zone
🧭 Camp Livermore: Awaiting troop confirmation
📉 RSI low, Trend early
🔕 No All-Signal-Go confirmed
🚨 Mixed Signals = DO NOT ADVANCE
The war is not over.
But neither are we.

9 Simple Ratios Every Great Investor Uses - Buffett Included!Forget the hype, headlines, or hope. These 9 financial ratios are what real investors actually use to pick winners, but...
P/E? ROE? EPS? 🧐
- What are they, or better yet, WHO are they? 🤯
- How high is “too high”?
- Is a low number always good, or just a trap?
- Do all industries follow the same rules… or is that another myth?
Buffett. Greenblatt. Graham. Lynch.
They didn’t rely on vibes — they trusted fundamentals
After years of relying on charts, I built a 9-point fundamentals checklist to filter stocks faster and smarter. Now I’m sharing it with real-life examples and key insights to help you spot what really makes a stock worth owning:
Easy enough for new investors diving into fundamentals
Sharp enough to level up seasoned pros
Real enough to avoid hype
…but the truth is: these numbers did flag companies like Amazon, Apple, and Nvidia before the market gave them credit.
-----------------------------------------------------
✅ Quick Reference Table
Scan the table, then dive into the stories…
First Pro Tip: Bookmark this. You’ll check these before every stock pick.
-----------------------------------------------------
📊 1. P/E Ratio | Price-to-Earnings
What it tells you: How much you pay for each dollar of a company’s profit.
Short Example: A P/E of 20 means you pay $20 for $1 of profit. High P/E? Expect big growth or risk overpaying.
Strong: Between 15 and 25
Caution: Above 30 (unless fast growth)
Industry Averages:
- Tech: 25–40
- Utilities: 10–15
- Consumer Staples: 15–20
- Energy: 10–20
- Healthcare: 20–30
Story: In early 2023, NVIDIA’s P/E ratio hovered around 25, near the low end for tech stocks. Investors who saw this as a steal amid the AI boom were rewarded—NVIDIA’s stock made 4x by the end of 2024 as AI chip demand soared.
Contrast that with Tesla in Q1 2025, when its P/E spiked above 40 with slowing sales and Tesla’s stock dropped 50% in weeks.
Pro tip: A low P/E is not always good. If growth is weak or falling, it's often a trap.
Example: A utility company with a P/E of 30 is probably overpriced. A tech stock with 35 might still be fair — if growth justifies it.
-----------------------------------------------------
🧠 2. PEG Ratio | Price-to-Earnings-to-Growth
What it tells you: If a high P/E is worth it based on future profit growth. Whether the earnings growth justifies the price.
Short Example: A PEG below 1 means you’re getting growth at a fair price. High PEG? You’re overpaying.
Strong: Below 1
Caution: Above 2
Industry Averages:
- Software: below 1.5 is solid
- Consumer Goods: Below 2 is more realistic
- Tech: Below 1
- Consumer Staples: Below 1.5
- Healthcare: Below 1.2
- Financials: Below 1.5
- Energy: Below 1.3
Story: In mid-2022, Salesforce’s PEG was 0.8 (P/E 35, forward EPS growth 45%) as cloud demand surged. Investors who spotted this steal saw the stock climb 130% by the end of 2024. Meanwhile, Peloton in 2023 had a P/E of 20 but near-zero growth (PEG above 3). Its stock cratered -50% as fitness trends faded.
Story: NVIDIA’s PEG hit 0.9 in Q3 2023 (P/E 30, growth 35%) during AI hype, a steal for tech (average PEG below 1.2).
PEG filters hype. A stock can look expensive until you factor in growth.
-----------------------------------------------------
🧱 3. P/B Ratio | Price-to-Book
What it tells you: How much you pay compared to what the company owns (like buildings or cash).
Short Example: A P/B below 1.5 means you’re paying close to the company’s asset value. High P/B? Expect strong profits or risk.
Strong: Below 1.5
Caution: Below 1 + poor earnings = value trap
Industry Averages:
- Banks: Below 1.5
- Insurance: Below 1.3
- REITs: Use NAV (aim below 1.2)
- Tech: Often ignored
- Energy: Below 2
Story: In 2024, JPMorgan Chase’s P/B was 1.4, solid for banks (average below 1.5). Investors who bought enjoyed 100% gains.
n 2023, Bed Bath & Beyond’s P/B fell below 1 with collapsing earnings. It looked cheap but filed for bankruptcy that year.
Tip: Only use this in asset-heavy sectors like banking or real estate.
-----------------------------------------------------
⚙️ 4. ROE | Return on Equity
What it tells you: How well a company turns investor money into profits.
Short Example: An ROE above 15% means the company makes good money from your investment. Low ROE? Weak returns.
Strong: Above 15%
Caution: Below 10% unless in slow-growth industries
Industry Averages:
- Tech: 20–30%
- Consumer Staples: 15–25%
- Utilities: 8–12%
- Financials: 10–15%
- Healthcare: 15–20%
Story: Coca-Cola (KO) has kept ROE above 35% for years, a sign of brand power and pricing strength.
Eli Lilly’s (LLY) ROE stayed above 25% from 2022–2024, a healthcare leader (average 15–20%). Its weight-loss drug Mounjaro drove consistent profits, lifting the stock 150%+ in two years. Checking ROE trends helped investors spot this winner.
Tip: If ROE is high but D/E is also high, be careful, it might just be leverage.
-----------------------------------------------------
💰 5. Net Margin | Profitability
What it tells you: How much profit a company keeps from its sales or what % of revenue ends up as pure profit.
Short Example: A 10% margin means $10 profit per $100 in sales. Low margin? Tough business or high costs.
Strong: Above 10-15%+
Caution: Below 5%
Industry Averages:
- Software: 20–30%
- Retail: 2–5%
- Manufacturing: 8–12%
- Consumer Staples: 10–15%
- Energy: 5–10%
- Healthcare: 8–15%
Story: Walmart’s (WMT) 2% net margin looks tiny — but it’s expected in retail.
A software firm with 5%? That’s a warning — high costs or weak pricing.
In 2023, Zoom’s (ZM) net margin fell to 5% (down from 25% in 2021), well below software’s 20–30% average. Pricing pressure and competition crushed its stock quite a lot. Meanwhile, Apple’s 25% margin in 2024 (tech average 20%) remained a cash cow.
Tip: Margins show whether the company owns its pricing or competes on price.
-----------------------------------------------------
💣 6. D/E Ratio | Debt-to-Equity
What it tells you: How much debt a company uses compared to investor money.
Short Example: A D/E below 1 means more investor cash than debt. High D/E? Risky if profits dip.
Strong: Below 1
Caution: Above 2 (except REITs or utilities)
Industry Averages:
- Tech: 0–0.5
- Industrials: 0.5–1.5
- REITs: 1.5–2.5 (manageable due to structure)
- Utilities: 1–2
- Energy: 0.5–1.5
Story: In 2024, Tesla’s D/E dropped below 0.3 (tech average 0–0.5) as it paid down debt, signaling strength despite sales dips - a massive rally afterward.
Tip: Rising debt + falling profits = a storm coming. Always check both.
-----------------------------------------------------
💵 7. Free Cash Flow (FCF)
What it tells you: Cash left after paying for operations and growth investments.
Short Example: Apple’s $100 billion cash pile in 2024 funded stock buybacks, boosting shares. Low cash? Trouble looms.
Strong: Positive and growing
Caution: Negative for multiple years
Sector notes:
- Tech: Lots of cash (think billions)
- Industrials: Up and down, check trends
- REITs: Look at FFO (cash from properties), aim high
- Energy: Has cash, but swings with oil prices
- Healthcare: Steady cash, not too high
Story: Netflix had negative FCF while scaling content. Once costs stabilized, FCF turned positive and stock re-rated sharply.
Pro tip: Profits don’t mean much without real cash. FCF is often more honest.
Cash is king: Companies need cash to pay bills, reduce debt, or fund growth. If FCF is falling, they might be burning through cash reserves or borrowing, which isn’t sustainable.
Potential issues : This mismatch could signal problems like poor cash collection, heavy spending, or even accounting tricks to inflate profits.
-----------------------------------------------------
🚀 8. EPS Growth | Earnings Power
What it tells you: How fast a company’s profits per share are growing.
Short Example: EPS up 10% yearly means more profit per share, lifting stock prices. Flat EPS? No growth, no gains.
Strong: Above 10%
Caution: Below 5%, flat/negative for 3+ years
Industry Averages:
- Tech: 15–30%
- Staples: 5–10%
- REITs: 3–6% (via FFO growth)
- Healthcare: 10–15%
- Financials: 5–10%
- Energy: 5–15% (cyclical)
Story: In Q1 2024, NVIDIA’s forward EPS growth of 30% (tech average 20%+) fueled a rally as AI chips dominated. Checking forward estimates helped investors avoid traps like Intel, with flat EPS and a drop.
Pro tip: A stock with flat EPS and no dividend? There’s no reason to own it.
-----------------------------------------------------
💵 9. Dividend Yield | Passive Income
What it tells you: How much cash you get yearly from dividends per dollar invested.
Short Example: A 3% yield means $3 per $100 invested. High yield? Check if it’s sustainable.
Good: ~3–4%
Red Flag: Above 6% with a payout ratio above 80-90%
Industry Averages:
- Utilities: 3–5%
- REITs: 3–6%
- Consumer Staples: 2–4%
- Tech: 0–2%
- Energy: 2–5%
-----------------------------------------------------
💡 Final Thought: How to Use All of This
Top investors don’t use just one metric. They look at the whole picture:
Good growth? Check PEG.
Good profits? Confirm with ROE and margin.
Safe balance sheet? Look at D/E and cash flow.
Fair valuation? P/E + FCF Yield + P/B.
Real power = Combining metrics.
A company with P/E 15, PEG 0.8, ROE 20%, low debt, and positive FCF? That’s your winner.
A stock with P/E 8, but no growth, high debt, and negative cash flow? That’s a trap.
-----------------------------------------------------
Real-World Combos
🎯Winners:
Tech Gem: P/E 20, PEG 0.8, ROE 25%, D/E 0.4, growing FCF, EPS 20%+ (e.g., NVIDIA 2023: AI-driven growth, stock soared).
Energy Steal: P/E 15, P/B 1.5, FCF positive, Dividend Yield 3.5% (e.g., Chevron 2023: Cash flow king).
⚠️Traps:
Value Trap: P/E 8, flat EPS, D/E 2.5, negative FCF (e.g., Peloton 2023).
Overhyped Tech: P/E 50, PEG 3, Net Margin 5%, D/E 1.5 (e.g., Rivian 2024).
-----------------------------------------------------
🚀 Share your own combos!
What do you personally look for when picking a stock?
If you spotted something off in the numbers, or have a valuable insight to add — please, drop it in the comments.👇
💡 Let’s turn this into a thread that’s not just good but superb and genuinely helpful for everyone.
-----------------------------------------------------
Final Thought
“Buy great companies at fair prices, not fair companies at great prices.” – Warren Buffett
This guide gives you the map.
Charts, tell you when.
These numbers tell you what, and why.
And this post?
It’s just the beginning!
These 9 metrics are part one of a bigger series I’m building — where we’ll go even deeper, with more advanced ratios, smarter combos, and real case studies.
If this guide helped you see financial numbers a little clearer, there’s a good chance it’ll help your investor friend too, especially if they’re just starting their journey...🤝Share it with them!
I built this as much for myself as for anyone else who wants to get better.👊
If you made it this far — thank you! 🙏
...and super thankful if you hit "The Boost" on this post 🚀
Cheers,
Vaido

CRML: The first kiss Stragety!CRML: The first kiss Stragety!
-Bottom confirmed!
-Demand confirmed with large vol and spread!
-Backtest with low supply vol, chance to enter here!
.
Wait and see!

Why Coinbase (COIN) Shares Are RisingWhy Coinbase (COIN) Shares Are Rising
As the Coinbase (COIN) stock chart shows, trading closed yesterday above the $200 mark — for the first time since March.
Since the beginning of April, COIN's share price has risen by nearly 20%, while the S&P 500 index (US SPX 500 mini on FXOpen) has declined by approximately 2%.
Bullish Drivers Behind COIN’s Price Rise
According to media reports, several factors are contributing to the bullish momentum:
→ Yesterday’s announcement that Coinbase and PayPal are expanding their partnership in the areas of crypto payments and decentralised finance (DeFi). The collaboration aims to increase the adoption of the PYUSD stablecoin and integrate it into merchant settlements.
→ The anticipated adoption of US stablecoin legislation, designed to establish a regulatory framework for the use of stablecoins. This is being supported by the Trump administration’s progressive stance on cryptocurrencies, including the appointment of crypto-friendly officials, the creation of a strategic crypto reserve, and other pro-crypto initiatives.
Technical Analysis of COIN Stock
The psychological level of $150, which served as strong support in 2024, has proven resilient again in April 2025. However, despite the rapid rise in price from $150 to $200 in under three weeks, there are reasons to believe that bullish sentiment may begin to fade:
→ The COIN share price remains within a downward trend, highlighted by a channel originating in early 2025.
→ The upper boundary of the channel may act as a resistance level.
→ Bears have previously demonstrated control in the $225–240 zone, where the price declined sharply (marked with a red rectangle).
This article represents the opinion of the Companies operating under the FXOpen brand only. It is not to be construed as an offer, solicitation, or recommendation with respect to products and services provided by the Companies operating under the FXOpen brand, nor is it to be considered financial advice.

Monitoring to Entry – AN/PAGThis pair was added to our Awaiting Confirmation list on April 16 , after showing a potential setup for a long position based on price deviation.
As of April 17 , the setup evolved further:
The pair Started below the lower Bollinger Band , suggesting continued price dislocation.
Stochastic %K and %D were both under 20 , indicating an Oversold condition.
ADX = 12.0 – signaling a sideways market, favorable for mean reversion.
DI-/DI+ ratio = 1.86 – still shows dominance of sellers, but that value improved (decreased) from the previous day.
A strong bullish candle appeared, reinforcing the shift in momentum.
Conclusion:
Although not all indicators were aligned perfectly, the price structure and early momentum reversal were enough for me to trigger a long entry as of April 17.
Now, I am monitoring this position with close attention to DI dynamics and further stochastic confirmation.

SBUX Earnings📉 SBUX – Descending Flag Breakdown Confirmed
The Selloff Structure is Set. The Next Leg May Be Swift.
What we’re seeing here is a classic case of nested bearish structure across multiple timeframes:
🔻 Descending Flag (Daily & 4H)
— Continuation patterns stacked on each other
— Lower highs, lower lows compressing price toward collapse
📊 Volume Confirms
— Volume tapering inside flag = exhaustion
— Delta volume: –23.5% → distribution is real, not a fade
⚠️ No Bullish Divergence
— Momentum remains bearish
— No MACD support, no RSI rebound — nothing to slow the slide
🎯 Price Map
$83.86 = current
$64 = next major structure
$59 → ultimate support test
$53 → breakdown zone if earnings disappoint
🧠 Thesis:
This isn’t a random dip — it’s a systematic unwind.
Franchise closures, margin compression, and retail tightening are feeding a fundamental downgrade beneath a clean technical signal.
I'm positioned for further breakdown.
Earnings could be the trigger.
And I don’t want the reversal. I want the flush.
🧱🦅📉
Let the structure do its job.
#SBUX #ShortSetup #BearishFlag #BreakdownTrade #TradingViewAnalysis

TSLA has formed a Triple Bottom patternOn the daily chart, TSLA stabilized and rebounded from the low level, and the short-term market formed a potential triple bottom pattern. At present, attention can be paid to the resistance near 291.8. A breakthrough will start to rise, and the upper resistance is concerned about the 348.0-367.3 area.
