DOCU eyes on $81.72: Break should pop >9% to Golden GenesisDOCU recovering well, as a tariff-proof business.
Currently testing a proven Genesis fib at $81.72
Likely to dip a bit, or look for Break-and-Retest.

Acadia Healthcare Company | ACHC | Long at $21.98Acadia Healthcare's NASDAQ:ACHC stock has fallen nearly -76% in a year, primarily due to weak 2024 results, missed revenue and EPS expectations, and a soft 2025 revenue guidance. Ongoing federal investigations into billing practices and lawsuits have further eroded investor confidence. However, it is currently trading at a price-to-earnings ratio of 7.42x and earnings are forecast to grow 7.07% per year. The profitable company is trading at a good value compared to other healthcare companies. Debt-to-equity is relatively low (0.64x), but legal risks (DOJ probe, lawsuits) strain margins.
The stock has entered my "major crash" simple moving average territory and there is a lot of downward / selling pressure. But, more often than not, this area (which... I caution... still extends down near $16) can often signal a temporary or longer-term bottom. Personally, this is a buy area ($16-$21) even if it turns into a short-term bounce in 2025. But I believe the overall market moves in the S&P 500, etc. will guide this stock more than anything at this point (unless more bad news about the company emerges).
One thing to note is that there are open price gaps on the daily chart near $17, $10, and $8. These gaps, which often (but not always) get closed in the lifetime of a stock, are a potential signal for further declines - at least at some point. There could be a drop near $16, then a $10-$20 bullish price increase after that, followed by more declines (trapping investors). Time will tell, but NASDAQ:ACHC is currently attractively valued. From a technical analysis standpoint, it is in a personal "buy zone", even if purely for a swing trade.
Targets:
$27.00
$33.00
$39.00


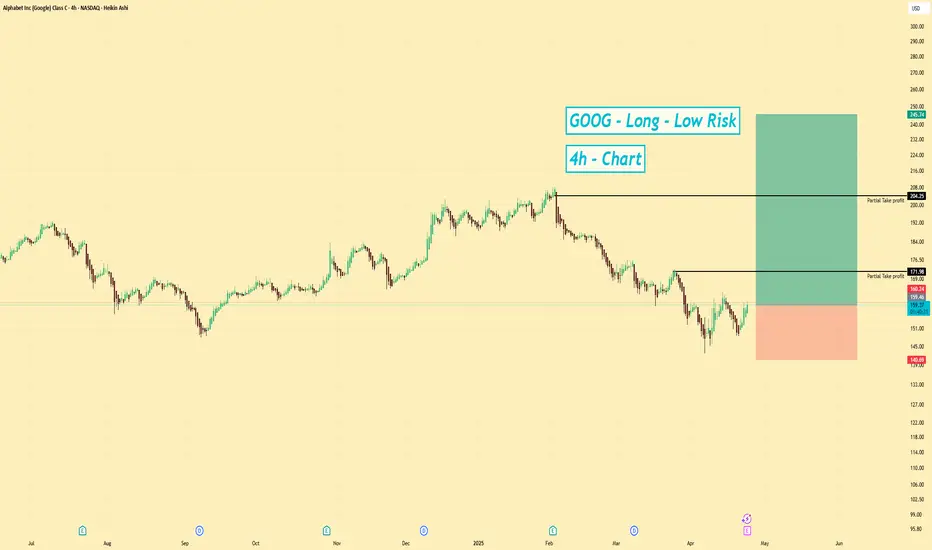
GOOGL | Long | Strong Fundamentals | (April 2025)GOOGL | Long | Strong Fundamentals + Technical Support | (April 2025)
1️⃣ Insight Summary:
Google (GOOGL) is showing strong fundamental performance with healthy earnings, a growing outlook, and a technically supportive zone. It’s currently sitting at $159, and based on both macro trends and chart structure, there’s potential for a move higher.
2️⃣ Trade Parameters:
Bias: Long
Entry: Around $159
Stop Loss: $140
TP1: $160 ✅ (light partial)
TP2: $200 ✅ (major target)
Ultimate Target: $250 🏁
Partial Exits: 25% at each target level to manage risk and lock in gains.
3️⃣ Key Notes:
🔹 Fundamentals are solid: Google has a net income of $100B and EPS around $8, with a growing outlook.
🔹 Dividend yield is modest at 0.51%, but it's backed by $28B in debt and strong cash flow.
🔹 Technically, GOOGL is trading in a supportive zone and could revisit previous highs around $200+.
🔹 Market cap sits at $2T, showing investor confidence.
🔹 Watch the broader market (e.g., SPX, NQ) for sentiment shifts that could impact tech stocks.
4️⃣ Follow-up:
Will review this trade setup and update if price approaches $200 or reacts at key levels.
Please LIKE 👍, FOLLOW ✅, SHARE 🙌 and COMMENT ✍ if you enjoy this idea! Also share your ideas and charts in the comments section below! This is best way to keep it relevant, support us, keep the content here free and allow the idea to reach as many people as possible.
Disclaimer: This is not a financial advise. Always conduct your own research. This content may include enhancements made using AI.

NVDIA Short to T1 2 Setups here.
- Both T1 and T2 will be hit as part of my price return to zero system (inflexion points).
- I'm shorting to T1 first and then reverse into long for T2. If it heads to T2 first I'll simply stay in my original T1 short for the duration.
It is of course easy to say that this will either go up or down :-). My system defines targets and there is no rules to say that can only produce a target in one direction. Based on what I see I know with around 95% accuracy that it will hit both with a reasonable timescale. I just don't know which one comes first :).
Either way I'm shorting to T1 in the first instance. It may hit T2 first but that doesn't bother my trading as I still expect T1. I won't go down the route of a martingale to T! if it goes to T2 first!! that's just asking for trouble regardless of confidence levels!

LOGI watch $75.95-76.48: Major Resistance to the recovery waveLOGI trying to recover along with the general market.
Currently test a proven resistance zone $ 75.94-76.48
Looking for a Break-n-Retest of the zone for long entries.

INTU watch $607-610: Double Golden zone and Major Milestone INTU recovering nicely and is pretty much tariff-proof.
Currently testing a Double Golden zone $ 606.75-610.16
This if often a major milestone in the lifetime of any asset.

MSFT is losing key levelsMicrosoft has lost some very important support levels. After falling by 10%, it rebounded to the former support area, which is now acting as resistance. Many investors took advantage of this move to exit at a better price than we saw recently. Unless the stock moves back above this level, the outlook for MSFT remains bearish, and we may soon see further surprises in the US tech sector.

LanzaTech (LNZA). Extremely oversold! Rally incoming?NASDAQ: LanzaTech (LNZA) , based in Illinois, USA, has recently has seen a price low of $0.1401 . This waste management company in recent times, has been featured as a top pick for buys by various news outlets. Although in an extremely bearish slump, I have a bullish prediction.
In the technicals on the 1 Day Chart , the RSI appears to be indicating oversold , with a slight potential of more of a dip to come. The Stochastic seems to also be indicating oversold market conditions. A long time frame bullish RSI divergence also appears to be forming starting at the middle of Feb 2023.
LanzaTech recently declined a "lowball" offer for $0.02 a share, which could signal insider bullish sentiment. LanzaTech FY25 Q1 earnings are forecasted to be significantly higher than FY24 Q4 at this time (RH). Their website, marketing and twitter appear to show no real signs of slowing business operations in my opinion.
Analysis also appears shows that there is very little open interest on put options at this time. Conversely there seems to be a large number of call options from $1-$7 expiring in the near future signaling institutions and high profile traders may be entering the market quietly.
Given the above signals and analysis I personally am setting a speculative stretch price target of $7 with various other orders taking profit along the way at key strike price cluster levels. With LanzaTech at a discounted price, a buy now could yield significant results.
Anything can happen in the markets. What do you think? Will LanzaTech recover? Or will value become completely wiped out?
Disclaimer: Not Financial Advice

ROK eyes on $245: Key Resistance break may Mark bottomROK trying to recover along with the general market.
Now testing a well proven resistance at $243.94-245.03
Look for a Break-and-Retest for possible long term entry.

$GOOGL primed for a BIG MOVE!NASDAQ:GOOGL primed for a BIG MOVE! 🚀
Heading into earnings, this stock’s valuation has been overlooked—but strong results could flip the narrative fast! 💨
✅ Bounced off 2021 highs
✅ RSI at its lowest since COVID
✅ Major indicators curling upward
✅ Volume shelf launch incoming
✅ Wr% pendulum swinging
Momentum is building—are you ready? 👀
Not financial advice

Meme Camera CrazeThe meme stock phenomenon has erupted several times in recent years: in the 2021 wave, the share prices of GameStop (GME), AMC Entertainment, and other small-cap companies nearly exploded almost unexpectedly due to the coordinated buying by the Reddit / r/WallStreetBets communities. A March 2025 analysis finds that the essence of meme stocks is that retail investors’ “viral” popularity on social media drives sudden surges in trading volume and explosive price spikes—often independently of the companies’ fundamental metrics. One hallmark of these firms is extreme volatility: dramatic price swings over short periods, driven more by social-media sentiment and coordinated buying pressure than by classic financial analysis.
GoPro (GPRO)—known for its action cameras—has exhibited large price swings without any fundamental corporate events. Analysts note that GoPro has become a “Robinhood favorite” and is increasingly treated as a new “play” on Reddit forums. This study examines GoPro from four angles: the impact of social media on its stock movement, its price volatility and speculative waves, the role of high short interest, and the activity of retail-investor forums (e.g., Reddit WSB).
Social Media Impact on Stock Movement
Social media and online forums are critical for meme stocks: TradingSim highlights that these stocks’ prices and volumes are strongly shaped by retail-investor social-media activity, resulting in highly volatile, sudden price jumps. GoPro is no exception. A Nasdaq/Motley Fool analysis reports that in the first week of March 2021, GoPro shares rose 13%, then jumped another 10.3% in a single day—even though no material company-specific news was released. This spike was attributed to high (~10.5%) short interest and WallStreetBets attention.
Retail day traders are thus hunting new names, and GoPro often tops their lists: “retail investors are on the lookout for fresh picks, and GoPro seems to fit the bill,” one WSB comment noted. A MarketBeat/Entrepreneur article emphasizes that meme stocks are frequently discovered through social-media buzz, triggering swift volume surges and price explosions regardless of fundamentals. Clearly, GoPro’s price can be moved at any time by unexpected social-media waves.
Price Volatility and Speculative Waves
GoPro’s share price shows sharp swings—“roller-coaster” moves with double-digit daily gains and pullbacks. For example, the Nasdaq article above notes the stock climbed 13% within a week and jumped another double digit in one day. This is typical of meme stocks: one day, FOMO drives the price up; the next, profit-taking or short selling unleashes a crash. TradingSim also points out that meme-stock volatility often detaches from traditional factors and instead hinges on social-media sentiment.
Furthermore, GoPro’s fundamentals rarely explain short-term moves. In March 2021 there was no significant operational news, yet a major rally occurred. On the other hand, the long-term trend has been weak: in 2024 the stock fell nearly 65% by year-end, reflecting broader market headwinds and underscoring that speculative waves alone can’t sustain growth. (Worth noting, some analysts expect improved sales in 2025.) Overall, GoPro’s short-term price action mirrors retail-investor sentiment swings more than corporate performance.
High Short Interest and Its Role
Meme stocks typically feature notably high short interest, amplifying speculative risk and setting the stage for short squeezes. TradingSim explains that high short interest in such names often primes them for squeezes if buying momentum builds. GoPro carried around a 10–14% short float in early 2021—comparable to Bed Bath & Beyond at the time—and as of spring 2025 still sits at roughly 8.1% short float, which is high (many blue-chip stocks run only 1–3%).
These figures imply that sudden retail buying can force shorts to cover, generating further upward pressure. Nasdaq’s analysis underlines that GoPro’s 10.5%+ short float in March 2021 likely fueled its rally as shorts rushed to close positions. SEC reports caution that high short-interest stocks are prime targets for coordinated retail actions aiming for squeezes. Thus, GoPro’s relatively high short interest joins it to the classic meme-stock hallmarks.
Retail Investor Community Activity (Reddit, WallStreetBets)
Online retail-investor forums remain central to GoPro’s hype. Reddit’s r/WallStreetBets community regularly seeks new “meme plays,” and GoPro often surfaces in their discussions. Analyses find that these groups can mobilize rapidly, generating massive buying pressure that produces market-disrupting moves, including repeated short squeezes. Experts argue that successful meme-stock trading almost requires active monitoring of Reddit/WSB and similar channels.
GoPro’s coverage on these forums—through posts and user-generated analyses—keeps it in retail traders’ sights. While the tone is often ironic and slang-laden (“hold,” “ape,” etc.), their impact is real: TradeSim notes that social-media sentiment drives meme markets more than financial fundamentals. Whether the GoPro hype continues is uncertain, but retail attention remains high and the potential for coordinated actions endures.
Conclusions
Our analysis shows that GoPro exhibits multiple characteristics of famous meme stocks like GameStop and AMC:
Social Media Impact: GoPro’s price often reacts sharply to retail communities’ buzz. It features as a Robinhood favorite and is increasingly discussed on Reddit, meaning a single WSB post or media mention can trigger broad buying waves.
High Volatility: GoPro shares can swing 10–15% in a single day, despite stable corporate metrics—mirroring the dramatic moves typical of meme stocks.
Elevated Short Interest: With past floats above 10% and current levels near 8%, GoPro’s short interest is high enough to enable potential short squeezes—one of the core traits identified during the GameStop–AMC saga.
Active Retail Forums: Beyond WSB, other investor groups actively discuss GoPro. Research shows that following Reddit and similar channels is crucial for participating in meme-stock rallies, and GoPro remains a popular target for these coordinated efforts.
In sum, GoPro’s price behavior aligns closely with the speculative patterns of top meme stocks: it is highly susceptible to social-media hype, shows extreme volatility, carries high short interest, and enjoys active retail-investor coordination. Investors attracted to GoPro for its meme-stock profile should be aware that they are betting on sentiment-driven swings, which can yield rapid gains or steep losses. Nonetheless, by these metrics, GoPro can justifiably be regarded as a meme stock in its own right.
Sources Used:
This study draws on key analyses showing that meme stocks’ prices and volumes are driven by social-media activity. GoPro’s specific examples are supported by financial reports from Nasdaq, Motley Fool, and other outlets.

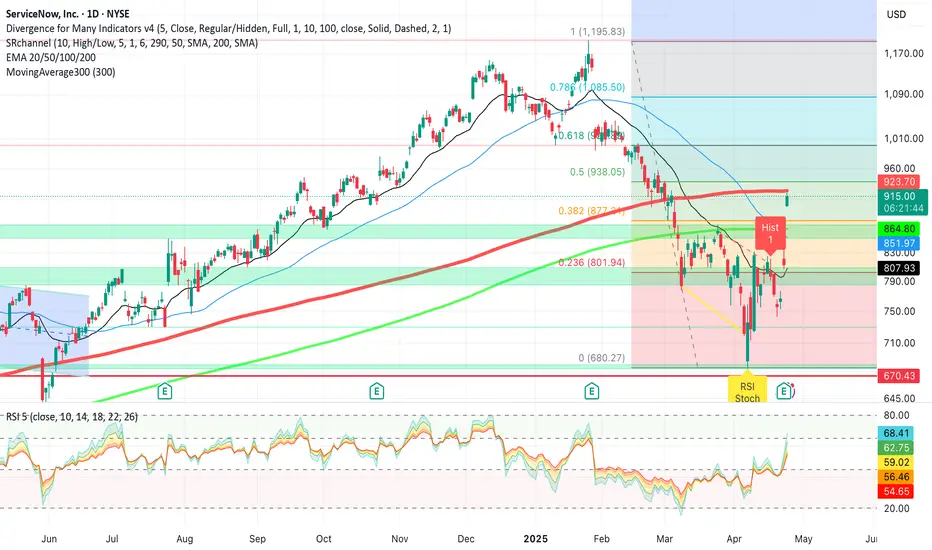
Bullish momentum in $NOW! 22% Upside🔥 Bullish momentum in $NOW!
🚀 $1,126 on the horizon! 🎯
✅ Indicators curling upward
✅ Volume shelf ready to launch
✅ Wr% swinging green to red
✅ Great earning/ guidance
Big move loading—are you in? 👀
Not financial advice

AT&T I Tipping Point : Short Opportunity with Head & ShouldersHey traders after a previous trade trade on the hood hitting targets of 16.4%. Today I bring you NYSE:T
Technical + Fundamental View
Pro Tip
- Breakdown below the Entry Line will be considered at Trade Initiation. (Risky Traders)
R:R= 5.4
- Rest can follow entry at day close post breakdown SL above Entry Candle.
- The Breakdown Below the Entry Line will confirm the head and shoulder pattern
Entry Line - 26.93
Stoploss - 27.53
Target 1 - 25.59 (Neckline of head and shoulder)
Target 2 - 24.74
Target 3 - 23.68
Technical View
- Head And Shoulder on Daily Time frame
- On the hourly timeframe, the chart looks weak, showing a potential double top pattern where the second peak is lower than the first, indicating growing investor fear.
Fundamental View
- High Debt: Over $140 billion in debt limits investment capacity and consumes significant cash flow.
- Network Issues: Poor service quality and outages risk losing customers to competitors.
- Strong Competition : T-Mobile and Verizon offer better plans, making customer retention harder.
- Market Saturation: The U.S. wireless market is nearly saturated, limiting new customer growth.
- Execution Risks: Growth and debt reduction depend on flawless asset sales and network upgrades; delays could harm finances and stock performance.
Additional Considerations
- AT&T’s valuation is higher than some peers, potentially capping upside.
- Telecom market competitiveness means growth hinges on successful 5G and fiber rollouts.
- Dividend yield (~3.9%) is attractive but lower than some rivals, which may impact income investors.

$PLTR momentum is heating up - ATH's INBOUND!🔥 NASDAQ:PLTR momentum is heating up!
All-time highs on the horizon! 🎯
✅ Indicators curling bullish
✅ Volume Shelf ready to launch 🚀
✅ Wr% pendulum swinging in favor
Big move incoming—are you in? 👀
Not Financial Advice

Understanding Market Types in Drummond GeometryThe 5 Market Types:
1️⃣ Congestion Entrance – The market slows down after a trend and starts moving sideways.
2️⃣ Congestion Action – Prices oscillate within a range, with no clear trend direction.
3️⃣ Congestion Exit – The market breaks out of congestion, starting a new trend.
4️⃣ Trending – Prices move in a clear direction, either up or down.
5️⃣ Trend Reversal – A trend suddenly shifts in the opposite direction.
🔥 The 3 Close Rule for Trends
A trend is defined when the PL Dot (a short-term moving average) remains on one side of the close for three consecutive bars. If this happens, the market is in a trend until congestion begins.
📌 Congestion Entrance: The First Sign of a Trend Change
A congestion entrance occurs when the PL Dot switches sides relative to the close. This signals that the market is entering a sideways phase. Until the next trend establishes itself, the market will stay in congestion.
🔹 How to spot it?
If a trend slows down and price closes on the opposite side of the PL Dot, it is the first bar of congestion.
The market remains in congestion until a new 3-close trend forms.
📌 Congestion Action: The Market Moves Sideways
During congestion action, prices move back and forth between support and resistance without breaking out. The PL Dot is often flat, and traders look for signals of continuation or breakout.
🔹 How to trade it?
Identify strong support & resistance levels.
Trade within the range (buy low, sell high).
Watch for signs of congestion exit (breakout).
📌 Congestion Exit: The Breakout Phase 🚀
A congestion exit happens when the market leaves congestion and starts a new trend. This is one of the most profitable trading opportunities.
🔹 How to spot it?
Price breaks above resistance or below support.
The PL Dot starts moving in a clear direction.
The market closes outside the congestion range.
🔹 How to trade it?
Enter after a confirmed breakout.
Use PL Dot & support levels to manage risk.
Pyramid your position if the trend continues strongly.
📌 Trending Market: The Sweet Spot for Traders 📈
Once the market has exited congestion, it enters a trend. This is when traders can ride momentum and maximize gains.
🔹 How to trade a trend?
Enter early & stay in as long as PL Dot supports the move.
Pyramid your position for bigger profits.
Monitor resistance & support to determine exits.
📌 Trend Reversal: Spotting the Shift in Direction 🔄
A trend reversal happens when the market suddenly changes direction. This is confirmed when three consecutive closes appear on the opposite side of the PL Dot.
🔹 How to spot it?
PL Dot pulls back into the range.
Resistance/support levels start breaking.
A major higher timeframe resistance level is hit.
🔹 How to trade it?
Exit your position before the reversal is confirmed.
Look for a new congestion entrance or a trend change signal.
If reversal is confirmed, trade in the new trend direction.
🎯 Key Takeaways for Drummond Traders:
✔️ Know the 5 market types. Each phase requires a different strategy.
✔️ The PL Dot is key. It signals trend strength and potential reversals.
✔️ Congestion action = patience. Wait for clear breakouts before entering trades.
✔️ Ride the trend. The best profits come from early identification of trends.
✔️ Monitor resistance & support. This helps determine potential reversals.
🚀 Master these market types, and you’ll be able to trade with more confidence, better timing, and higher accuracy.
📌 Do you use Drummond Geometry in your trading? Drop a comment below! 👇

Recovery or Rejection for $LRCX?🚨 Recovery or Rejection for NASDAQ:LRCX ?
Lam Research is up 10%+ on strong earnings & guidance—but it’s testing a key S/R zone!
🔹 Bullish above $76.70—watch for momentum 🚀
🔹 Bearish if rejected—potential pullback 📉
Big move incoming—what’s your read? 👀

MRVL at turning point; rapid growth; stock price set to doubleMarvell Technology Inc. (MRVL) has recently shown signs of an upward trend, buoyed by positive analyst sentiment and strategic advancements in AI and cloud computing. Despite a challenging start to 2025, with shares down approximately 50% year-to-date (markets.businessinsider.com), analysts maintain a bullish outlook. The average 12-month price target stands at $116.40, suggesting significant potential upside from current levels (StockAnalysis).
Marvell's focus on custom AI silicon and data center solutions is driving optimism. The company's Structera CXL devices have achieved interoperability with AMD and Intel platforms, enhancing performance in next-generation cloud data centers (Benzinga). Additionally, Marvell's AI business now constitutes over half of its revenue, with expectations of 60% year-over-year revenue growth driven by AI and cloud segments (Seeking Alpha).
While short-term volatility persists, these developments position Marvell as a strong contender in the semiconductor sector, with potential for sustained growth as AI and cloud computing demand accelerates.

RHI long term support and uptrendTheres an extension, long term support and and even longer uptrend. I anticipate almost a 50% retracement.

$MSTR (W)in pattern target $440-480💡 Trade Idea: Long NASDAQ:MSTR — Technical Breakout with Triple Bottom Reversal
🧠 Thesis
MicroStrategy ( NASDAQ:MSTR ) has recently formed a triple bottom pattern, a classic bullish reversal setup indicating strong support in the NYSE:X range (insert actual range if known). This pattern suggests that sellers have failed to push the price lower on three separate occasions, showing exhaustion and paving the way for bulls to regain control.
Adding conviction to this move, NASDAQ:MSTR has now broken above its 200-day moving average, a widely watched technical level that often signals the shift from bearish to bullish long-term sentiment. This level has historically acted as a key resistance, and the breakout now turns it into potential support.
Together, these two signals—triple bottom support and 200-day MA breakout—provide a strong technical setup for a potential move higher.
📈 Technical Triggers
✅ Triple Bottom pattern confirmed across multi-week timeframe
✅ Close above 200-day MA, first time since
🔥 Increased volume on breakout day, confirming buyer interest
🎯 Trade Setup
Entry: Current market price (post-breakout confirmation)
Stop Loss: Just below the triple bottom support area (e.g., 3-5% below recent lows)
Target 1: 15–20% move to next major resistance (e.g., psychological level or previous high)
Target 2: Potential breakout to all-time highs if Bitcoin rallies in tandem
⚠️ Risks
NASDAQ:MSTR remains highly correlated to Bitcoin; any BTC weakness could invalidate setup
High beta and volatility; sharp drawdowns are possible
False breakouts can occur if BTC fails to hold its gains or if volume dries up
🧮 Optional Strategy
For lower risk exposure or theta-positive exposure, consider a bull call spread or cash-secured puts at support levels
Aggressive traders might explore calls if expecting a near-term BTC rally to lift sentiment

NOW is back NOW bullish reversal is about to be confirmed
once it passes the 200 EMA support and close above 948 that will confirm its reversal..
Entry @ 948 ( after close a day candle above 948)
Stop loss @ 890 ( the gap up opening gap)
Potential Breakout in PalantirPalantir Technologies has been consolidating as the broader market struggled, and some traders may look for its uptrend to continue.
The first pattern on today’s chart is the February 24 high of $99.01. PLTR peaked near that level in late March and again last week. However the stock cleared the resistance yesterday, which may signal a breakout.
Second, prices consolidated at the 50-day simple moving average but have now escaped from it. Is the intermediate-term trend getting more bullish?
Third, the 8-day exponential moving average (EMA) is above the 21-day EMA. MACD is also rising. Those patterns may reflect bullish short-term momentum.
Finally, the software company is a highly active underlier in the options market, averaging more than 700,000 contracts per session in the last month. (It ranks in the top five of the S&P 500, according to TradeStation data.) That could help traders take positions with calls and puts.
TradeStation has, for decades, advanced the trading industry, providing access to stocks, options and futures. If you're born to trade, we could be for you. See our Overview for more.
Past performance, whether actual or indicated by historical tests of strategies, is no guarantee of future performance or success. There is a possibility that you may sustain a loss equal to or greater than your entire investment regardless of which asset class you trade (equities, options or futures); therefore, you should not invest or risk money that you cannot afford to lose. Online trading is not suitable for all investors. View the document titled Characteristics and Risks of Standardized Options at www.TradeStation.com . Before trading any asset class, customers must read the relevant risk disclosure statements on www.TradeStation.com . System access and trade placement and execution may be delayed or fail due to market volatility and volume, quote delays, system and software errors, Internet traffic, outages and other factors.
Securities and futures trading is offered to self-directed customers by TradeStation Securities, Inc., a broker-dealer registered with the Securities and Exchange Commission and a futures commission merchant licensed with the Commodity Futures Trading Commission). TradeStation Securities is a member of the Financial Industry Regulatory Authority, the National Futures Association, and a number of exchanges.
Options trading is not suitable for all investors. Your TradeStation Securities’ account application to trade options will be considered and approved or disapproved based on all relevant factors, including your trading experience. See www.TradeStation.com . Visit www.TradeStation.com for full details on the costs and fees associated with options.
Margin trading involves risks, and it is important that you fully understand those risks before trading on margin. The Margin Disclosure Statement outlines many of those risks, including that you can lose more funds than you deposit in your margin account; your brokerage firm can force the sale of securities in your account; your brokerage firm can sell your securities without contacting you; and you are not entitled to an extension of time on a margin call. Review the Margin Disclosure Statement at www.TradeStation.com .
TradeStation Securities, Inc. and TradeStation Technologies, Inc. are each wholly owned subsidiaries of TradeStation Group, Inc., both operating, and providing products and services, under the TradeStation brand and trademark. When applying for, or purchasing, accounts, subscriptions, products and services, it is important that you know which company you will be dealing with. Visit www.TradeStation.com for further important information explaining what this means.
