
Navitas Semiconductor Corporation Harmonic shap on Stock for the short period coming soon .
Target price on Chart
Buying now is your best choice 👌

IBM Earnings PlayTechnical Analysis NYSE:IBM
On the 4-hour chart, IBM’s stock price is currently trading at approximately $260.50. Applying Bollinger Bands, the price is hovering near the 20-period moving average, with the bands moderately contracted, indicating relatively low volatility. The stock has shown resilience above the lower Bollinger Band, suggesting potential for an upward move if bullish momentum builds post-earnings. A recent green candle indicates buying interest, but the stock remains below the upper band, which sits near $270.00, signaling room for upside if catalysts align.
Target
Wait for bullish confirmation post-earnings.
Entry LONG : Around $262.00, Targeting $270.00.
Secondary Target: $275.00.
Resistance Levels: $265.00, $270.00, $275.00.
Support Levels: $255.00, $250.00, $245.00.
The price is testing the 20-period moving average, and a strong earnings report—particularly with positive AI or cloud revenue updates—could push the stock toward the upper Bollinger Band at $270.00 or higher. Conversely, a disappointing earnings report or weak guidance could see the price drop toward $255.00 or lower, especially if broader market conditions weaken.
QuantSignals
Best AI news analysis and signals


ARB IOT Group Limited (NASDAQ:ARBB)Stock finished 1st wave of the 3rd Motive powerful wave, be ready for the 3rd powerful 3rd Motive wave of 3 .
Target price between 2.50 $ - 2.73 $ short period coming.
Buy it now as much as you can 🔥

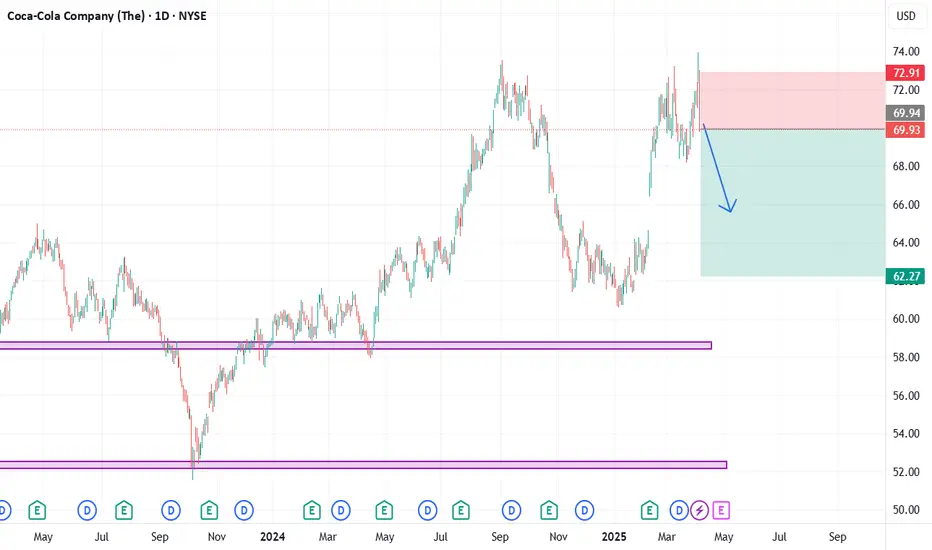
Tramp do not share a cola to EUR and other countriesHello dear traders! Maybe today buy a cola, drink it and hope that the price will not rise by 30%!
Today in Latvia the cheapest price that can be found in retail stores is 1.20 EUR/L. Trump will introduce very drastic tax rates next week and this will affect both American consumers and Europeans!
08.05.1886 The first delicious drink was invented by Dr. John Pemberton, it was bought by consumers and imitated by many other manufacturers. Today we are preparing for it to cost more and more!
The brand is very popular and influential, but it brings with it a price. Trump's taxes will further introduce adjustments to these prices. There will be a temporary price increase, because everyone will not want to buy a drink with additional taxes and this will cause them to buy less cola and the company's value will fall. This will also be reflected in the shares!
I think now is the right time to sell shares so that we can get a small profit on this market manipulation move in 2-3 months!
We are ready. Let's sell!
$LAES is ready for it's next legSeals is consolidating for a few months now and is holding the ichimoku cloud on the 2W.
ready for lift off

$SHOP 35-50%+ downside from here. $41-59 targetAlthough NASDAQ:SHOP bounced higher today, it looks like the bounce will be short lived.
I think we will see a large move down over the coming weeks to the lower support levels on the chart.
Why? We just formed another lower high. We've been in a downtrend since late February and until the price action can start forming higher lows, or hit the targets below, I think this stock looks heavy and will fall lower.

Dow Theory Using dow theory you can see Higher high and lower low trend in a bullish market of a share.

$PLTR 50%+ decline ahead, $39-56 targetNASDAQ:PLTR looks like it's topping here and that it has a long road to the bottom.
If we continue to reject at this resistance, then it's likely that we'll at least see the $56 target on the downside, but I think the $44 target is the most likely area to see a bounce.
Bulls should enjoy a 50%+ drop from here. You've been warned.

$GME to drop, first target $23.11GME seems to have hit major resistance and is also printing a green TD 9 candle on the daily time frame which indicates a sell. A break below $25.80 will see a quick 10% drop to $23.14.
I think this stock is going much lower, but short term - $23.14.
Good luck to all.

Lotus Technology Inc (LOT)Stock on triggering level , it's target prices above 8 $
Stock was since it begun on correction Zigzag , seems it will be higher degree of combination double formation .
It worths more than 4 $ and above .

Dow Inc.: Low in PlaceDow Inc. managed to hold and respond well within our active Target Zone(s) between $35.93 and $22.83 at the relevant Fibonacci levels. We currently assume that wave (II) in blue has been successfully completed, which leads us to anticipate a rise above the two indicated resistance levels ($55.67 and $71.86). Our zones remain active and could still be used for entering long positions. However, it should be noted that the price range could be tested further, and a completely new low is even possible under our alternative scenario: this wave count outlines a significantly stronger setback with the blue wave alt.(II), which would mean breaking through our dark green-blue Target Zones (probability: 35%).

Hallador Energy Company (HNRG) – Vertically Integrated PowerhousCompany Snapshot:
Hallador Energy NASDAQ:HNRG is redefining resilience in the energy sector with its fully integrated model, controlling both fuel supply and power generation. In today’s volatile energy landscape, this structure provides exceptional cost control and long-term strategic advantages.
Key Catalysts:
Vertically Integrated Model = Margin Power 💰
Manages ~90% of variable costs
Insulated from commodity price swings
Scales profitably as energy prices rise
Exclusive Grid Access ⚙️
Owns generator interconnection assets
Guarantees locked-in grid access—a rare competitive advantage
Strong positioning in a tight, regulated market
Revenue Visibility 💼
~$1.6B forward-contracted sales backlog
Ensures predictable cash flow and capital flexibility
Enables debt paydown, reinvestment, or shareholder returns
Tailwinds from Energy Demand 📈
U.S. power demand rising from AI/data centers, electrification
HNRG is well-positioned to benefit from stable base-load energy needs
Investment Outlook:
✅ Bullish Above: $12.00–$12.25
🚀 Target Range: $22.00–$23.00
🔑 Thesis: Structural cost control + grid access moat + revenue certainty = powerful upside potential
📢 HNRG: A rare energy stock with stability, growth, and moat strength.
#EnergyStocks #GridInfrastructure #PowerGeneration #HNRG #CashFlowStrong #ValuePlay

AAPL eyes on $208.xx: Key Resistance to Tariff Recovery wave AAPL trying to recover through the various tariff news.
Currently testing a key resistance zone at $208.26-208.68
Look for dips, with a must-hold support at $196.65-197.33
.
Previous analysis that called the TOP:
=====================================================

HTZ short idea?NASDAQ:HTZ HTZ is underperformjng the market In a large way today.
With interest rates falling & the IWM rallying to the upside this is a bearish divergence occurring for this ticker.
If HTZ can't rally with the positive conditions it likely means this stock will continue to see some selling pressure.
Understand this is a high risk high flying stock that can have outsized moves.

ADSK eyes on $270: Proven Resistance zone may Reject or BreakADSK trying to recover along with the general market.
Currently testing a proven resistance at $269.63-270.12
Look for a Break-n-Retest or dip to support fibs below.

AMZN watch $186-189: Key Resistance zone for Recovery BounceAMZN struggling with China tariffs but trying to recover.
Now up into a key resistance zone at $186.75-188.98
Anticipating some consolidation below or within zone.
.
Previous analysis that called the TOP:
===================================================

200% by year end?Hola Muchachos. We got a good setup here with the arc protecting the form. Its hit bottom support and took a bounce. We can expect to see $2 by end of summer. Crypto been in the gutter for a few months, so now as Gold takes a breather, its time for it to shine a little bit before it goes into a long cold hibernation.

Palomar Holdings (PLMR), for trend followersStrong trend, good fundamentals and ready for another trend push.
“Palomar Holdings, Inc. is a specialty insurance company engaged in providing property and casualty insurance products to individuals and businesses.”
Held steady during the recent turmoil and is already rising pre-market with the market.

Brinker International (EAT) Correction completed?After almost three months of correction and consolidation, the share price is fighting its way back up and trying to turn the corner out of the Bopden formation. Pre-market prices are already above the last interim high. A supposed cup is forming, inviting investors to follow the trend of the next upswing.

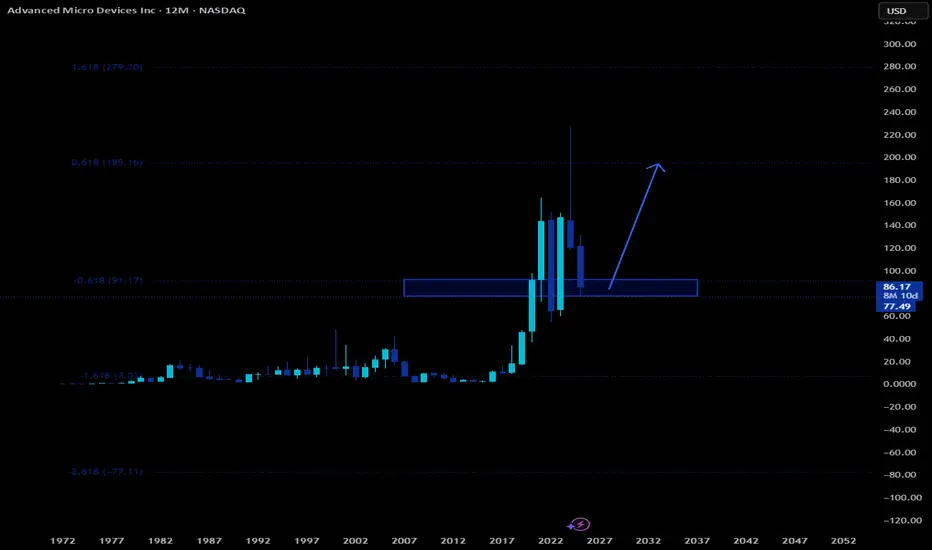
AMD HUGE LONG AMD has a huge level around $180 that is begging to be tested. We are at major support on the yearly. I expect a huge move in AMD in the coming weeks to the upside.