OPEN-SOURCE SCRIPT
Earnings Date Highlighter - from0_to_1
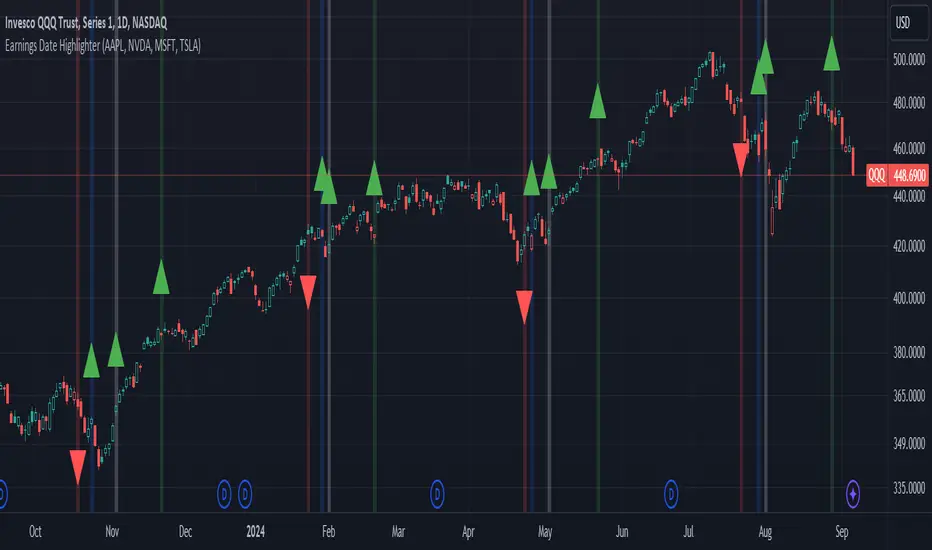
This indicator, called "Earnings Date Highlighter," is designed to visualize earnings data for up to four different stocks on a single chart. It's particularly useful for traders or investors who want to track earnings events for multiple companies simultaneously, such as the top holdings of an ETF.
Key features:
1. Tracks earnings data (estimates and actuals) for four user-defined symbols.
2. Plots earnings data points with customizable colors for each symbol.
3. Highlights earnings dates with background colors.
4. Displays green up arrows for earnings beats and red down arrows for earnings misses.
Why someone would use it:
1. To monitor earnings events for multiple stocks in a single view.
2. To quickly identify potential market-moving events for key components of an ETF or portfolio.
3. To spot patterns in earnings performance across different companies or sectors.
4. To help with timing trades or adjusting positions around earnings announcements.
This tool can be particularly valuable for investors focused on ETFs, as it allows them to visualize earnings dates and performance for the ETF's major holdings all in one place, potentially providing insights into how the ETF might behave around these key events.
Author:
tradingview.com/u/from0_to_1/
Open-source script
In true TradingView spirit, the creator of this script has made it open-source, so that traders can review and verify its functionality. Kudos to the author! While you can use it for free, remember that republishing the code is subject to our House Rules.
For quick access on a chart, add this script to your favorites — learn more here.
Disclaimer: Not a personal finance professional or financial advisor. Any and all publications are opinion and not investment advice.
Disclaimer
The information and publications are not meant to be, and do not constitute, financial, investment, trading, or other types of advice or recommendations supplied or endorsed by TradingView. Read more in the Terms of Use.