OPEN-SOURCE SCRIPT
Updated [blackcat] L3 Ultimate Market Sentinel (UMS)
Script Introduction
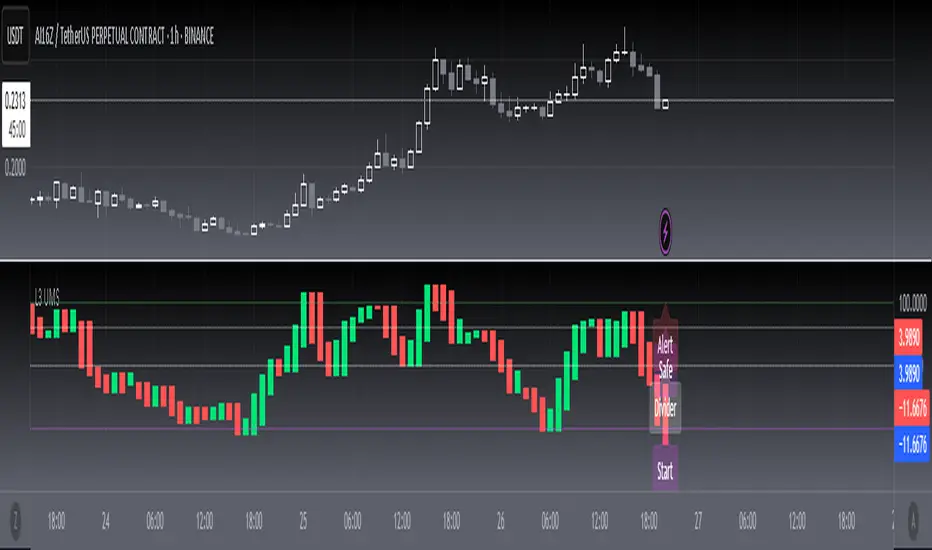
The [blackcat] L3 Ultimate Market Sentinel (UMS) is a technical indicator specifically designed to capture market turning points. This indicator incorporates the principles of the Stochastic Oscillator and provides a clear view of market dynamics through four key boundary lines — the Alert Line, Start Line, Safe Line, and Divider Line. The UMS indicator not only focuses on the absolute movement of prices but also visually displays subtle changes in market sentiment through color changes (green for rise, red for fall), helping traders quickly identify potential buy and sell opportunities.

In the above image, you can see how the UMS indicator labels different market conditions on the chart. Green candlestick charts indicate price increases, while red candlestick charts indicate price decreases. The Alert Line (Alert Line) is typically set at a higher level to warn of potential overheating in the market; the Start Line (Start Line) is in the middle, marking the beginning of market momentum; the Safe Line (Safe Line) is at a lower level, indicating a potential oversold state in the market; the Divider Line (Divider Line) helps traders identify whether the market is in an overbought or oversold area.
Script Usage
1. **Identifying Turning Points**: Traders should pay close attention to the Alert Line and Safe Line in the UMS indicator. When the indicator approaches or touches the Alert Line, it may signal an imminent market reversal; when the indicator touches the Safe Line, it may indicate that the market is oversold and there is a chance for a rebound.
2. **Color Changes**: By observing the color changes in the histogram, traders can quickly judge market trends. The transition from green to red may indicate a weakening of upward momentum, while the shift from red to green could suggest a slowdown in downward momentum.
3. **Trading Strategy**: The UMS indicator is suitable for a variety of trading timeframes, ranging from 1 minute to 1 hour. Short-term traders can use the UMS indicator to capture rapid market fluctuations, while medium-term traders can combine it with other analytical tools to confirm the sustainability of trends.
Advantages and Limitations of the Indicator
**Advantages**:
- Intuitive color coding that is easy to understand and use.
- Multiple boundary lines provide comprehensive market analysis.
- Suitable for a variety of trading timeframes, offering high flexibility.
**Limitations**:
- As a single indicator, it may not cover all market dynamics.
- For novice traders, it may be necessary to use the UMS indicator in conjunction with other indicators to improve accuracy.
- The indicator may lag in extreme market conditions.
Special Note
The [blackcat] L3 Ultimate Market Sentinel (UMS) indicator is a powerful analytical tool, but it is not omnipotent. The market has its inherent risks and uncertainties, so it is recommended that traders use the UMS indicator in conjunction with their own trading strategies and risk management rules. Additionally, it is always recommended to fully test and verify any indicator in a simulated environment before actual application.
The [blackcat] L3 Ultimate Market Sentinel (UMS) is a technical indicator specifically designed to capture market turning points. This indicator incorporates the principles of the Stochastic Oscillator and provides a clear view of market dynamics through four key boundary lines — the Alert Line, Start Line, Safe Line, and Divider Line. The UMS indicator not only focuses on the absolute movement of prices but also visually displays subtle changes in market sentiment through color changes (green for rise, red for fall), helping traders quickly identify potential buy and sell opportunities.
In the above image, you can see how the UMS indicator labels different market conditions on the chart. Green candlestick charts indicate price increases, while red candlestick charts indicate price decreases. The Alert Line (Alert Line) is typically set at a higher level to warn of potential overheating in the market; the Start Line (Start Line) is in the middle, marking the beginning of market momentum; the Safe Line (Safe Line) is at a lower level, indicating a potential oversold state in the market; the Divider Line (Divider Line) helps traders identify whether the market is in an overbought or oversold area.
Script Usage
1. **Identifying Turning Points**: Traders should pay close attention to the Alert Line and Safe Line in the UMS indicator. When the indicator approaches or touches the Alert Line, it may signal an imminent market reversal; when the indicator touches the Safe Line, it may indicate that the market is oversold and there is a chance for a rebound.
2. **Color Changes**: By observing the color changes in the histogram, traders can quickly judge market trends. The transition from green to red may indicate a weakening of upward momentum, while the shift from red to green could suggest a slowdown in downward momentum.
3. **Trading Strategy**: The UMS indicator is suitable for a variety of trading timeframes, ranging from 1 minute to 1 hour. Short-term traders can use the UMS indicator to capture rapid market fluctuations, while medium-term traders can combine it with other analytical tools to confirm the sustainability of trends.
Advantages and Limitations of the Indicator
**Advantages**:
- Intuitive color coding that is easy to understand and use.
- Multiple boundary lines provide comprehensive market analysis.
- Suitable for a variety of trading timeframes, offering high flexibility.
**Limitations**:
- As a single indicator, it may not cover all market dynamics.
- For novice traders, it may be necessary to use the UMS indicator in conjunction with other indicators to improve accuracy.
- The indicator may lag in extreme market conditions.
Special Note
The [blackcat] L3 Ultimate Market Sentinel (UMS) indicator is a powerful analytical tool, but it is not omnipotent. The market has its inherent risks and uncertainties, so it is recommended that traders use the UMS indicator in conjunction with their own trading strategies and risk management rules. Additionally, it is always recommended to fully test and verify any indicator in a simulated environment before actual application.
Release Notes
OVERVIEWThe [blackcat] L3 Ultimate Market Sentinel (UMS) is a comprehensive technical analysis tool designed to help traders monitor market conditions effectively. This indicator combines elements of stochastic oscillators and customizable alert levels to provide insights into potential market movements. By plotting key lines and generating visual cues, it aids traders in identifying overbought, oversold, and neutral zones within the market 📊💹.
FEATURES
Calculates and plots the following components:
Raw Stochastic Value (RSV)
K Line
D Line
J Line
Includes customizable horizontal lines for alerts and reference points:
Alert Line: Indicates critical levels requiring attention.
Start Line: Marks the beginning of monitoring periods.
Safe Line: Represents safer trading zones.
Divider Line: Separates different market sentiment areas.
Displays colored candlesticks based on the direction of the J Line movement:
Green candles indicate upward momentum.
Red candles indicate downward momentum.
Generates visual labels on the chart for easy identification of key levels 🏷️
HOW TO USE
Add the indicator to your TradingView chart by selecting it from the indicators list.
Adjust the Alert Line, Start Line, Safe Line, and Divider Line inputs to suit your preferred thresholds ⚙️.
Monitor the chart for colored candlesticks indicating market momentum.
Use the labeled horizontal lines as references for making informed trading decisions.
LIMITATIONS
The indicator relies heavily on stochastic values, which might not capture all market nuances.
False signals can occur in highly volatile or ranging markets 🌪️.
Users should always confirm signals with other forms of analysis before making trading decisions.
NOTES
Ensure that you have sufficient historical data available for accurate calculations.
Test the indicator thoroughly on demo accounts before applying it to live trading 🔍.
Customize the appearance and parameters as needed to fit your trading strategy.
Open-source script
In true TradingView spirit, the creator of this script has made it open-source, so that traders can review and verify its functionality. Kudos to the author! While you can use it for free, remember that republishing the code is subject to our House Rules.
For quick access on a chart, add this script to your favorites — learn more here.
Avoid losing contact!Don't miss out! The first and most important thing to do is to join my Discord chat now! Click here to start your adventure: discord.com/invite/ZTGpQJq 防止失联,请立即行动,加入本猫聊天群: discord.com/invite/ZTGpQJq
Disclaimer
The information and publications are not meant to be, and do not constitute, financial, investment, trading, or other types of advice or recommendations supplied or endorsed by TradingView. Read more in the Terms of Use.