ATR % Oscillator - DolphinTradeBot1️⃣ Overview
🔸 This is a simplified version of ATR and TR that shows volatility as percentage changes , making it easier to compare two symbols.
🔸 The indicator compares the volatility of two different assets by calculating the percentage-based price ranges and their moving averages .
📌 This is especially useful for pair traders, as it helps identify which symbol is more volatile, allowing for strategic decisions based on relative movement rather than overall market direction.
2️⃣ How Is It Work?
🔸 For each symbol, it calculates the absolute percentage difference between either:
• Close and Open (net price change), or
• High and Low (daily price range).
🔸 The results are visualized as column bars — the taller the bar, the higher the volatility.
🔸 It also plots a moving average line (SMA) based on the selected range length.
📌 These calculations are independent of the chart you're on — they work purely based on the two selected symbols.
If no symbols are selected, it defaults to using the current chart's symbol.
3️⃣ How to Use It?
With this indicator, you can:
🔸 Compare the volatility between two assets.
🔸 Detect sudden volatility spikes that may signal upcoming momentum.
🔸 Support spread, arbitrage, or correlation-based strategies .
🔸 See which symbol is gaining market attention (a larger difference = more activity).
Example: Compare BTC vs ETH to see which one is dominating in terms of price action or volatility.
4️⃣⚙️ Settings
🔸 Symbol Settings
• Symbol-1 / Symbol-2: Choose the two assets to compare.
• Checkboxes: Enable/disable visibility for each symbol's data.
🔸 Calculation Settings
• Range Average: The number of bars used for the moving average.
• Calculation Source:
- Close-Open: Measures net price movement.
- High-Low: Measures total price range.
Average True Range (ATR)

VoluTility🌊 VoluTility forecasts trend exhaustion, breakout pressure, and structural inflection by measuring volatility within the effort stream. Built on the concept of ATR applied to volume, it doesn’t read raw volume — it reveals whether that volume is stable, chaotic, or compressing ahead of a move. The goal is to detect structural setups before they resolve. The lower the timeframe, the greater the alpha.
🧠 Core Logic
A zero-centered histogram shows the deviation of smoothed volume from its own volatility baseline. Positive bars indicate expansion; negative bars signal compression. Color reflects rate-of-change in volume volatility. Opacity tracks effort/result strength — showing when moves are real or hollow.
The overlaid ribbon (EMA vs HMA) highlights rhythm shifts. Orange fill signals real expansion; yellow shows decay or absorption. Together, they expose pre-breakout compression and exhaustion tails before price reacts.
🏗️ Structural Read
On the 1H BTC chart shown, price coils into a shallow pullback, compressing within a narrow range marked by shrinking candle bodies and muted wick aggression. A sudden expansion candle breaks the coil cleanly, with no immediate rejection or wick reversion. Price holds above the breakout pivot, establishing a baseline for structural acceptance and shifting bias toward continuation.
🔰 Zone Descriptions
🔴 Volatile blowout
🟠 Clean expansion
🟡 Passive or absorbed effort
🟢 Steady-state rhythm
🔵 Compression coil
🧐 Suggested Use
VoluTility is expressly designed as an overlay for sub-pane indicators, where it acts as a second-order rhythm map — exposing hidden structural pressure within volume or volatility streams. When paired with volume (like ZVOL or OBVX), it highlights when flow is expanding with intent versus fading into noise. When layered over volatility signals (like ATR Turbulence or WIRE), it reveals whether expansion has real effort behind it — or is just structural slack.
It pairs especially well with the Relative Directional Index (RDI), where its histogram and ribbon offer early exhaustion signals before traditional trend or momentum fades appear. On raw momentum tools, it acts as a filter: softening false breaks and confirming pressure-backed continuation.
Run on 15m or lower charts for early entry cues or breakout anticipation. On 1H charts, use it to validate compression resolution or detect fatigue before structure turns. It doesn’t react to price — it forecasts readiness.

FSH ATR MTF MonitorThe FSH ATR MTF Monitor tracks the Average True Range (ATR) and current range across six customizable timeframes, displaying the results in a table. When a timeframe’s range exceeds its ATR, the range value turns yellow, signaling heightened volatility. This multi-timeframe tool helps traders assess market conditions and plan entries or exits.
Key Features:
- Monitors ATR and range for up to six timeframes simultaneously.
- Customizable ATR length and timeframe inputs.
- Highlights ranges exceeding ATR in yellow for quick identification.
- Table display with toggle option for flexibility.
How to Use:
1. Add the indicator to your chart.
2. Adjust the ATR length and timeframes in the inputs as needed.
3. Watch for yellow range values to spot volatility spikes across timeframes.
4. Toggle the table off if not needed.
Ideal for scalpers, swing traders, or anyone analyzing volatility across multiple timeframes.

ATR Stop BufferThe ATR Stop Buffer indicator calculates the Daily Average True Range (ATR) and converts it into ticks based on the symbol's minimum price movement. It then displays the full ATR, 2% of ATR, and 10% of ATR in a clean table format, rounded up for simplicity. This tool is ideal for traders who want to set volatility-based stop-loss levels or buffers for their trades.
Key Features:
- Uses a 14-period Daily ATR for robust volatility measurement.
- Converts ATR into ticks for precise application across different instruments.
- Table display with toggle option for flexibility.
- Perfect for risk management and trade planning.
How to Use:
1. Add the indicator to your chart.
2. Use the table values to adjust your stop-loss distances (e.g., 2% ATR for tight stops, 10% ATR for wider buffers).
3. Toggle the table off if you only need the values occasionally.
Note: Works best on instruments with defined tick sizes (e.g., futures, forex, stocks).

Daily Bollinger Band StrategyOverview of the Daily Bollinger Band Strategy
1. Strategy Overview and Features
This strategy is a tool for backtesting a trading method that uses Bollinger Bands. It is *not* a tool for automated trading.
1-1. Main Display Items
The main chart displays the Bollinger Bands and the 200-day moving average.
It also shows the entry and exit points along with the position size (in units of 100 shares).
1-2. Summary of Trading Rules
For long (buy) strategies, the trade enters when the price crosses above the +1σ line of the Bollinger Bands, aiming to ride an upward trend. The position is exited when the price crosses below the middle band.
For short (sell) strategies, the trade enters when the price crosses below the -1σ line of the Bollinger Bands, aiming to ride a downward trend. The position is exited when the price crosses above the middle band.
1-3. Strategic Enhancements
The strategy uses the slope of the 200-day moving average to determine the trend direction and enter trades accordingly. This improves the win rate and payoff ratio.
Additionally, to reduce the probability of ruin, the risk per trade is limited to 1.0% of capital, and position sizing is adjusted using ATR (a volatility indicator).
2. Trading Rules
2-1. Chart Type
Only daily charts are used.
2-2. Indicators Used
(1) Bollinger Bands** (used for entry and exit signals)
- Period: Fixed at 80 days
- Upper and lower bands: Fixed at ±1σ
(2) Moving Average** (used to determine trend direction)
- Period: Fixed at 200 days
- Trend direction is judged based on whether the difference from the previous day is positive (upward) or negative (downward)
2-3. Buy Rules
Setup:
- Price crosses above the +1σ line from below
- Both the middle band and 200-day moving average are upward sloping
Entry:
- Buy at the next day’s market open using a market order
Exit:
- If the price crosses below the middle band, sell at the next day’s open using a market order
2-4. Sell Rules
Setup:
- Price crosses below the -1σ line from above
- Both the middle band and 200-day moving average are downward sloping
Entry:
- Sell at the next day’s market open using a market order
Exit:
- If the price crosses above the middle band, buy back at the next day’s open using a market order
2-5. Risk Management Rules
- Risk per trade: 1.0% of total capital (acceptable loss = capital × 1.0%)
- Position size: Acceptable loss ÷ 2ATR (rounded down to the nearest unit of 100 shares)
2-6. Other Notes
- No brokerage fees
- No pyramiding
- No partial exits
- No reverse positions (no “stop-and-reverse” trades)
3. Strategy Parameters
The following settings can be specified:
3-1. Period Settings
- Start date: Set the start date for the backtest period
- Stop date: Set the end date for the backtest period
3-2. Display of Trend and Signals
- Show trend: When checked, the background color of the bars is light red for an uptrend and light blue for a downtrend
- Show signal: When checked, entry and exit signals are displayed (note: signals are executed at the next day’s open, so there is a one-day lag in the display)
3-3. Capital Management Settings
- Funds: Capital available for trading (in JPY)
- Risk rate: Specify what percentage of the capital to risk per trade
Settings in the “Properties” tab are not used in this strategy.
4. Backtest Results (Example)
Here are the backtest results conducted by the author:
- Target Stocks: All components of the Nikkei 225
- Test Period: January 4, 2000 – December 30, 2024
- Data Points: 12,886
- Win Rate: 33.45%
- Net Profit: ¥82,132,380
- Payoff Ratio: 2.450
- Expected Value: ¥6,373.8
- Risk Rate: 1.0%
- Probability of Ruin: 0.00%
---
デイリー・ボリンジャーバンド・ストラテジーの概要
1. ストラテジーの概要と特徴
このストラテジーは、ボリンジャーバンドを使ったトレード手法のバックテストを行うツールです。自動売買を行うツールではありません。
1-1. 主な表示項目
メインチャートにボリンジャーバンドと 200日移動平均線を表示します。
また、エントリーと手仕舞いのタイミングと数量(100株単位)も表示されます。
1-2. トレードルールの概要
買い戦略の場合、ボリンジャーバンドの +1σ 超えでエントリーして上昇トレンドに乗り、ミドルバンドを割ったら決済します。
売り戦略の場合、ボリンジャーバンドの -1σ 割りでエントリーして下降トレンドに乗り、ミドルバンドを上抜けたら決済します。
1-3. ストラテジーの工夫点
200日移動平均線の傾きを見てトレンド方向にエントリーをしています。こうして勝率とペイオフレシオの成績を向上しています。
また、破産確率を抑えるために、リスク資金比率を 1.0% にして、ATR(ボラティリティ指標) を使って注文数を調整しています。
2. 売買ルール
2-1. 使用するチャート
日足チャートに限定します
2-2. 使用する指標
(1) ボリンジャーバンド(仕掛けと手仕舞いのシグナルに使用)
期間は80日に固定
上下バンドは ±1σ に固定
(2) 移動平均線(トレンドの方向を見るために使用)
期間は200日に固定
移動平均の値の前日との差がプラスのとき上向き、マイナスのとき下向きと判断
2-3. 買いのルール
セットアップ:ボリンジャーバンドの +1σ を価格が下から上に交差 かつ ミドルバンドと 200日移動平均線が上向き
仕掛け:翌日の寄り付きに成行で買う
手仕舞い:ボリンジャーバンドのミドルバンドを価格が上から下に交差したら、翌日の寄り付きに成行で売る
2-4. 売りのルール
セットアップ:ボリンジャーバンドの -1σ を価格が上から下に交差 かつ ミドルバンドと 200日移動平均線が下向き
仕掛け:翌日の寄り付きに成行で売る
手仕舞い:ボリンジャーバンドのミドルバンドを価格が下から上に交差したら、翌日の寄り付きに成行で買い戻す
2-5. 資金管理のルール
リスク資金比率:資産の 1.0%(許容損失 = 資産 × 1.0%)
注文数:許容損失 ÷ 2ATR(単元株数未満は切り捨て)
2-6. その他
仲介手数料:なし
ピラミッディング:なし
分割決済:なし
ドテン:しない
3. ストラテジーのパラメーター
次の項目が指定できます。
3-1. 期間の設定
Staer date : バックテストの検証期間の開始日を指定します
Stop date : バックテストの検証期間の終了日を指定します
3-2. トレンドとシグナルの表示
Show trend : チェックを入れると、バーの背景色が、トレンドが上昇のときは薄い赤で、下落のときは薄い青で表示されます
Show signal : チェックを入れると、エントリーと手仕舞いのシグナルを表示します(シグナルの出た翌日の寄り付きに売買をするので表示に1日のずれがあります)
3-3. 資金管理用の設定
Funds : トレード用の資金(円)
Risk rate : 許容損失を資金の何%にするかで指定します
「プロパティタブ」で設定する値は、このストラテジーでは有効ではありません。
4. バックテストの結果(例)
作者がバックテストを実施した結果をお知らせします。
対象銘柄:日経225構成銘柄すべて
対象期間:2000年1月4日~2024年12月30日
データ件数:12,886
勝率:33.45%
純利益:82,132,380
ペイオフレシオ:2.450
期待値:6,373.8
リスク資金比率:1.0%
破産確率:0.00%

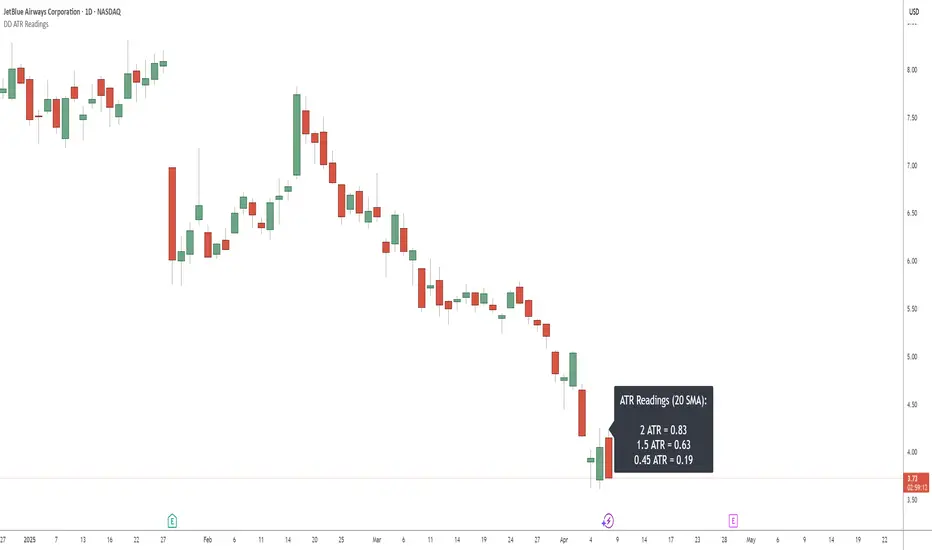
DD ATR ReadingsThe DD ATR Readings indicator displays customizable Average True Range (ATR) multiplier values directly on your chart. Unlike standard ATR indicators that only show a line, this indicator calculates and displays the exact numeric values for three different ATR multipliers, giving you precise volatility measurements for your trading decisions.
It's specifically created for people taking the "Deep Dip Buy" stock trading course, and attempts to provide a ready-to-go solution to allow easy position size calculations as per the course, with the required ATR values visible at a glance.
The default values of 2.0, 1.5 and 0.45 are the same values used by the course instructor in his charting software, but you can change these values to any multiplier you choose.
Any input from students or the instructor is welcome to improve this indicator so it offers more value to those looking to learn how to trade.
Features
Displays three customizable ATR multiplier values (default: 2.0, 1.5, and 0.45 from the course)
Uses either SMA or EMA for ATR calculation (20-period default)
Fully customizable label appearance (position, color, size)
Real-time value updates as you move through the chart
Clean, unobtrusive display that doesn't clutter your chart with additional lines
Customization Options
ATR Length: Number of bars used in the ATR calculation (default: 20)
ATR Multipliers: Three customizable multiplier values
SMA/EMA: Choose your preferred moving average type for ATR calculation
Label Style: Multiple positioning options for the text display
Colors and Size: Fully customizable appearance
BB Breakout + Momentum Squeeze [Strategy]This Strategy is Based on 3 free indicators
- Bollinger Bands Breakout Oscillator: Link
- TTM Squeeze Pro: Link
- Rolling ATR Bands: Link
Bollinger Bands Breakout Oscillator - This tool shows how strong a market trend is by measuring how often prices move outside their normal Bollinger bands range. It helps you see whether prices are strongly moving in one direction or just moving sideways. By looking at how much and how frequently prices push beyond their typical boundaries, you can identify which direction the market is heading over your selected time period.
TM Squeeze Pro - This is a custom version of the TTM Squeeze indicator.
It's designed to help traders spot consolidation phases in the market (when price is coiling or "squeezing") and to catch breakouts early when volatility returns. The logic is based on the relationship between Bollinger Bands and Keltner Channels, combined with a momentum oscillator to show direction and strength.
Rolling ATR Bands - This indicator combines volatility bands (ATR) with momentum and trend signals to show where the market might be breaking out, retesting, or trending. It's highly visual and helpful for traders looking to time entries/exits during trending or volatile moves.
Logic Of the Strategy:
We are going to use the Bollinger Bands Breakout to determine the direction of the market. Than check the Volatility of the price by looking at the TTM Squeeze indicator. And use the ATR Bands to determine dynamic Stop Losses and based on the calculate the Take Profit targets and quantity for each position dynamically.
For the Long Setup:
1. We need to see the that Bull Power (Green line of the Bollinger Bands Breakout Oscilator) is crossing the level of 50.
2. Check the presence of volatility (Green dot based on the TTM Squeeze indicator)
For the Short Setup:
1. We need to see the that Bear Power (Red line of the Bollinger Bands Breakout Oscilator) is crossing the level of 50.
2. Check the presence of volatility (Green dot based on the TTM Squeeze indicator)
Stop Loss is determined by the Lower ATR Band (for the Long entry) and Upper ATR Band (For the Short entry)
Take Profit is 1:1.5 risk reward ration, which means if the Stop loss is 1% the TP target will be 1.5%
Move stop Loss to Breakeven: If the price will go in the direction of the trade for at least half of the Risk Reward target then the stop will automatically be adjusted to the entry price. For Example: the Stop Loss is 1%, the price has move at least 0.5% in the direction of your trade and that will move the Stop Loss level to the Entry point.
You can Adjust the parameters for each indicator used in that script and also adjust the Risk and Money management block to see how the PnL will change.

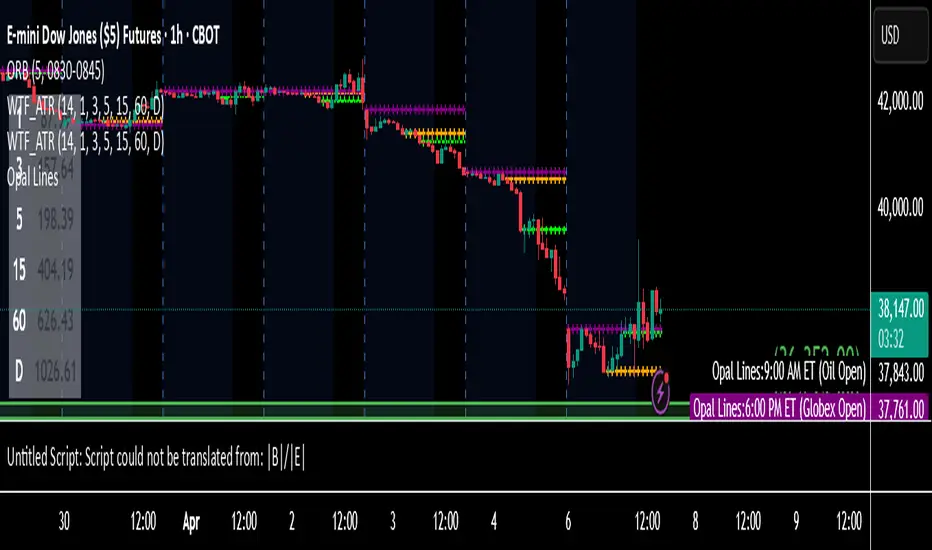
Multi-Timeframe ATR MonitorThis indicator displays a table of ATR values across multiple user-defined timeframes (1m, 3m, 5m, 15m, 60m, daily by default) and tracks the session range since 18:00. Customize the timeframes and ATR length via inputs.
RSI + ADX + ATR Combo Indicator: RSI + ADX + ATR Combo Filter
This indicator is a confluence filter tool that combines RSI, ADX, and ATR into a single, easy-to-read chart overlay. It is designed to help traders identify low-volatility, non-trending zones with balanced momentum—ideal for strategies that rely on breakouts or reversals.
🔍 Core Components:
RSI (Relative Strength Index)
Standard RSI with custom upper and lower bounds (default: 60 and 40).
Filters out extreme overbought/oversold regions and focuses on price consolidation zones.
ADX (Average Directional Index)
Measures trend strength.
When ADX is below a custom threshold (default: 20), it indicates a weak or range-bound trend.
ATR (Average True Range)
Represents volatility.
Low ATR values (default threshold: 2.5) are used to filter out high-volatility environments, helping refine entries.
🟣 Signal Logic:
A signal is highlighted with a background color when all three conditions are met:
RSI is between lower and upper bounds (e.g., 40 < RSI < 60) ✅
ADX is below the trend threshold (e.g., ADX < 20) ✅
ATR is below the volatility threshold (e.g., ATR < 2.5) ✅
These combined conditions suggest a low-volatility, low-trend strength, and balanced momentum zone—perfect for anticipating breakouts or strong directional moves.

ATR Amplitude RatioATR Amplitude Ratio
The ATR Amplitude Ratio indicator measures price volatility by comparing the current candle's amplitude (high-low range) to the Average True Range (ATR). This helps traders identify when price movement exceeds typical volatility thresholds, potentially signaling unusual market activity.
Key Features:
Displays the ratio between current candle height and ATR as color-coded histogram bars
Customizable ATR calculation with multiple smoothing methods (SMA, EMA, RMA, WMA)
Visual reference lines at 1x, 2x, 3x, 4x, and 5x ATR levels
Dynamic color coding based on volatility intensity (5 customizable threshold colors)
Real-time display of current ratio and ATR values
How to Use:
Volatility Assessment: Quickly identify if price action is within normal volatility ranges or exhibiting unusual movement
Breakout Confirmation: Higher ratios can confirm genuine breakouts versus false moves
Entry/Exit Timing: Consider entries when volatility returns to normal ranges after spikes
Risk Management: Adjust position sizing based on current volatility ratios
Settings:
ATR Length: Determines the lookback period for ATR calculation (default: 14)
ATR Smoothing Type: Choose from SMA, EMA, RMA, or WMA methods
Color Thresholds: Customize colors for different volatility ranges
This indicator helps traders make more informed decisions by providing context about current price action relative to recent historical volatility.

Chonky ATR Levels 2.0Show ATR based high/low projections.
Choose a custom ATR calculation in the indicator's settings.
The default is a 20day RMA based ATR.
----------How projections are calculated----------
To project the ATR High, the ATR value is added to the low of the current candle that matches the ATR's timeframe.
To project the ATR Low, the ATR value is subtracted from the high of the current candle that matches the ATR's timeframe.
Example:
If a 20day RMA ATR is used:
- the ATR High will be the current day's low + the ATR value.
- the ATR Low will be the current day's high - the ATR value.
*However*, if the price action exceeds either ATR projection, the opposite ATR level will be fixed to the extreme of the period.
See the AUDUSD screenshot above for an example.
The ATR Low was exceeded, so the ATR High projection is capped at the high of day.
If the ATR High is exceeded, the ATR Low would be capped at the low of day.

Rachas ATR AssistHey Traders!
This indicator is a simple, it uses Average True Range (ATR) data from the daily chart and the current timeframe to estimate potential range and volatility.
This indicator compares the daily ATR to the current daily wick range (from low to high), helping you gauge how much "room" might be left for price movement within the day. Alongside that, it shows the ATR over the last 14 candles and 5 candles on your current chart for intraday volatility awareness—ideal for setting stops, targets, or position sizing.
Gauge Daily Potential Movement:
The "Day Range Difference" cell shows how much of the expected daily range (based on ATR) is still unfilled. If the market has moved less than the average, there's still potential for expansion. If it's close to or above the ATR, expect a slowdown or reversal.
Position Sizing & Stop Losses:
Use the 14-period ATR and 5-period ATR on your current timeframe to understand recent volatility. This helps in choosing logical stop loss levels and adjusting position sizes based on market conditions.
Volatility Awareness:
Knowing the average daily range and how much of it has been used lets you avoid entering trades too late in the move or placing stops in overly tight spots.
Table Position & Font:
You can adjust the table location (top/bottom left/right) and font size to best fit your chart layout.

Rolling ATR Momentum
Rolling ATR Momentum Indicator – User Manual
---
🔍 Overview
The Rolling ATR Momentum Indicator is a simple yet powerful tool designed to detect shifts in market volatility. It compares the current Average True Range (ATR) with the ATR from a previous point in time to measure how market volatility is changing.
This indicator is especially useful for:
- Spotting the beginning or fading of a momentum phase
- Filtering out low-volatility market conditions
- Enhancing timing for entries and exits in trending or breakout trades
---
📊 Key Components
✅ ATR Delta (Rolling)
- Definition: `ATR Delta = Current ATR - Past ATR`
- Inputs:
- ATR Period (default: 14): The base ATR calculation window
- Lookback Period (default: 5): How many bars ago to compare ATR
- Interpretation:
- Positive ATR Delta (Green Line): Market volatility is increasing
- Negative ATR Delta (Red Line): Market volatility is decreasing
📈 Zero Line
- A horizontal baseline at zero helps you easily see when ATR momentum shifts from negative to positive (or vice versa).
🟩/🟥 Background Color
- Green Background: ATR Delta is positive (rising volatility)
- Red Background: ATR Delta is negative (falling volatility)
🔵 Optional: ATR Reference Lines
- You can optionally display raw Current ATR and Past ATR by changing their visibility settings.
---
✅ How to Use It
Entry Timing (Futures/Options)
- Use ATR Delta as a filter:
- Only take trades when ATR Delta is positive → confirms momentum is building
- Avoid trades when ATR Delta is negative → market might be slow, sideways, or losing steam
Breakout Anticipation
- A rising ATR Delta after a tight range or consolidation can suggest that a breakout is underway
Stop-loss Strategy
- Use high ATR periods for wider stops (to avoid noise)
- Use low ATR periods for tighter stops or skip trading
---
🧠 Pro Tips
- This indicator doesn’t predict direction—combine with trend or price structure tools (like EMA, PPMA, candlesticks)
- Works best in trending or breakout environments
- Add it to multi-timeframe layouts to see volatility buildup on higher timeframes
---
⚙️ Settings
| Parameter | Description |
|----------|-------------|
| ATR Period | Length of the ATR calculation (default 14) |
| Lookback Period | How many bars back to compare ATR values |
---
🧭 Best For:
- Index futures (Nifty, BankNifty)
- Option buyers needing volatility confirmation
- Intraday & swing traders looking to trade momentum setups
---
Use the Rolling ATR Momentum indicator as your volatility radar—simple, clean, and highly effective for staying on the right side of market energy.
End of Manual

Rolling ATR Momentum - EnhancedATR Rolling Momentum Indicator – User Manual
---
🔍 Overview
The ATR Rolling Momentum Indicator is a dynamic volatility tool built on the Average True Range (ATR). It not only tracks increasing or decreasing momentum but also provides early warnings and confirmation signals for potential breakout moves. It’s especially powerful for futures and options traders looking to align with expanding price action.
---
📊 Core Components
✅ ATR Delta (Rolling ATR)
- Definition: Difference between current ATR and past ATR (user-defined lookback).
- Use: Tells whether volatility is expanding (positive delta) or contracting (negative delta).
- Visual: Green line for rising momentum, red for declining.
🟣 ATR Delta Slope
- Definition: Measures acceleration in momentum.
- Use: Helps identify early signs of breakout buildup.
- Visual: Purple line. Watch for slope turning up from below.
🟡 Volatility Squeeze (Yellow Dot)
- Definition: Current ATR is significantly lower than its 20-period average.
- Use: Indicates the market is coiling—possible breakout ahead.
🔼 Momentum Start (Green Triangle)
- Definition: ATR Delta slope turns from negative to positive.
- Use: Early warning to prepare for volatility expansion.
🔷 Breakout Confirmation (Blue Label Up)
- Definition: ATR Delta exceeds its high of the last 10 candles.
- Use: Confirms volatility breakout—trade opportunity if direction aligns.
🟩/🟥 Background Color
- Green Background: Momentum rising (positive ATR delta)
- Red Background: Momentum falling (negative ATR delta)
- Yellow Tint: Active squeeze zone
---
✅ How to Use It (Futures/Options Focus)
Step-by-Step:
1. Squeeze Detected (Yellow Dot) → Stay alert. Market is coiling.
2. Green Triangle Appears → Momentum is starting to rise.
3. Background Turns Green → Confirmed rising momentum.
4. Blue Label Appears → Confirmed breakout (enter trade if trend aligns).
Directional Bias:
- Use your main chart setup (price action, EMAs, trendlines, etc.) to decide direction (Call or Put, Long or Short).
- ATR Momentum only tells you how strong the move is—not which way.
---
⚙️ Inputs & Settings
- ATR Period: Default 14 (core volatility measure)
- Rolling Lookback: Used to calculate delta (default 5)
- Slope Length: Used to measure acceleration (default 3)
- Squeeze Factor: Default 0.8 — lower = more sensitive squeeze detection
- Breakout Lookback: Checks ATR delta against last X bars (default 10)
---
🧠 Pro Tips
- Works great when paired with EMA stacks, price structure, or breakout patterns.
- Avoid taking trades based only on squeeze or momentum—combine with chart confirmation.
- If background turns red after a breakout, it may be losing momentum—book partials or tighten stops.
---
🧭 Ideal For:
- Nifty/BankNifty Futures
- Option directional trades (call/put buying)
- Index scalping and momentum swing setups
---
Use this tool as your volatility compass—it won't tell you where to go, but it'll tell you when the wind is strong enough to move fast.
End of Manual

Smart Grid Scalping (Pullback) Strategy[BullByte]The Smart Grid Scalping (Pullback) Strategy is a high-frequency trading strategy designed for short-term traders who seek to capitalize on market pullbacks. This strategy utilizes a dynamic ATR-based grid system to define optimal entry points, ensuring precise trade execution. It integrates volatility filtering and an RSI-based confirmation mechanism to enhance signal accuracy and reduce false entries.
This strategy is specifically optimized for scalping by dynamically adjusting trade levels based on current market conditions. The grid-based system helps capture retracement opportunities while maintaining strict trade management through predefined profit targets and trailing stop-loss mechanisms.
Key Features :
1. ATR-Based Grid System :
- Uses a 10-period ATR to dynamically calculate grid levels for entry points.
- Prevents chasing trades by ensuring price has reached key levels before executing entries.
2. No Trade Zone Protection :
- Avoids low-volatility zones where price action is indecisive.
- Ensures only high-momentum trades are executed to improve success rate.
3. RSI-Based Entry Confirmation :
- Long trades are triggered when RSI is below 30 (oversold) and price is in the lower grid zone.
- Short trades are triggered when RSI is above 70 (overbought) and price is in the upper grid zone.
4. Automated Trade Execution :
- Long Entry: Triggered when price drops below the first grid level with sufficient volatility.
- Short Entry: Triggered when price exceeds the highest grid level with sufficient volatility.
5. Take Profit & Trailing Stop :
- Profit target set at a customizable percentage (default 0.2%).
- Adaptive trailing stop mechanism using ATR to lock in profits while minimizing premature exits.
6. Visual Trade Annotations :
- Clearly labeled "LONG" and "SHORT" markers appear at trade entries for better visualization.
- Grid levels are plotted dynamically to aid decision-making.
Strategy Logic :
- The script first calculates the ATR-based grid levels and ensures price action has sufficient volatility before allowing trades.
- An additional RSI filter is used to ensure trades are taken at ideal market conditions.
- Once a trade is executed, the script implements a trailing stop and predefined take profit to maximize gains while reducing risks.
---
Disclaimer :
Risk Warning :
This strategy is provided for educational and informational purposes only. Trading involves significant risk, and past performance is not indicative of future results. Users are advised to conduct their own due diligence and risk management before using this strategy in live trading.
The developer and publisher of this script are not responsible for any financial losses incurred by the use of this strategy. Market conditions, slippage, and execution quality can affect real-world trading outcomes.
Use this script at your own discretion and always trade responsibly.

VIDYA Auto-Trading(Reversal Logic)Overview
This script is a dynamic trend-following strategy based on the Variable Index Dynamic Average (VIDYA). It adapts in real time to market volatility, aiming to enhance entry precision and optimize risk management.
⚠️ This strategy is intended for educational and research purposes. Past performance does not guarantee future results. All results are based on historical simulations using fixed parameters.
Strategy Objectives
The objective of this strategy is to respond swiftly to sudden price movements and trend reversals, providing consistent and reliable trade signals under historical testing conditions. It is designed to be intuitive and efficient for traders of all levels.
Key Features
Momentum Sensitivity via VIDYA: Reacts quickly to momentum shifts, allowing for accurate trend-following entries.
Volatility-Based ATR Bands: Automatically adjusts stop levels and entry conditions based on current market volatility.
Intuitive Trend Visualization: Uptrends are marked with green zones, and downtrends with red zones, giving traders clear visual guidance.
Trading Rules
Long Entry: Triggered when price crosses above the upper band. Any existing short position is closed.
Short Entry: Triggered when price crosses below the lower band. Any existing long position is closed.
Exit Conditions: Positions are reversed based on signal changes, using a position reversal strategy.
Risk Management Parameters
Market: ETHUSD(5M)
Account Size: $3,000 (reasonable approximation for individual traders)
Commission: 0.02%
Slippage: 2 pip
Risk per Trade: 5% of account equity (adjusted to comply with TradingView guidelines for realistic risk levels)
Number of Trades: 251 (based on backtest over the selected dataset)
⚠️ The risk per trade and other values can be customized. Users are encouraged to adapt these to their individual needs and broker conditions.
Trading Parameters & Considerations
VIDYA Length: 10
VIDYA Momentum: 20
Distance factor for upper/lower bands: 2
Source: close
Visual Support
Trend zones, entry points, and directional shifts are clearly plotted on the chart. These visual cues enhance the analytical experience and support faster decision-making.
Visual elements are designed to improve interpretability and are not intended as financial advice or trade signals.
Strategy Improvements & Uniqueness
Inspired by the public work of BigBeluga, this script evolves the original concept with meaningful enhancements. By combining VIDYA and ATR bands, it offers greater adaptability and practical value compared to conventional trend-following strategies.
This adaptation is original work and not a direct copy. Improvements are designed to enhance usability, risk control, and market responsiveness.
Summary
This strategy offers a responsive and adaptive approach to trend trading, built on momentum detection and volatility-adjusted risk management. It balances clarity, precision, and practicality—making it a powerful tool for traders seeking reliable trend signals.
⚠️ All results are based on historical data and are subject to change under different market conditions. This script does not guarantee profit and should be used with caution and proper risk management.

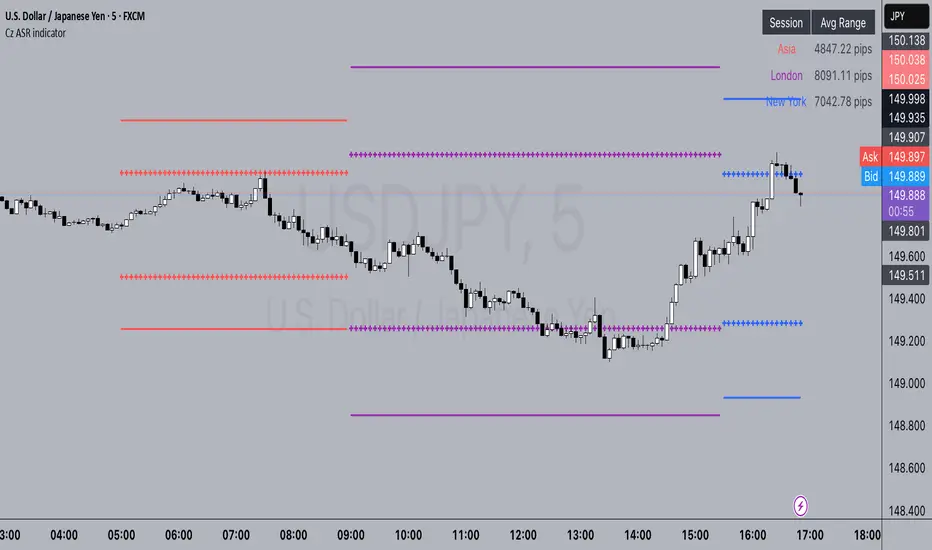
Cz ASR indicatorAverage session range indicator built by me. Great tool to gauge volatility and intraday reversal zones. Great for FX as there is an included table that shows range in pips; however, this can be applied across all assets as a volatility measure.
How it works:
The script measures the range of sessions, including Asia, London, and New York. The lookback period could be adjusted so you can find what length works best and is most accurate. This is then averaged out to provide the ASR. This provides us with an upper and lower bound of which the price could potentially fluctuate in based on the past session ranges. I have also added the 50% ASR, which is also a super useful metric for reversals or continuations.
There is also a configurable UTC so that you can adjust the indicator so it can accurately measure the range within certain sessions.
Note - different session start and stop times vary from market to market. I have set the code to the standard forex market opens however, if you wish to change the time ,you are able to do so by editing the variables in the script
Enjoy :)
ATR - Asymmetric Turbulence Ribbon🧭 Asymmetric Turbulence Ribbon (ATR)
The Asymmetric Turbulence Ribbon (ATR) is an enhanced and reimagined version of the standard Average True Range (ATR) indicator. It visualizes not just raw volatility, but the structure, momentum, and efficiency of volatility through a multi-layered visual approach.
It contains two distinct visual systems:
1. A zero-centered histogram that expresses how current volatility compares to its historical average, with intensity and color showing speed and conviction
2. A braided ribbon made of dual ATR-based moving averages that highlight transitions in volatility behavior—whether volatility is expanding or contracting
The name reflects its purpose: to capture asymmetric, evolving turbulence in market behavior, through structure-aware volatility tracking.
_______________________________________________________________
🔧 Inputs (Fibonacci defaults)
ATR Length
Lookback period for ATR calculation (default: 13)
ATR Base Avg. Length
Moving average period used as the zero baseline for histogram (default: 55)
ATR ROC Lookback
Number of bars to measure rate of change for histogram color mapping (default: 8)
Timeframe Override
Optionally calculate ATR values from a higher or fixed timeframe (e.g., 1D) for macro-volatility overlay
Show Ribbon Fill
Toggles colored fill between ATR EMA and HMA lines
Show ATR MAs
Toggles visibility of ATR EMA and HMA lines
Show Crossover Markers
Shows directional triangle markers where ATR EMA and HMA cross
Show Histogram
Toggles the entire histogram display
_______________________________________________________________
📊 Histogram Component: Volatility Energy Profile
The histogram shows how far the current ATR is from its moving average baseline, centered around zero. This lets you interpret volatility pressure—whether it's expanding, contracting, or preparing to reverse.
To complement this, the indicator also plots the raw ATR line in aqua. This is the actual average true range value—used internally in both the histogram and ribbon calculations. By default, it appears as a slightly thicker line, providing a clear reference point for comparing historical volatility trends and absolute levels.
Use the baseline ATR to:
- Compare real-time volatility to previous peaks or troughs
- Monitor how ATR behaves near histogram flips or ribbon crossovers
- Evaluate volatility phases in absolute terms alongside relative momentum
The ATR line is particularly helpful for users who want to keep tabs on raw volatility values while still benefiting from the enhanced visual storytelling of the histogram and ribbon systems.
Each histogram bar is colored based on the rate of change (ROC) in ATR: The faster ATR rises or falls, the more intense the color. Meanwhile, the opacity of each bar is adjusted by the effort/result ratio of the price candle (body vs. range), showing how much price movement was achieved with conviction.
Color Interpretation:
🔴 Red
Strong volatility expansion
Market entering or deepening into a volatility burst
Seen during breakouts, panic moves, or macro shock events
Often accompanied by large real candle bodies
🟠 Orange
Moderate volatility expansion
Heating up phase, often precedes breakouts
Common in strong trending environments
Signals tightening before acceleration
🟡 Yellow
Mild volatility increase
Transitional state—energy building, not yet exploding
Appears in early trend development or pullbacks
🟢 Green
Mild volatility contraction
ATR cooling off
Seen during consolidation, reversion, or range balance
Good time to assess upcoming directional setups
🔵 Aqua
Moderate compression
Volatility is clearly declining
Signals consolidation within larger structure
Pre-breakout zones often form here
🔵 Deep Blue
Strong volatility compression
Market is coiling or dormant
Can signal upcoming squeeze or fade environment
Often followed by sharp expansion
Opacity scaling:
Brighter bars = efficient, directional price action (strong bodies)
Faded bars = indecision, chop, absorption, or wick-heavy structure
Together, color and opacity give a 2D view of market volatility: Hue = the type and direction of volatility
Opacity = the quality and structure behind it
Use this to gauge whether volatility is rising with conviction, fading into neutrality, or compressing toward breakout potential.
_______________________________________________________________
🪡 Ribbon Component: Volatility Rhythm Structure
The ribbon overlays two moving averages of ATR:
EMA (yellow) – faster, more reactive
HMA (orange) – smoother, more rhythmic
Their relationship creates the ribbon logic:
Yellow fill (EMA > HMA)
Short-term volatility is increasing faster than the longer-term rhythm
Signals active expansion and engagement
Orange fill (HMA > EMA)
Volatility is decaying or leveling off
Suggests possible exhaustion, pullback, or range
Crossover triangle markers (optional, off by default to avoid clutter) identify the moment of shift in volatility phase.
The ribbon reflects the shape of volatility over time—ideal for mapping cyclical energy shifts, transitional states, and alignment between current and average volatility.
_______________________________________________________________
📐 Strategy Application
Use the Asymmetric Turbulence Ribbon to:
- Detect volatility expansions before breakouts or directional runs
- Spot compression zones that precede structural ruptures
- Visually separate efficient moves from noisy market activity
- Confirm or fade trade setups based on underlying energy state
- Track the volatility environment across multiple timeframes using the override
_______________________________________________________________
🎯 Ideal Timeframes
Designed to function across all timeframes, but particularly powerful on intraday to daily ranges (1H to 1D)
Use the timeframe override to anchor your chart in higher-timeframe volatility context, like daily ATR behavior influencing a 1H setup.
_______________________________________________________________
🧬 Customization Tips
- Increase ATR ROC Lookback for smoother color transitions
- Extend ATR Base Avg Length for more macro-driven histogram centering
- Disable the histogram for ribbon-only rhythm view
- Use opacity and color shifts in the histogram to detect stealth energy builds
- Align ATR phases with structure or order flow tools for high-quality setups

Litecoin Trailing-Stop StrategyAltcoins Trailing-Stop Strategy
This strategy is based on a momentum breakout approach using PKAMA (Powered Kaufman Adaptive Moving Average) as a trend filter, and a delayed trailing stop mechanism to manage risk effectively.
It has been designed and fine-tuned Altcoins, which historically shows consistent volatility patterns and clean trend structures, especially on intraday timeframes like 15m and 30m.
Strategy Logic:
Entry Conditions:
Long when PKAMA indicates an upward move
Short when PKAMA detects a downward trend
Minimum spacing of 30 bars between trades to avoid overtrading
Trailing Stop:
Activated only after a customizable delay (delayBars)
User can set trailing stop % and delay independently
Helps avoid premature exits due to short-term volatility
Customizable Parameters:
This strategy uses a custom implementation of PKAMA (Powered Kaufman Adaptive Moving Average), inspired by the work of alexgrover
PKAMA is a volatility-aware moving average that adjusts dynamically to market conditions, making it ideal for altcoins where trend strength and direction change frequently.
This script is for educational and experimental purposes only. It is not financial advice. Please test thoroughly before using it in live conditions, and always adapt parameters to your specific asset and time frame.
Feedback is welcome! Feel free to clone and adapt it for your own trading style.

Volatility Layered Supertrend [NLR]We’ve all used Supertrend, but do you know where to actually enter a trade? Volatility Layered Supertrend (VLS) is here to solve that! This advanced trend-following indicator builds on the classic Supertrend by not only identifying trends and their strength but also guiding you to the best trade entry points. VLS divides the main long-term trend into “Strong” and “Weak” Zones, with a clear “Trade Entry Zone” to help you time your trades with precision. With layered trends, dynamic profit targets, and volatility-adaptive bands, VLS delivers actionable signals for any market.
Why I Created VLS Over a Plain Supertrend
I built VLS to address the gaps in traditional Supertrend usage and make trade entries clearer:
Single-Line Supertrend Issues: The default Supertrend sets stop-loss levels that are too wide, making it impractical for most traders to use effectively.
Unclear Entry Points: Standard Supertrend doesn’t tell you where to enter a trade, often leaving you guessing or entering too early or late.
Multi-Line Supertrend Enhancement: Many traders use short, medium, and long Supertrends, which is helpful but can lack focus. In VLS, I include Short, Medium, and Long trends (using multipliers 1 to 3), and add multipliers 4 and 5 to track extra long-term trends—helping to avoid fakeouts that sometimes occur with multiplier 3.
My Solution: I focused on the main long-term Supertrend and split it into “Weak Zone” and “Strength Zone” to show the trend’s reliability. I also defined a “Trade Entry Zone” (starting from the Mid Point, with the first layer’s background hidden for clarity) to guide you on where to enter trades. The zones include Short, Medium, and Long Trend layers for precise entries, exits, and stop-losses.
Practical Trading: This approach provides realistic stop-loss levels, clear entry points, and a “Profit Target” line that aligns with your risk tolerance, while filtering out false signals with longer-term trends.
Key Features
Layered Trend Zones: Short, Medium, Long, and Extra Long Trend layers (up to multipliers 4 and 5) for timing entries and exits.
Strong & Weak Zones: See when the trend is reliable (Strength Zone) or needs caution (Weak Zone).
Trade Entry Zone: A dedicated zone starting from the Mid Point (first layer’s background hidden) to show the best entry points.
Dynamic Profit Targets: A “Profit Target” line that adjusts with the trend for clear goals.
Volatility-Adaptive: Uses ATR to adapt to market conditions, ensuring reliable signals.
Color-Coded: Green for uptrends, red for downtrends—simple and clear.
How It Works
VLS enhances the main long-term Supertrend by dividing it into two zones:
Weak Zone: Indicates a less reliable trend—use tighter stop-losses or wait for the price to reach the Trade Entry Zone.
Strength Zone: Signals a strong trend—ideal for entries with wider stop-losses for bigger moves.
The “Trade Entry Zone” starts at the Mid Point (last layer’s background hidden for clarity), showing you the best area to enter trades. Each zone includes Short, Medium, Long, and Extra Long Trend sublevels (up to multipliers 4 and 5) for precise trade timing and to filter out fakeouts. The “Profit Target” updates dynamically based on trend direction and volatility, giving you a clear goal.
How to Use
Spot the Trend: Green bands = buy, red bands = sell.
Check Strength: Price in Strength Zone? Trend’s reliable—trade confidently. In Weak Zone? Use tighter stops or wait.
Enter Trades: Use the “Trade Entry Zone” (from the Mid Point upward) for the best entry points.
Use Sublevels: Short, Medium, Long, and Extra Long layers in each zone help fine-tune entries and exits.
Set Targets: Follow the Profit Target line for goals—it updates automatically.
Combine Tools: Pair with RSI, MACD, or support/resistance for added confirmation.
Settings
ATR Length: Adjust the ATR period (default 10) to change sensitivity.
Up/Down Colors: Customize colors—green for up, red for down, by default.

ATRs in Days📌 ATR in Days
This script tracks how price moves in relation to ATR over multiple days, providing a powerful volatility framework for traders.
🔹 Key Features:
✅ 4 ATRs in 5 Days – Measures if a stock has moved 4x its ATR within the last 5 days, identifying extreme volatility zones.
✅ Daily ATR Calculation – Tracks average true range over time to gauge market conditions.
✅ Clear Table Display – Real-time ATR readings for quick decision-making.
✅ Intraday & Swing Trading Compatible – Works across multiple timeframes for day traders & swing traders.
📊 How to Use:
Look for stocks that exceed 4 ATRs in 5 days to spot extended moves.
Use ATR as a reversion or continuation signal depending on market structure.
🚀 Perfect for traders looking to quantify volatility & structure trades effectively!

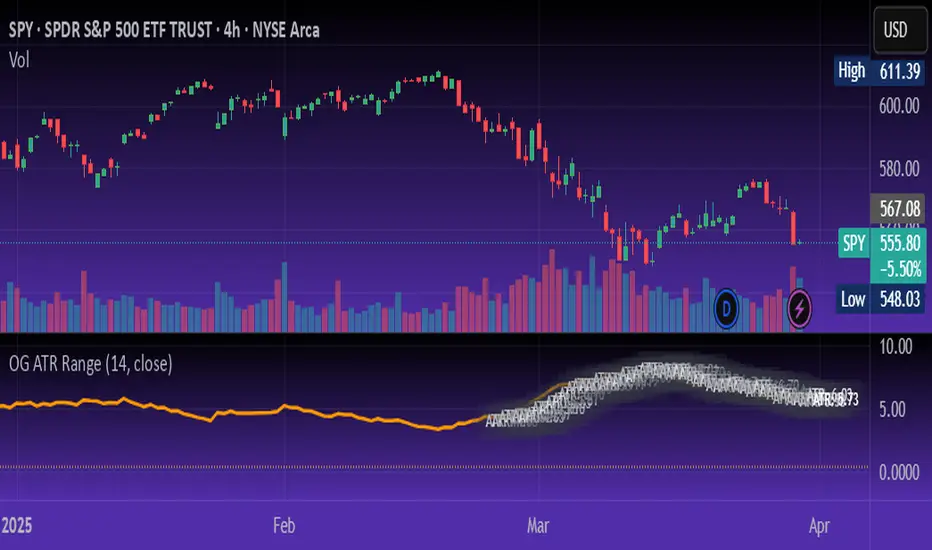
OG ATR RangeDescription:
The OG ATR Tool is a clean, visualized version of the Average True Range indicator for identifying volatility, stop-loss levels, and realistic price movement expectations.
How it works:
Calculates the average range (in points/pips) of recent candles.
Overlays ATR bands to help define breakout potential or squeeze zones.
Can be used to size trades or set dynamic stop-loss and target levels.
Best for:
Intraday traders who want to avoid unrealistic targets.
Volatility-based setups and breakout strategies.
Creating position sizing rules based on instrument volatility.
Pro Tip: Combine with your trend indicators to set sniper entries and exits that respect volatility.
Long Term Profitable Swing | AbbasA Story of a Profitable Swing Trading Strategy
Imagine you're sailing across the ocean, looking for the perfect wave to ride. Swing trading is quite similar—you're navigating the stock market, searching for the ideal moments to enter and exit trades. This strategy, created by Abbas, helps you find those waves and ride them effectively to profitable outcomes.
🌊 Finding the Perfect Wave (Entry)
Our journey begins with two simple signs that tell us a great trading opportunity is forming:
- Moving Averages: We use two lines that follow price trends—the faster one (EMA 16) reacts quickly to recent price moves, and the slower one (EMA 30) gives us a longer-term perspective. When the faster line crosses above the slower line, it's like a clear signal saying, "Hey! The wave is rising, and prices might move higher!"
- RSI Momentum: Next, we check a tool called the RSI, which measures momentum (how strongly prices are moving). If the RSI number is above 50, it means there's enough strength behind this rising wave to carry us forward.
When both signals appear together, that's our green light. It's time to jump on our surfboard and start riding this promising wave.
⚓ Safely Riding the Wave (Risk Management)
While we're riding this wave, we want to ensure we're safe from sudden surprises. To do this, we use something called the Average True Range (ATR), which measures how volatile (or bumpy) the price movements are:
- Stop-Loss: To avoid falling too hard, we set a safety line (stop-loss) 8 times the ATR below our entry price. This helps ensure we exit if the wave suddenly turns against us, protecting us from heavy losses.
- Take Profit: We also set a goal to exit the trade at 11 times the ATR above our entry. This way, we capture significant profits when the wave reaches a nice high point.
🌟 Multiple Rides, Bigger Adventures
This strategy allows us to take multiple positions simultaneously—like riding several waves at once, up to 5. Each trade we make uses only 10% of our trading capital, keeping risks manageable and giving us multiple opportunities to win big.
🗺️ Easy to Follow Settings
Here are the basic settings we use:
- Fast EMA**: 16
- Slow EMA**: 30
- RSI Length**: 9
- RSI Threshold**: 50
- ATR Length**: 21
- ATR Stop-Loss Multiplier**: 8
- ATR Take-Profit Multiplier**: 11
These settings are flexible—you can adjust them to better suit different markets or your personal trading style.
🎉 Riding the Waves of Success
This simple yet powerful swing trading approach helps you confidently enter trades, clearly know when to exit, and effectively manage your risk. It’s a reliable way to ride market waves, capture profits, and minimize losses.
Happy trading, and may you find many profitable waves to ride! 🌊✨
Please test, and take into account that it depends on taking multiple longs within the swing, and you only get to invest 25/30% of your equity.
