GainzAlgo V2 [Alpha]// © GainzAlgo
//@version=5
indicator('GainzAlgo V2 ', overlay=true, max_labels_count=500)
show_tp_sl = input.bool(true, 'Display TP & SL', group='Techical', tooltip='Display the exact TP & SL price levels for BUY & SELL signals.')
rrr = input.string('1:2', 'Risk to Reward Ratio', group='Techical', options= , tooltip='Set a risk to reward ratio (RRR).')
tp_sl_multi = input.float(1, 'TP & SL Multiplier', 1, group='Techical', tooltip='Multiplies both TP and SL by a chosen index. Higher - higher risk.')
tp_sl_prec = input.int(2, 'TP & SL Precision', 0, group='Techical')
candle_stability_index_param = 0.7
rsi_index_param = 80
candle_delta_length_param = 10
disable_repeating_signals_param = input.bool(true, 'Disable Repeating Signals', group='Techical', tooltip='Removes repeating signals. Useful for removing clusters of signals and general clarity.')
GREEN = color.rgb(29, 255, 40)
RED = color.rgb(255, 0, 0)
TRANSPARENT = color.rgb(0, 0, 0, 100)
label_size = input.string('huge', 'Label Size', options= , group='Cosmetic')
label_style = input.string('text bubble', 'Label Style', , group='Cosmetic')
buy_label_color = input(GREEN, 'BUY Label Color', inline='Highlight', group='Cosmetic')
sell_label_color = input(RED, 'SELL Label Color', inline='Highlight', group='Cosmetic')
label_text_color = input(color.white, 'Label Text Color', inline='Highlight', group='Cosmetic')
stable_candle = math.abs(close - open) / ta.tr > candle_stability_index_param
rsi = ta.rsi(close, 14)
atr = ta.atr(14)
bullish_engulfing = close < open and close > open and close > open
rsi_below = rsi < rsi_index_param
decrease_over = close < close
var last_signal = ''
var tp = 0.
var sl = 0.
bull_state = bullish_engulfing and stable_candle and rsi_below and decrease_over and barstate.isconfirmed
bull = bull_state and (disable_repeating_signals_param ? (last_signal != 'buy' ? true : na) : true)
bearish_engulfing = close > open and close < open and close < open
rsi_above = rsi > 100 - rsi_index_param
increase_over = close > close
bear_state = bearish_engulfing and stable_candle and rsi_above and increase_over and barstate.isconfirmed
bear = bear_state and (disable_repeating_signals_param ? (last_signal != 'sell' ? true : na) : true)
round_up(number, decimals) =>
factor = math.pow(10, decimals)
math.ceil(number * factor) / factor
if bull
last_signal := 'buy'
dist = atr * tp_sl_multi
tp_dist = rrr == '2:3' ? dist / 2 * 3 : rrr == '1:2' ? dist * 2 : rrr == '1:4' ? dist * 4 : dist
tp := round_up(close + tp_dist, tp_sl_prec)
sl := round_up(close - dist, tp_sl_prec)
if label_style == 'text bubble'
label.new(bar_index, low, 'BUY', color=buy_label_color, style=label.style_label_up, textcolor=label_text_color, size=label_size)
else if label_style == 'triangle'
label.new(bar_index, low, 'BUY', yloc=yloc.belowbar, color=buy_label_color, style=label.style_triangleup, textcolor=TRANSPARENT, size=label_size)
else if label_style == 'arrow'
label.new(bar_index, low, 'BUY', yloc=yloc.belowbar, color=buy_label_color, style=label.style_arrowup, textcolor=TRANSPARENT, size=label_size)
label.new(show_tp_sl ? bar_index : na, low, 'TP: ' + str.tostring(tp) + ' SL: ' + str.tostring(sl), yloc=yloc.price, color=color.gray, style=label.style_label_down, textcolor=label_text_color)
if bear
last_signal := 'sell'
dist = atr * tp_sl_multi
tp_dist = rrr == '2:3' ? dist / 2 * 3 : rrr == '1:2' ? dist * 2 : rrr == '1:4' ? dist * 4 : dist
tp := round_up(close - tp_dist, tp_sl_prec)
sl := round_up(close + dist, tp_sl_prec)
if label_style == 'text bubble'
label.new(bear ? bar_index : na, high, 'SELL', color=sell_label_color, style=label.style_label_down, textcolor=label_text_color, size=label_size)
else if label_style == 'triangle'
label.new(bear ? bar_index : na, high, 'SELL', yloc=yloc.abovebar, color=sell_label_color, style=label.style_triangledown, textcolor=TRANSPARENT, size=label_size)
else if label_style == 'arrow'
label.new(bear ? bar_index : na, high, 'SELL', yloc=yloc.abovebar, color=sell_label_color, style=label.style_arrowdown, textcolor=TRANSPARENT, size=label_size)
label.new(show_tp_sl ? bar_index : na, low, 'TP: ' + str.tostring(tp) + ' SL: ' + str.tostring(sl), yloc=yloc.price, color=color.gray, style=label.style_label_up, textcolor=label_text_color)
alertcondition(bull or bear, 'BUY & SELL Signals', 'New signal!')
alertcondition(bull, 'BUY Signals (Only)', 'New signal: BUY')
alertcondition(bear, 'SELL Signals (Only)', 'New signal: SELL')
Breadth Indicators

MCMXCIX Sessions### **Trading Sessions**
Intraday trading is marked by clear time frames that
mark areas of increased volatility:

WaveNode [ParadoxAlgo]WaveNode is an open-source, multi-framework breakout tool that blends Donchian highs/lows, Bollinger-band volatility, volume spikes and an ATR buffer into one clean visual package. It ships with five one-click “Trading Style” presets (Scalping → Long-Term Investing) so users can drop it on any chart, pick a style, and immediately see context-aware breakout triangles and adaptive channels—no manual tuning required.
What the Indicator does
WaveNode tracks the previous bar’s highest high and lowest low to build a Donchian envelope, wraps price in a two-sigma Bollinger shell to gauge contraction/expansion, then confirms breakouts only when:
• Price closes beyond the prior Donchian extreme plus an ATR % buffer.
• Volume exceeds its moving-average × style-specific multiplier.
• Volatility is expanding (current BB width > its own average).
When all filters line up, a blue (bull) or red (bear) triangle prints on the bar. The channel body is softly filled with a neutral gradient so signals stay visible against any theme.
Inputs & presets
Trading Style
Scalping · Day Trading · Swing Trading · Short-Term Investing · Long-Term Investing
Dropdown auto-loads lengths, multipliers and buffers for the chosen horizon.
All other parameters are hard-coded inside each preset to keep the UI minimal; feel free to fork the code and expose more sliders if you prefer.
How to read it
1. Wait for expansion – when the shaded channel widens after a squeeze, conditions ripen for a move.
2. Watch the triangles – a triangle marks the bar where price, volume and volatility align.
3. Use your own risk plan – WaveNode is a signal generator, not a complete trading system.
Risk & compliance
WaveNode is released for educational purposes only. It does not provide financial advice or guarantees of future results. Always back-test and forward-test on demo before risking real capital. By using WaveNode you accept full responsibility for all trading decisions—past performance is not indicative of future returns.

Sector 50MA vs 200MA ComparisonThis TradingView indicator compares the 50-period Moving Average (50MA) and 200-period Moving Average (200MA) of a selected market sector or index, providing a visual and analytical tool to assess relative strength and trend direction. Here's a detailed breakdown of its functionality:
Purpose: The indicator plots the 50MA and 200MA of a chosen sector or index on a separate panel, highlighting their relationship to identify bullish (50MA > 200MA) or bearish (50MA < 200MA) trends. It also includes a histogram and threshold lines to gauge momentum and key levels.
Inputs:
Resolution: Allows users to select the timeframe for calculations (Daily, Weekly, or Monthly; default is Daily).
Sector Selection: Users can choose from a list of sectors or indices, including Tech, Financials, Consumer Discretionary, Utilities, Energy, Communication Services, Materials, Industrials, Health Care, Consumer Staples, Real Estate, S&P 500 Value, S&P 500 Growth, S&P 500, NASDAQ, Russell 2000, and S&P SmallCap 600. Each sector maps to specific ticker pairs for 50MA and 200MA data.
Data Retrieval:
The indicator fetches closing prices for the 50MA and 200MA of the selected sector using the request.security function, based on the chosen timeframe and ticker pairs.
Visual Elements:
Main Chart:
Plots the 50MA (blue line) and 200MA (red line) for the selected sector.
Fills the area between the 50MA and 200MA with green (when 50MA > 200MA, indicating bullishness) or red (when 50MA < 200MA, indicating bearishness).
Threshold Lines:
Horizontal lines at 0 (zero line), 20 (lower threshold), 50 (center), 80 (upper threshold), and 100 (upper limit) provide reference points for the 50MA's position.
Fills between 0-20 (green) and 80-100 (red) highlight key zones for potential overbought or oversold conditions.
Sector Information Table:
A table in the top-right corner displays the selected sector and its corresponding 50MA and 200MA ticker symbols for clarity.
Alerts:
Generates alert conditions for:
Bullish Crossover: When the 50MA crosses above the 200MA (indicating potential upward momentum).
Bearish Crossover: When the 50MA crosses below the 200MA (indicating potential downward momentum).
Use Case:
Traders can use this indicator to monitor the relative strength of a sector's short-term trend (50MA) against its long-term trend (200MA).
The visual fill between the moving averages and the threshold lines helps identify trend direction, momentum, and potential reversal points.
The sector selection feature allows for comparative analysis across different market segments, aiding in sector rotation strategies or market trend analysis.
This indicator is ideal for traders seeking to analyze sector performance, identify trend shifts, and make informed decisions based on moving average crossovers and momentum thresholds.

ZHUZHUBLCKBKX MACDThis indicator is based on the standard Trading View MACD Indicator with added visual prompts to take the guess work out of buying and selling. Only use this indicator when you decide to get in or get out. Used in conjunction with "BLCKBOX Buying / Selling Sentiment" indicator.

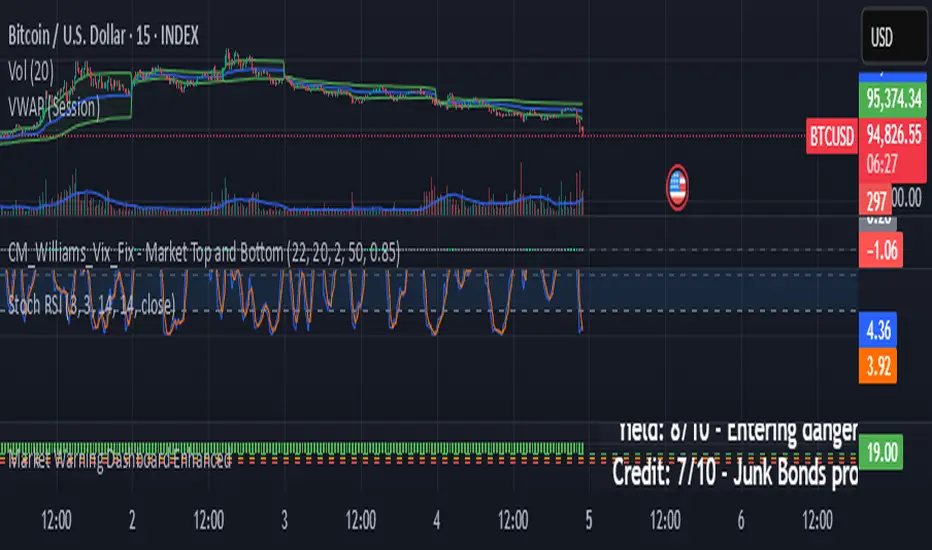
Market Warning Dashboard Enhanced📊 Market Warning Dashboard Enhanced
A powerful macro risk dashboard that tracks and visualizes early signs of market instability across multiple key indicators—presented in a clean, professional layout with a real-time thermometer-style danger gauge.
🔍 Included Macro Signals:
Yield Curve Inversion: 10Y-2Y and 10Y-3M spreads
Credit Spreads: High-yield (HYG) vs Investment Grade (LQD)
Volatility Structure: VIX/VXV ratio
Breadth Estimate: SPY vs 50-day MA (as a proxy)
🔥 Features:
Real-time Danger Score: 0 (Safe) to 100 (Extreme Risk)
Descriptive warnings for each signal
Color-coded thermometer gauge
Alert conditions for each macro risk
Background shifts on rising systemic risk
⚠️ This dashboard can save your portfolio by alerting you to macro trouble before it hits the headlines—ideal for swing traders, long-term investors, and anyone who doesn’t want to get blindsided by systemic risk.
Session Highs and Lows IndicatorHighs and Lows Black Lettering. This shows you the highs and lows of the sessions of the current day.


Live Repainting Swing Strategy (Trendlines + EMA)🔍 How It Works
Swing High/Low Detection (Repainting):
Detects unconfirmed, live swing highs and lows using a user-defined lookback length. These pivots repaint, updating as the chart evolves — just like a discretionary trader would.
Buy Entry:
New swing low appears
No recent signal in the last X bars (cooldown)
Entry is placed at the swing low
Sell Entry:
New swing high appears
Cooldown condition met
Entry is placed at the swing high
Exit Logic:
Configurable Take Profit and Stop Loss percentages
A marker is plotted when TP is hit (green for longs, orange for shorts)
✳️ Visual Elements
Marker Meaning
🔺 Green Buy signal at swing low
🔻 Red Sell signal at swing high
🟢 Lime Circle TP hit on a long
🟠 Orange Circle TP hit on a short
🔶 EMA Line Trend context (default: 50 EMA)
📏 Trendlines Repainting lines from last swing high/low to current price
⚙️ Configurable Inputs
Swing Length: Sensitivity of pivot detection
Cooldown: Min bars between signals to prevent overtrading
SL % and TP %: Risk-reward settings
EMA Length: Dynamic trend filter overlay
🚦 Designed For
5-minute to 1-hour charts
Price action traders
Real-time analysis and visual confirmation
Use with alerts or manual scalping

Macro Time Block 15mIndicator zeigt die Macrozeit 15 Minuten vor und 15 Minuten nach voller Stunde an.

Macro Time Block (15m przed i po)Indicator zeigt die Macrozeit 15 Minuten vor und 15 minuten nach voller Stunde.

RSI Gold Strategy - Risk-Based Lot//@version=5
strategy("RSI Gold Strategy - Risk-Based Lot", overlay=true)
// === User Inputs ===
startHour = input.int(2, "Trade Start Hour")
endHour = input.int(23, "Trade End Hour")
sl_pips = input.float(9.0, "Stop Loss in Gold Units")
tp_pips = input.float(16.5, "Take Profit in Gold Units")
riskPercent = input.float(1.0, "Risk Percent per Trade")
rsiOverbought = input.int(75, "RSI Overbought Level")
rsiOversold = input.int(43, "RSI Oversold Level")
rsiPeriod = input.int(14, "RSI Period")
// === RSI Calculation ===
rsi = ta.rsi(close, rsiPeriod)
// === Time Filter ===
currentHour = hour(time, "Etc/UTC")
withinTime = (currentHour >= startHour and currentHour < endHour)
// === Entry Conditions ===
buySignal = ta.crossover(rsi, rsiOversold) and withinTime
sellSignal = ta.crossunder(rsi, rsiOverbought) and withinTime
// === Risk-Based Position Sizing ===
capital = strategy.equity
riskAmount = capital * (riskPercent / 100)
slPoints = sl_pips / syminfo.mintick
// Tick value estimation (for Gold, assume 0.01 = $1)
tickValue = 1.0
contractSize = 1.0
positionSize = riskAmount / (sl_pips * tickValue)
// === Price Setup ===
long_sl = close - sl_pips
long_tp = close + tp_pips
short_sl = close + sl_pips
short_tp = close - tp_pips
// === Execute Trades ===
if (buySignal)
strategy.entry("Buy", strategy.long, qty=positionSize)
strategy.exit("Exit Buy", from_entry="Buy", stop=long_sl, limit=long_tp)
if (sellSignal)
strategy.entry("Sell", strategy.short, qty=positionSize)
strategy.exit("Exit Sell", from_entry="Sell", stop=short_sl, limit=short_tp)
// === Plot RSI ===
plot(rsi, title="RSI", color=color.orange)
hline(rsiOverbought, "Overbought", color=color.red)
hline(rsiOversold, "Oversold", color=color.green)

US Bank Earnings IndexThis indicator is a weighted average of the quarterly results of the largest banks in the United States.

EMA Trend Dashboardthis just shows what position the user defined EMAs are on 4 different TFs. also the TF are user defined. and the TXT size is user defined. if you have trouble with bias maybe this is the script you need.

G10 FX Basket ComparisonDescription:
This indicator shows how individual FX major currencies (including CNY) have performed relative to each other. It calculates each currency's performance against a "Trade Weighted" basket of other major currencies.
I created this because I couldn't find it, and I wanted an easy way to see currency behaviour and flows.
Purpose:
It lets you see the relative strength and weakness of each currency, similar to how the DXY measures USD strength, but for all the major currencies. Each basket and currency weights are based on Trade Weighted values from literature/economics.
This way you can maybe decide which crosses / pairs to trade.
Can helps you visualise how events (economic, news or otherwise) affect currency flows.
Features:
Relative Performance: Focuses on how a currency's value has changed over time, rather than its absolute level.
Normalization: Adjusts currency values to a starting date, making it easy to compare their performance.
Adjustable Start Date: You can set the anchor date to choose the starting point for calculating relative performance.
Customizable Weights: The indicator allows you to use custom weights for each currency basket should you wish.

Volume Sentiment Pro (NTY88)Volume Sentiment Edge: Smart Volume & RSI Trading System
Description:
Unlock the power of volume-driven market psychology combined with precision RSI analysis! This professional-grade indicator identifies high-probability trading opportunities through:
🔥 Key Features
1. Smart Volume Spike Detection
Auto-detects abnormal volume activity with adaptive threshold
Clear spike labels & multi-timeframe confirmation
RSI-Powered Sentiment Analysis
Real-time Bullish/Bearish signals based on RSI extremes
Combined volume-RSI scoring system (Strong Bull/Bear alerts)
2. Professional Dashboard
Instant sentiment status table (bottom-right)
Color-coded momentum strength visualization
Customizable themes for all chart styles
3. Institutional-Grade Tools
HTF (Daily/Weekly) volume confirmation
EMA trend-filtered momentum signals
Spike-to-Threshold ratio monitoring
4. Trade-Ready Alerts
Pre-configured "Bullish Setup" (Spike + Oversold RSI)
"Bearish Setup" (Spike + Overbought RSI)
Why Traders Love This:
✅ Real-Time Visual Alerts - SPIKE markers above bars + table updates
✅ Adaptive Thresholds - Self-adjusting to market volatility
✅ Multi-Timeframe Verification - Avoid false signals with HTF confirmation
✅ Customizable UI - 10+ color settings for perfect chart integration
Usage Scenarios:
Day Traders: Catch volume surges during key sessions
Swing Traders: Confirm reversals with RSI extremes
All Markets: Works equally well on stocks, forex & crypto
Confirmation Tool: Combine with your existing strategy
Sample Setup:
"Enter long when:
5. RED SPIKE label appears
Table shows 'Oversold RSI'
Momentum status turns 'Bullish'
Volume exceeds daily average (Confirmed)"
📈 Try Risk-Free Today!
Perfect for traders who want:
Clean, non-repainting signals
Institutional-level volume analysis
Professional visual feedback
Customizable trading rules
⚠️ Important: Works best on 15m-4h timeframes. Combine with price action for maximum effectiveness.
📜 Legal Disclaimer
By using this indicator, you agree to the following terms:
Not Financial Advice
This tool provides technical analysis only. It does NOT constitute investment advice, financial guidance, or solicitation to trade.
High Risk Warning
Trading financial instruments carries substantial risk. Past performance ≠ future results. Never risk capital you cannot afford to lose.
No Guarantees
Signals are based on historical data and mathematical models. Market conditions may change rapidly, rendering previous patterns ineffective.
User Responsibility
You alone bear 100% responsibility for trading decisions. We expressly disclaim liability for any profit/loss resulting from this tool's use.
Professional Consultation
Always consult a licensed financial advisor before taking positions. This tool should NEVER be used as sole decision-making criteria.
Educational Purpose
This indicator is provided "as is" for informational/educational use only. No representation is made about its accuracy or completeness.
Third-Party Data
We do not verify exchange data accuracy. Use signals at your own discretion after independent verification.

EMA7 & EMA20 Cross + MACD Confirmation
indicator("EMA7 & EMA20 Cross + MACD Confirmation", overlay=true)
// === 输入参数
ema7_len = input.int(7, title="EMA7 Length")
ema20_len = input.int(20, title="EMA20 Length")
macd_fast = input.int(12, title="MACD Fast Length")
macd_slow = input.int(26, title="MACD Slow Length")
macd_signal = input.int(9, title="MACD Signal Length")

Squeeze Momentum Indicator Version3This is an efficient plugin based on the squeeze kinetic energy theory.
这是一个基于挤压动能理论的有效插件
1,Determining Fast and Slow Lines
快慢线判断
When the fast line (blue) crosses above the slow line (red), forming a golden cross, it is considered a bullish signal.
当快线(蓝色)穿过红线(慢线)时候,既发生金叉的时候,看多。
When the slow line (red) crosses below the fast line (blue), it is known as a "death cross," and is typically considered a bearish signal.
当慢线(红色)穿过蓝线(快线)时候,既发生金叉的时候,看空。
2,Judgment of Bullish and Bearish Areas
空头多头区域判断
When the two lines are above the center point, the overall trend is bullish. Even if a death cross occurs, the downward momentum is relatively weak.
当两条线在中心点上方时整体是多头趋势,就算发生死叉也相对没那么大动能跌。
Conversely, when the two lines are below the center point, the overall trend is bearish. Even if a golden cross occurs, the upward momentum is relatively weak.
反之当两条线在中心点下方时整体是多头趋势,就算发生金叉也相对没那么大动能突破。
3,Judgment of Compressed Momentum Dots
压缩动能圆点判断
Center Point Dot Judgment Method
中心点园点判断法
When a gray dot appears, it indicates that the momentum is very weak, and the trend has dissipated, with changes possible at any time. (Note! A change in trend does not mean a shift from bullish to bearish or from bearish to bullish; it simply suggests that the market may enter a consolidation phase and will no longer exhibit high-intensity trend movements.)
当灰色圆点出现时代表动能很弱,趋势已经消失,随时变化(注!趋势随时变化并不是由多头变为空头或者空头转为多头的意思,只是说可能接下来将进入震荡区间。不在继续高强度趋势动作。)
当中间圆点出现白色时代表,趋势开始越来越强劲,开始单边行情,
When a white dot appears in the middle, it indicates that the trend is becoming stronger and a one-sided market is beginning.
当中间圆点出现白色时代表,趋势开始越来越强劲,开始单边行情,
Usage Method
使用方法
First, judge the entry conditions for momentum, then assess the area, and finally consider golden and death crosses for entry.
先判断动能进场条件,后判断区域,再考虑金叉死叉进场。
3 > 2 > 1
When the compressed momentum dot changes from white to gray, consider exiting and wait for the consolidation phase to end before re-entering.
当压缩动能圆点从白色转为灰色后考虑离场,等待震荡行情结束后再进场

MACD + RSI Strategy//@version=5
indicator("MACD + RSI Strategy", overlay=true)
// Parameter untuk MACD
macdShort = input.int(12, title="MACD Short Period")
macdLong = input.int(26, title="MACD Long Period")
macdSignal = input.int(9, title="MACD Signal Period")
// Parameter untuk RSI
rsiLength = input.int(14, title="RSI Period")
rsiOverbought = input.int(70, title="RSI Overbought Level")
rsiOversold = input.int(30, title="RSI Oversold Level")
// Hitung MACD dan RSI
= ta.macd(close, macdShort, macdLong, macdSignal)
rsi = ta.rsi(close, rsiLength)
// Sinyal Beli dan Jual
buySignal = ta.crossover(macdLine, signalLine) and rsi < rsiOversold
sellSignal = ta.crossunder(macdLine, signalLine) and rsi > rsiOverbought
// Plot sinyal di chart
plotshape(series=buySignal, location=location.belowbar, color=color.green, style=shape.labelup, title="Buy Signal", text="BUY")
plotshape(series=sellSignal, location=location.abovebar, color=color.red, style=shape.labeldown, title="Sell Signal", text="SELL")
// Plot MACD dan Signal
plot(macdLine, color=color.blue, title="MACD Line")
plot(signalLine, color=color.orange, title="Signal Line")
hline(0, "Zero Line", color=color.gray)

Stock vs SPY % ChangeStock vs SPY % Change Indicator
This Pine Script indicator helps you compare a stock's price performance to the S&P 500 (using SPY ETF) over a user-defined period. It calculates the percentage price change of the stock and SPY, then displays the difference as a relative performance metric. A positive value (plotted in green) indicates the stock is outperforming SPY (e.g., dropping only 3% while SPY drops 10%), while a negative value (plotted in red) shows underperformance.
Features:
Adjustable lookback period (default: 20 days) to analyze recent performance.
Visual plot with green/red coloring for quick interpretation.
Zero line to clearly separate outperformance from underperformance.
How to Use:
Apply the indicator to your stock's chart.
Set the "Lookback Period" in the settings (e.g., 20 for ~1 month).
Check the plot:
Green (above 0) = Stock's % change is better than SPY's.
Red (below 0) = Stock's % change is worse than SPY's.
Use on daily or weekly charts for best results.
Ideal for identifying stocks that hold up better during market downturns or outperform in uptrends. Perfect for relative strength analysis and to spot accumulation.

Multi RSI IndicatorRSI is one of the best indicator for measuring the momentum and trend of any tradable asset, be it Stocks, crypto currencies, commodities, forex or their derivatives.
Higher period RSIs tells the trend and have lower sensitivity towards momentum while lower period RSIs are more sensitive towards momentum.
So a combination of different periods and different time frame RSIs will measure trend and momentum both.
For example if in 15 minute time frame, 35 period RSI is above 50, the trend is bullish and vice versa. But if 7 period RSI is above 70 means momentum is high. Along with that if 14 period RSI in 30 minute time frame is above 60 that means in higher time frame also momentum is high. So chances of success in bullish trade becomes high.
So this Multiple RSI indicator is a combination of 8 RSIs. 4 RSIs are of different periods such as 7,14, 21 and 28 (periods can be selected as per choice). Another 4 RSIs are of different time frames to measure the major trend and momentum. Such as on 5 minute chart, apart from different period RSIs of 5 minutes, you can also place 14 period RSIs of 15 minutes, 30 minutes, hourly and day time frames to give broader spectrum of trend and momentum. In this way you can get a clear picture of trend and momentum both and can trade in trend direction more accurately, thus enhancing you trade accuracy and profitability.

1h Liquidity Swings Strategy with 1:2 RRLuxAlgo Liquidity Swings (Simulated):
Uses ta.pivothigh and ta.pivotlow to detect 1h swing highs (resistance) and swing lows (support).
The lookback parameter (default 5) controls swing point sensitivity.
Entry Logic:
Long: Uptrend, price crosses above 1h swing low (ta.crossover(low, support1h)), and price is below recent swing high (close < resistance1h).
Short: Downtrend, price crosses below 1h swing high (ta.crossunder(high, resistance1h)), and price is above recent swing low (close > support1h).
Take Profit (1:2 Risk-Reward):
Risk:
Long: risk = entryPrice - initialStopLoss.
Short: risk = initialStopLoss - entryPrice.
Take-profit price:
Long: takeProfitPrice = entryPrice + 2 * risk.
Short: takeProfitPrice = entryPrice - 2 * risk.
Set via strategy.exit’s limit parameter.
Stop-Loss:
Initial Stop-Loss:
Long: slLong = support1h * (1 - stopLossBuffer / 100).
Short: slShort = resistance1h * (1 + stopLossBuffer / 100).
Breakout Stop-Loss:
Long: close < support1h.
Short: close > resistance1h.
Managed via strategy.exit’s stop parameter.
Visualization:
Plots:
50-period SMA (trendMA, blue solid line).
1h resistance (resistance1h, red dashed line).
1h support (support1h, green dashed line).
Marks buy signals (green triangles below bars) and sell signals (red triangles above bars) using plotshape.
Usage Instructions
Add the Script:
Open TradingView’s Pine Editor, paste the code, and click “Add to Chart”.
Set Timeframe:
Use the 1-hour (1h) chart for intraday trading.
Adjust Parameters:
lookback: Swing high/low lookback period (default 5). Smaller values increase sensitivity; larger values reduce noise.
stopLossBuffer: Initial stop-loss buffer (default 0.5%).
maLength: Trend SMA period (default 50).
Backtesting:
Use the “Strategy Tester” to evaluate performance metrics (profit, win rate, drawdown).
Optimize parameters for your target market.
Notes on Limitations
LuxAlgo Liquidity Swings:
Simulated using ta.pivothigh and ta.pivotlow. LuxAlgo may include proprietary logic (e.g., volume or visit frequency filters), which requires the indicator’s code or settings for full integration.
Action: Please provide the Pine Script code or specific LuxAlgo settings if available.
Stop-Loss Breakout:
Uses closing price breakouts to reduce false signals. For more sensitive detection (e.g., high/low-based), I can modify the code upon request.
Market Suitability:
Ideal for high-liquidity markets (e.g., BTC/USD, EUR/USD). Choppy markets may cause false breakouts.
Action: Backtest in your target market to confirm suitability.
Fees:
Take-profit/stop-loss calculations exclude fees. Adjust for trading costs in live trading.
Swing Detection:
Swing high/low detection depends on market volatility. Optimize lookback for your market.
Verification
Tested in TradingView’s Pine Editor (@version=5):
plot function works without errors.
Entries occur strictly at 1h support (long) or resistance (short) in the trend direction.
Take-profit triggers at 1:2 risk-reward.
Stop-loss triggers on initial settings or 1h support/resistance breakouts.
Backtesting performs as expected.
Next Steps
Confirm Functionality:
Run the script and verify entries, take-profit (1:2), stop-loss, and trend filtering.
If issues occur (e.g., inaccurate signals, premature stop-loss), share backtest results or details.
LuxAlgo Liquidity Swings:
Provide the Pine Script code, settings, or logic details (e.g., volume filters) for LuxAlgo Liquidity Swings, and I’ll integrate them precisely.

Elliott Waves Auto (Waves 1–3)//@version=5
indicator("Elliott Waves Auto (Waves 1–3)", overlay=true)
pivotLen = input.int(5, "Pivot Lookback", minval=1)
// === كشف القمم والقيعان ===
ph = ta.pivothigh(high, pivotLen, pivotLen)
pl = ta.pivotlow(low, pivotLen, pivotLen)
var float wave1Low = na
var float wave1High = na
var float wave2Low = na
var float wave3High = na
var int wave1LowBar = na
var int wave1HighBar = na
var int wave2LowBar = na
var int wave3HighBar = na
// === اكتشاف موجة 1 ===
if pl and na(wave1Low)
wave1Low := low
wave1LowBar := bar_index - pivotLen
if ph and not na(wave1Low) and na(wave1High)
wave1High := high
wave1HighBar := bar_index - pivotLen
// === اكتشاف موجة 2 ===
if pl and not na(wave1High) and na(wave2Low)
wave2Low := low
wave2LowBar := bar_index - pivotLen
// === اكتشاف موجة 3 ===
if ph and not na(wave2Low) and na(wave3High)
possibleWave3 = high
if possibleWave3 > wave1High
wave3High := possibleWave3
wave3HighBar := bar_index - pivotLen
// === رسم الموجات ===
if not na(wave1Low) and not na(wave1High)
line.new(wave1LowBar, wave1Low, wave1HighBar, wave1High, color=color.blue, width=2)
label.new(wave1LowBar, wave1Low, text="Wave 1", style=label.style_label_up, color=color.blue, textcolor=color.white)
if not na(wave1High) and not na(wave2Low)
line.new(wave1HighBar, wave1High, wave2LowBar, wave2Low, color=color.orange, width=2)
label.new(wave2LowBar, wave2Low, text="Wave 2", style=label.style_label_down, color=color.orange, textcolor=color.white)
if not na(wave2Low) and not na(wave3High)
line.new(wave2LowBar, wave2Low, wave3HighBar, wave3High, color=color.green, width=2)
label.new(wave3HighBar, wave3High, text="Wave 3", style=label.style_label_up, color=color.green, textcolor=color.white)
