Sunday OpenThis indicator shows the opening price of the daily candle on Sunday .
This price range is a good confirmation for the price reversal. Also, this level is a strong range from which the price gives a good reaction .
This Sunday open line can be used as an additional confirmation to the trading strategy to have a clearer entry point.
Candlestick Analysis

UT Bot + Hull MA Confirmed Signal DelayThis strategy identifies key momentum shifts by combining the UT Bot’s ATR-based trailing stop signals with confirmation from a Hull Moving Average (HMA) or its variants. It’s designed to filter signals and reduce false entries by requiring price action to cross the Hull MA in the direction of the UT Bot signal.
The indicator works especially well when used on Heikin Ashi charts and in alignment with the MACD trend, helping traders capture more reliable entry and exit points. By blending momentum detection with trend confirmation, this strategy aims to provide clearer buy and sell signals in trending markets.
Its not recommended to always buy or sell the signal it should be used in conjunction with technical analysis and price action.

Candlestick IdentifierThis indicator is useful for identifying 11 common candlestick patterns. Candlestick patterns shouldn't be used for entries on their own, but they are a great confluence to validate other trade ideas. Some values can be adjusted to change the indicator's sensitivity depending on how stringent you want the defining candlestick parameters to be.

Reversal Knockout v1.1\ Reversal Knockout v1.1 — User Manual \
Reversal Knockout is a technical indicator designed to detect potential price turning points using a dual approach: a reversal logic with bar coloring and a combined sequence of setups, countdowns, and exhaustion patterns.
\ What does this indicator do?\
\ Colors candles\ based on the relationship between two smoothed moving averages (T3).
\ Identifies overextension conditions\ based on a sequence of 9 consecutive closes aligned with price direction.
\ Confirms exhaustion\ if, after that setup, 13 follow-through conditions (countdown) are met.
\ Highlights special signals called “Knockouts”\ , which represent strong potential reversal scenarios.
\ Candle Coloring\
Candles are automatically colored to make trend and potential reversal points visually easier to interpret:
🔵 Bull Trend: User-defined color (default light blue)
🔴 Bear Trend: User-defined color (default light red)
🟡 Bullish Reversal: When price crosses below the slower average (default yellow)
🟡 Bearish Reversal: When price crosses above the slower average (default yellow)
This logic is based on the relationship between two T3 moving averages (one fast, one slow), calculated with a customizable smoothing factor.
\ Setup and Countdown Logic\
Setups (9):
A bullish setup forms if the price closes below the close from 4 bars earlier for 9 consecutive candles.
A bearish setup forms if the price closes above the close from 4 bars earlier for 9 consecutive candles.
When the ninth close is completed, a green “9” (buy) or purple “9” (sell) is displayed.
Countdowns (13):
After a setup, a follow-through phase begins.
If 13 additional conditions are met (price < low\ for buys or > high\ for sells), a purple “13” is shown, signaling potential exhaustion.
\ Knockout: Explosive Reversal Potential\
The indicator also identifies special reversal patterns called \ Knockout\ .
These signals appear when, in addition to a “9”, the price shows technical excess behavior near key support or resistance zones:
Knockout ▲ (buy): Appears below the candle when a buy signal is detected with specific downside pressure conditions.
Knockout ▼ (sell): Appears above the candle when a sell signal is detected with upside pressure conditions.
These signals stand out as high-probability reversal opportunities.
\ Usage Recommendations\
The indicator is designed to work on any timeframe, but it is recommended to use it alongside market structure and volume analysis.
“Knockout” signals may be used as high-probability trend change alerts, especially after a “13”.
Can be combined with momentum indicators and moving averages for greater effectiveness.

Candlestick Patterns Zh# CandlePatternsZh
**CandlePatternsZh** aims to translate All Patterns indicators in TradingView into Chinese, combining educational content with TradingView's PineScript code tool to help traders better understand and apply technical analysis.
## 專案介紹 (Project Overview)
**CandlePatternsZh** 旨在將TradingView裡的All Patterns指標翻譯成中文,結合教育內容和TradingView的PineScript程式碼工具,幫助交易者更好地理解和應用技術分析。
- **中文化**:提供K線形態的中文名稱、解釋和交易策略。
- **PineScript工具**:自動檢測並視覺化K線形態,支援TradingView平台。
- **教育資源**:詳細的形態說明、圖表範例和中英對照表。
## 功能 (Features)
- Localized candlestick patterns with Chinese translations.
- PineScript scripts for detecting and visualizing patterns on TradingView.
- Educational guides with examples and trading strategies.
## 目前支援的K線形態 (Supported Patterns)
| 英文名稱 (English) | 中文名稱 (Chinese) | 說明 (Description) |
|--------------------------|--------------------|---------------------------------------------|
| Doji | 十字星 | 開盤價與收盤價接近,反映市場猶豫。 |
| Hammer | 錘形線 | 長下影線,短實體,可能預示底部反轉。 |
| Bullish Engulfing | 看漲吞沒 | 大陽線吞沒前一根陰線,表明買方力量增強。 |
| Bearish Engulfing | 看跌吞沒 | 大陰線吞沒前一根陽線,表明賣方力量增強。 |
更多形態請參閱 (docs/)。
## 快速開始 (Getting Started)
1. 複製專案:
```bash
git clone github.com
```
2. 瀏覽 `docs/` 資料夾,查看K線形態的教育內容。
3. 將 `scripts/` 資料夾中的PineScript程式碼複製到TradingView的Pine Editor以應用。
## 專案結構 (Project Structure)
```
CandlePatternsZh/
├── docs/ # 教育內容 (Educational content)
├── scripts/ # PineScript程式碼 (PineScript scripts)
├── examples/ # 圖表範例 (Chart examples)
├── translations/ # 中英對照翻譯 (Translations)
├── README.md # 專案介紹 (Project overview)
├── CONTRIBUTING.md # 貢獻指南 (Contribution guidelines)
├── LICENSE # MPL 2.0許可證 (MPL 2.0 License)
└── .gitignore # Git忽略檔案 (Git ignore file)
```
## 貢獻 (Contributing)
歡迎參與貢獻!請閱讀 (CONTRIBUTING.md) 了解如何提交翻譯、程式碼或範例。
## 許可證 (License)
This project is licensed under the Mozilla Public License 2.0 - see the (LICENSE) file for details.
## 聯繫 (Contact)
有任何問題或建議?請在GitHub上開啟 (github.com) 或聯繫我們!

Consecutive CandlesSummary
This indicator helps visualize short-term momentum by automatically drawing boxes around sequences of consecutive same-colored candles (bullish or bearish). It's designed to quickly highlight periods of sustained buying or selling pressure directly on your chart.
How it Works
Consecutive Candle Detection: The script monitors the chart bar by bar, tracking consecutive candles where close > open (bullish) or close < open (bearish).
Box Drawing: When a sequence of same-colored candles reaches a user-defined minimum length (default is 3) and this sequence is then broken by an opposite-colored candle or a doji, a box is drawn.
Box Boundaries:
The top of the box is set to the highest high price reached during the sequence.
The bottom of the box is set to the lowest low price reached during the sequence.
The left edge of the box aligns with the start time of the first candle in the sequence.
The right edge of the box aligns with the end time of the last candle in the sequence.
Stability: Uses xloc = xloc.bar_time to ensure boxes remain accurately anchored to the price bars when zooming or panning the chart.
Real-time Extension: For active sequences meeting the minimum length on the latest developing bar, the box is optionally extended to the right.
Features
Automatically identifies and boxes sequences of 3 or more (customizable) consecutive bullish candles.
Automatically identifies and boxes sequences of 3 or more (customizable) consecutive bearish candles.
Extends box in real-time for active qualifying sequences.
Customizable minimum candle count (>= 2).
Customizable colors for bullish/bearish boxes and borders.
Settings
You can customize the indicator via the Settings menu (gear icon):
Minimum Consecutive Candles: Define how many candles in a row are needed to draw a box (Default: 3).
Bullish Box Color: Set the fill color for boxes around bullish sequences.
Bearish Box Color: Set the fill color for boxes around bearish sequences.
Box Border Color: Set the color for the border of all boxes.
Potential Use Cases
Momentum Identification: Quickly spot periods of strong, uninterrupted buying or selling.
Exhaustion/Reversal Signals: Very long sequences might indicate potential exhaustion, setting up reversal opportunities.
Consolidation Breakouts: A box forming after a period of tight consolidation can highlight the range just before a potential breakout.
Confirmation: Use the boxes as confirmation for entries or exits based on momentum shifts.
Disclaimer: This indicator provides visual aids based on price action. It should not be used as a standalone trading system. Always use indicators in conjunction with your own analysis and risk management rules.

Al Brooks Second Entry**\ Al Brooks Second Entry Indicator\ **
This custom indicator helps identify second-entry setups based on Al Brooks' price action principles. The script marks key levels in trending markets, indicating potential long and short entries. It displays the first and second entry signals (H1, H2, L1, L2) as well as relevant pullback zones for added clarity.
\ Features:\
\
\ \ First Entry Signals\ : H1 (Long) and L1 (Short) are marked when a trend begins to form.
\ \ Second Entry Signals\ : H2 (Long) and L2 (Short) are plotted once the market pulls back and continues in the direction of the trend.
\ \ EMA Filter\ : An Exponential Moving Average (EMA) is included to filter trades in the direction of the trend (longs above EMA, shorts below EMA).
\ \ Pullback Zones\ : Highlighted areas to assist in identifying optimal zones for entry.
\ \ Adjustable Label Sizes\ : Customize the appearance of the entry labels (tiny or small).
\
\ Inputs:\
\
\ \ Show First/Second Entry\ : Control whether the first (H1, L1) and second (H2, L2) entry signals are displayed.
\ \ EMA Length\ : Set the length of the EMA to use for trend direction.
\ \ Label Size\ : Choose between tiny and small label sizes for clear chart visibility.
\ \ Pullback Zones\ : Toggle the highlighting of pullback zones.
\
\ How it Works:\
\
\ The indicator detects a trend direction using price action (new highs/lows, inside/outside bars).
\ Once a trend is identified, it waits for a pullback and marks the first and second entry points (H1, H2, L1, L2).
\ The indicator also plots the EMA to help confirm the overall market bias.
\ Pullback zones are drawn to help spot potential areas of support or resistance.
\
This script is ideal for traders looking to trade retracements in trending markets, providing clear entry signals and a visual representation of market structure.

RSI Candle Trend🎯 Purpose:
This TradingView script is designed to visualize trend strength using RSI values as candle data, instead of traditional price candles. It transforms RSI data into custom candles using various smoothing and filtering methods (like Heikin-Ashi, Linear Regression, Rational Quadratic Filter, or McGinley Dynamic). It allows traders to:
📌Track RSI-based momentum using visual candle representation
📌Apply advanced smoothing/filters to the RSI to reduce noise
📌Highlight candle trend strength using dynamic coloring
📌Identify overbought/oversold zones using reference lines (RSI 80 and 20)
🧩 How It Works:
It calculates RSI values for open, high, low, close prices.
These RSI values are then optionally smoothed with user-selected moving averages (EMA, SMA, etc.).
Depending on the selected mode (Normal, Heikin-Ashi, Linear, Rational Quadratic), the RSI values are transformed into synthetic candles.
Candles are colored cyan (uptrend) or red (downtrend) based on RSI movement.
⚙️ Key Inputs:
Method: Type of moving average to smooth the RSI (e.g. EMA, SMA, VWMA, etc.)
Length: Length for RSI and smoothing filters
Candle: Type of candle transformation (Normal, Heikin-Ashi, Linear, Rational Quadratic)
Rational Quadratic: Parameter for the Rational Quadratic smoothing method
📊 Outputs:
Custom candles plotted using RSI-transformed values
Candle colors based on RSI strength:
Cyan for strong bullish RSI movement
Red for strong bearish RSI movement
Horizontal lines at RSI levels 80 and 20 (overbought/oversold)
🧠 Why Use This Indicator?
Unlike traditional RSI indicators that show a line, this tool:
Converts RSI into candle-style visualization
Helps traders visually interpret trend strength, reversals, or continuation patterns
Offers more refined control over RSI behavior and filtering
Provides a unique blend of momentum and candle analysis
❗Important Note:
This script is provided for educational purposes and does not constitute financial advice. Traders and investors should conduct their research and analysis before making any trading decisions.
ICT iFVG Detector and Alert [by ote618]Description
This script detects ICT - fair value gaps (FVG) formed by price gaps between Candle 1 and Candle 3, then monitors the next 5 candles for an inverse fair value gap (iFVG).
What It Detects
Bullish FVG: When Candle 1 high is below Candle 3 low (BISI)
Bearish FVG: When Candle 1 low is above Candle 3 high (SIBI)
Once an FVG is detected, the script checks the next 5 candles:
A Bullish FVG becomes a Bearish IFVG if price closes below Candle 1 high
A Bearish FVG becomes a Bullish IFVG if price closes above Candle 1 low
Only the first bar that validates the FVG triggers the transition to an IFVG.
Visual Output
A shaded rectangle is plotted to mark the original FVG zone (from Candle 1 to Candle 3)
Color-coded:
Red for Bearish IFVG (validated Bullish IG)
Green for Bullish IFVG (validated Bearish IG)
The rectangle extends from Candle 1 to the validating bar
Alerts
You can receive alerts when an FVG becomes an IFVG:
Configurable to fire only on selected timeframes (1m, 5m, 15m, 60m)
Alerts include the direction and the chart timeframe
Settings
Enable Alerts For Timeframe: Choose which timeframe(s) trigger alerts
This tool helps traders identify inverse FVGs (iFVG), a useful ICT concept.

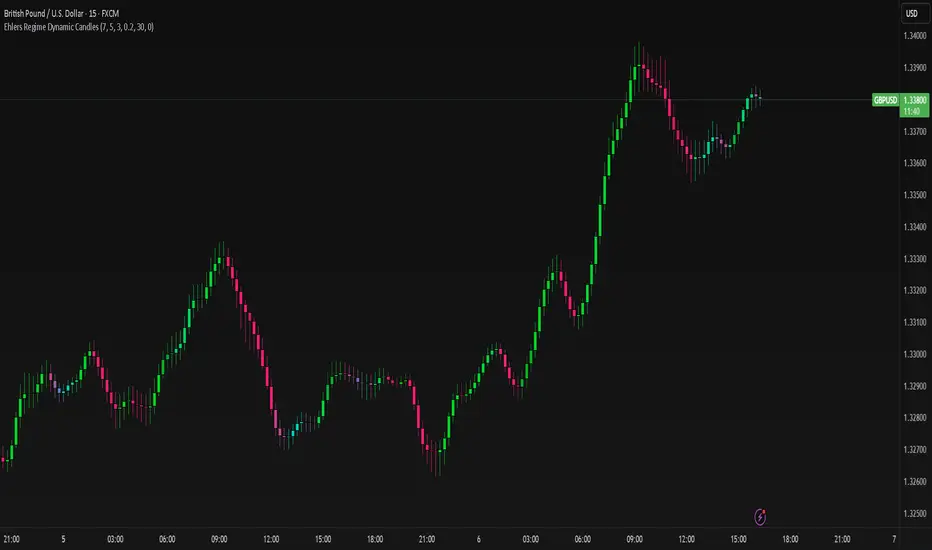
Ehlers Regime Dynamic CandlesCore Calculation Mechanism
The indicator uses advanced Ehlers signal processing techniques to identify market regimes and create dynamically colored candles that reflect market conditions.
Super Smoother Filter: Price data (open, high, low, close) is processed through an Ehlers Super Smoother Filter to reduce market noise while preserving important price movements. This creates a clearer signal for regime detection.
Autocorrelation Analysis: The core of regime detection uses autocorrelation functions at different lag periods:
Primary autocorrelation measures correlation between the current price and its previous value
Trending autocorrelation measures longer-term persistence in the data series
These values combined determine if the market is in a trending or choppy regime
(Image showing Ehlers custom candles vs default candlesticks)
Regime Strength Calculation:
-Raw signal from autocorrelation with user-defined threshold adjustment
-Adaptive scaling based on sensitivity parameter
-Optional volume validation that confirms signal strength using volume data
-Normalization to 0-1 range and smoothing for visual consistency
-Percentile ranking to provide contextually meaningful strength values
Fisher Transform: Applied to the smoothed price to identify statistical extremes, which helps adjust transparency levels during significant price movements.
Key Features & Components
Regime Detection: Identifies trending vs. choppy market conditions using Ehlers' autocorrelation techniques.
Dynamic Candle Coloring: Candles transition smoothly between three color states:
Bullish trending (typically green/teal)
Bearish trending (typically red/purple)
Choppy/neutral (typically blue/silver)
Volume Validation: Optional incorporation of volume data to confirm trend strength (stronger volume during trending periods increases confidence).
Adaptive Transparency: Candles become more opaque during statistically significant price movements based on Fisher Transform values.
Gradient Smoothing: Controls the visual transition between regime states for a more aesthetically pleasing appearance.
Customizable Colors and Style: Full control over all visual aspects including candle body/wick colors and transparency.
Configuration Options
Users can adjust the following parameters in the indicator settings:
Main Settings:
Cycle Length: Controls the lookback period for cycle detection. Lower values increase responsiveness but may introduce noise.
Gradient Smoothness: Determines how quickly colors transition when regime changes.
Trend Detection Threshold: Sets the autocorrelation strength required to classify a trend.
Trend Sensitivity: Scales regime strength calculation to produce a better distribution of values.
Use Volume: Toggles whether volume data is used to validate trend strength.
Color Settings:
Trending Regime Colors: Separate color options for bullish and bearish candle bodies and wicks.
Choppy Regime Colors: Color options for candle bodies and wicks during sideways/neutral markets.
Style Settings:
Candle Border Options: Toggle borders and adjust their color and transparency.
Adaptive Transparency: Enable/disable dynamic transparency based on statistical significance.
Base Transparency: Set the baseline transparency level for all candles.
Interpretation Notes
Color Transitions: As the market shifts between regimes, candle colors gradually transition, providing visual cues about market structure changes.
Regime Strength: The intensity of colors indicates the strength of the detected regime:
Strong trending regimes show vibrant trending colors
Weak or mixed regimes display colors closer to the choppy/neutral color
Transitions between regimes show gradient colors
Transparency Changes: More opaque candles indicate statistically significant price movements, while more transparent candles suggest routine or less significant price action.
Volume Interaction: When volume validation is enabled, trending colors become more pronounced during high volume trends and subdued during low volume periods.
Disclaimer: These are custom candles that are significantly different from normal candlesticks.
Unlike traditional candlesticks that display raw price data, these candles:
• Use Ehlers signal processing to filter and smooth price data
• Dynamically change color based on detected market regimes
• Show statistical significance through transparency
• May appear delayed compared to standard candles due to the filtering process
Traditional trading strategies dependent on candlestick patterns will not work with these.
Risk Disclaimer
Trading involves significant risk. This indicator is provided for analytical purposes only and does not constitute financial advice. Past performance is not indicative of future results. Use sound risk management practices and never trade with capital you cannot afford to lose. The Ehlers Regime Dynamic Candles indicator should be used as part of a comprehensive trading approach, not as a standalone trading system.
[T] FVG Size MarkerThis scripts marks the size of the FVG on the chart. As well as lets you place custom text based on gap size. Custom text lets you overlay contract size risk based on the gap size.

Time-Based Fair Value Gaps (FVG) with Inversions (iFVG)Overview
The Time-Based Fair Value Gaps (FVG) with Inversions (iFVG) (ICT/SMT) indicator is a specialized tool designed for traders using Inner Circle Trader (ICT) methodologies. Inspired by LuxAlgo's Fair Value Gap indicator, this script introduces significant enhancements by integrating ICT principles, focusing on precise time-based FVG detection, inversion tracking, and retest signals tailored for institutional trading strategies. Unlike LuxAlgo’s general FVG approach, this indicator filters FVGs within customizable 10-minute windows aligned with ICT’s macro timeframes and incorporates ICT-specific concepts like mitigation, liquidity grabs, and session-based gap prioritization.
This tool is optimized for 1–5 minute charts, though probably best for 1 minute charts, identifying bullish and bearish FVGs, tracking their mitigation into inverted FVGs (iFVGs) as key support/resistance zones, and generating retest signals with customizable “Close” or “Wick” confirmation. Features like ATR-based filtering, optional FVG labels, mitigation removal, and session-specific FVG detection (e.g., first FVG in AM/PM sessions) make it a powerful tool for ICT traders.
Originality and Improvements
While inspired by LuxAlgo’s FVG indicator (credit to LuxAlgo for their foundational work), this script significantly extends the original concept by:
1. Time-Based FVG Detection: Unlike LuxAlgo’s continuous FVG identification, this script filters FVGs within user-defined 10-minute windows each hour (:00–:10, :10–:20, etc.), aligning with ICT’s emphasis on specific periods of institutional activity, such as hourly opens/closes or kill zones (e.g., New York 7:00–11:00 AM EST). This ensures FVGs are relevant to high-probability ICT setups.
2. Session-Specific First FVG Option: A unique feature allows traders to display only the first FVG in ICT-defined AM (9:30–10:00 AM EST) or PM (1:30–2:00 PM EST) sessions, reflecting ICT’s focus on initial market imbalances during key liquidity events.
3. ICT-Driven Mitigation and Inversion Logic: The script tracks FVG mitigation (when price closes through a gap) and converts mitigated FVGs into iFVGs, which serve as ICT-style support/resistance zones. This aligns with ICT’s view that mitigated gaps become critical reversal points, unlike LuxAlgo’s simpler gap display.
4. Customizable Retest Signals: Retest signals for iFVGs are configurable for “Close” (conservative, requiring candle body confirmation) or “Wick” (faster, using highs/lows), catering to ICT traders’ need for precise entry timing during liquidity grabs or Judas swings.
5. ATR Filtering and Mitigation Removal: An optional ATR filter ensures only significant FVGs are displayed, reducing noise, while mitigation removal declutters the chart by removing filled gaps, aligning with ICT’s principle that mitigated gaps lose relevance unless inverted.
6. Timezone and Timeframe Safeguards: A timezone offset setting aligns FVG detection with EST for ICT’s New York-centric strategies, and a timeframe warning alerts users to avoid ≥1-hour charts, ensuring accuracy in time-based filtering.
These enhancements make the script a distinct tool that builds on LuxAlgo’s foundation while offering ICT traders a tailored, high-precision solution.
How It Works
FVG Detection
FVGs are identified when a candle’s low is higher than the high of two candles prior (bullish FVG) or a candle’s high is lower than the low of two candles prior (bearish FVG). Detection is restricted to:
• User-selected 10-minute windows (e.g., :00–:10, :50–:60) to capture ICT-relevant periods like hourly transitions.
• AM/PM session first FVGs (if enabled), focusing on 9:30–10:00 AM or 1:30–2:00 PM EST for key market opens.
An optional ATR filter (default: 0.25× ATR) ensures only gaps larger than the threshold are displayed, prioritizing significant imbalances.
Mitigation and Inversion
When price closes through an FVG (e.g., below a bullish FVG’s bottom), the FVG is mitigated and becomes an iFVG, plotted as a support/resistance zone. iFVGs are critical in ICT for identifying reversal points where institutional orders accumulate.
Retest Signals
The script generates signals when price retests an iFVG:
• Close: Triggers when the candle body confirms the retest (conservative, lower noise).
• Wick: Triggers when the candle’s high/low touches the iFVG (faster, higher sensitivity). Signals are visualized with triangular markers (▲ for bullish, ▼ for bearish) and can trigger alerts.
Visualization
• FVGs: Displayed as colored boxes (green for bullish, red for bearish) with optional “Bull FVG”/“Bear FVG” labels.
• iFVGs: Shown as extended boxes with dashed midlines, limited to the user-defined number of recent zones (default: 5).
• Mitigation Removal: Mitigated FVGs/iFVGs are removed (if enabled) to keep the chart clean.
How to Use
Recommended Settings
• Timeframe: Use 1–5 minute charts for precision, avoiding ≥1-hour timeframes (a warning label appears if misconfigured).
• Time Windows: Enable :00–:10 and :50–:60 for hourly open/close FVGs, or use the “Show only 1st presented FVG” option for AM/PM session focus.
• ATR Filter: Keep enabled (multiplier 0.25–0.5) for significant gaps; disable on 1-minute charts for more FVGs during volatility.
• Signal Preference: Use “Close” for conservative entries, “Wick” for aggressive setups.
• Timezone Offset: Set to -5 for EST (or -4 for EDT) to align with ICT’s New York session.
Trading Strategy
1. Macro Timeframes: Focus on New York (7:00–11:00 AM EST) or London (2:00–5:00 AM EST) kill zones for high institutional activity.
2. FVG Entries: Trade bullish FVGs as support in uptrends or bearish FVGs as resistance in downtrends, especially in :00–:10 or :50–:60 windows.
3. iFVG Retests: Enter on retest signals (▲/▼) during liquidity grabs or Judas swings, using “Close” for confirmation or “Wick” for speed.
4. Session FVGs: Use the “Show only 1st presented FVG” option to target the first gap in AM/PM sessions, often tied to ICT’s market maker algorithms.
5. Risk Management: Combine with ICT concepts like order blocks or breaker blocks for confluence, and set stops beyond FVG/iFVG boundaries.
Alerts
Set alerts for:
• “Bullish FVG Detected”/“Bearish FVG Detected”: New FVGs in selected windows.
• “Bullish Signal”/“Bearish Signal”: iFVG retest confirmations.
Settings Description
• Show Last (1–100, default: 5): Number of recent iFVGs to display. Lower values reduce clutter.
• Show only 1st presented FVG : Limits FVGs to the first in 9:30–10:00 AM or 1:30–2:00 PM EST sessions (overrides time window checkboxes).
• Time Window Checkboxes: Enable/disable FVG detection in 10-minute windows (:00–:10, :10–:20, etc.). All enabled by default.
• Signal Preference: “Close” (default) or “Wick” for iFVG retest signals.
• Use ATR Filter: Enables ATR-based size filtering (default: true).
• ATR Multiplier (0–∞, default: 0.25): Sets FVG size threshold (higher values = larger gaps).
• Remove Mitigated FVGs: Removes filled FVGs/iFVGs (default: true).
• Show FVG Labels: Displays “Bull FVG”/“Bear FVG” labels (default: true).
• Timezone Offset (-12 to 12, default: -5): Aligns time windows with EST.
• Colors: Customize bullish (green), bearish (red), and midline (gray) colors.
Why Use This Indicator?
This indicator empowers ICT traders with a tool that goes beyond generic FVG detection, offering precise, time-filtered gaps and inversion tracking aligned with institutional trading principles. By focusing on ICT’s macro timeframes, session-specific imbalances, and customizable signal logic, it provides a clear edge for scalping, swing trading, or reversal setups in high-liquidity markets.

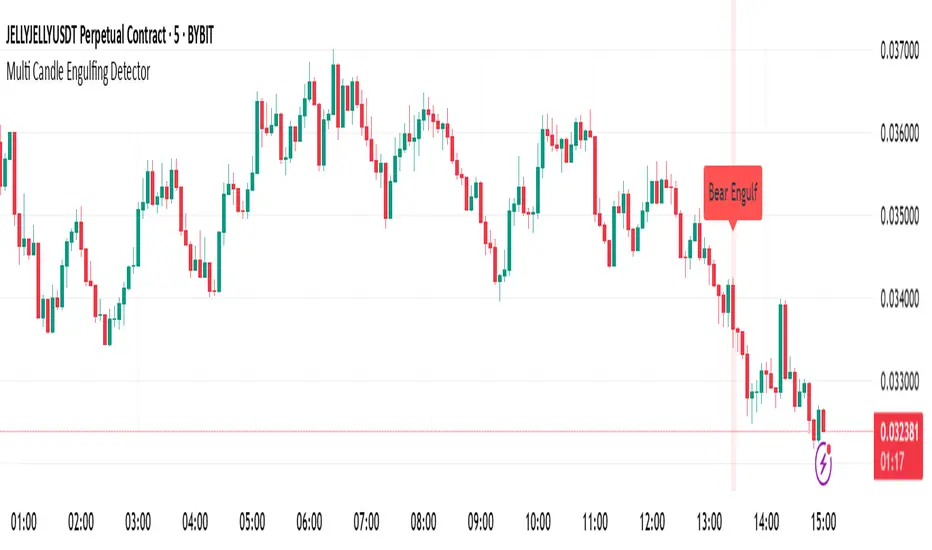
Multi Candle Engulfing Detector🔍 Multi Candle Engulfing Detector
This indicator identifies powerful engulfing candles that consume three or more previous candles — a signal often tied to strong market reversals or continuation moves.
🧠 Features
Detects candles that fully engulf the previous 3 or more candles
Optional filtering: only trigger when the engulfed candles are of the opposite color
Customizable engulf count for greater pattern control
Clear bullish and bearish signal labels on the chart
Alerts integrated: get notified the moment a setup forms
Background highlighting for enhanced visibility
⚙️ Settings
Minimum Number of Candles to Engulf: Default is 3, but can be adjusted
Require Opposite Color: When enabled, the engulfing candle must be opposite in color to the engulfed ones (e.g., green engulfing red)
📈 Use Cases
Spot strong reversal signals at tops and bottoms
Confirm breakout momentum on trend continuation
Use in confluence with other tools like volume or support/resistance
🚨 Alerts
Alerts fire when a bullish or bearish engulfing pattern is detected, allowing for mobile, email, or webhook notifications.
✅ Notes
This script is fully customizable and can be extended into a strategy or scanning tool. Feedback and suggestions are always welcome!
Stormer setupHere's a trading setup with reversal candle coloring and simple market structure analysis:
Based on the experienced trader Stormer (Alexandre Wolwacz), to be used with combined price action.
Key improvements added:
1. **Smart Reversal Candles**:
- Detects hammer/shooting star patterns and engulfing candles
- Colors candles based on confluence with market structure
- Teal for bullish reversals, Maroon for bearish reversals
2. **Dynamic Confluence System**:
- Uses MA trend direction to determine if SR levels should be prioritized
- Adjustable sensitivity threshold for SR proximity
- Combines price action with stochastic position
3. **Enhanced Market Structure**:
- Improved trend detection using ROC instead of slope
- Adaptive logic that uses SR levels when MA is flat
4. **Advanced Visualization**:
- Semi-transparent candle coloring preserves original colors
- Dotted SR lines with automatic cleanup
- Clear triangle markers for entries
5. **Efficiency Improvements**:
- Limited historical SR storage for better performance
- Automatic line management to prevent chart clutter
To use this enhanced version:
1. Bullish reversal candles appear teal when:
- Hammer/engulfing pattern forms
- Near support (if MA flat) or stochastic oversold
- Price above MA
2. Bearish reversal candles appear maroon when:
- Shooting star/engulfing pattern forms
- Near resistance (if MA flat) or stochastic overbought
- Price below MA
3. Signals combine all elements (MA position, stochastic, SR levels, and candle patterns) for higher probability trades

CyberCandle SwiftEdgeCyberCandle SwiftEdge
Overview
CyberCandle SwiftEdge is a cutting-edge, AI-inspired trading indicator designed for traders seeking precision and clarity in trend-following and swing trading. Powered by SwiftEdge, it combines Heikin Ashi candles, a gradient-colored Exponential Moving Average (EMA), and a Relative Strength Index (RSI) to deliver clear buy and sell signals. Featuring glowing visuals, dynamic signal icons, and a customizable RSI dashboard in the top-right corner, this script offers a futuristic interface for identifying high-probability trade setups on various timeframes (e.g., 1H, 4H).
What It Does
CyberCandle SwiftEdge integrates three powerful components to generate actionable trading signals:
Heikin Ashi Candles: Smooths price action to highlight trends, reducing market noise and making reversals easier to spot.
Gradient EMA: A 100-period EMA with dynamic color transitions (blue/cyan for uptrends, red/pink for downtrends) to confirm market direction.
RSI Dashboard: A neon-lit display showing RSI levels, indicating overbought (>70), oversold (<30), or neutral (30-70) conditions.
Buy and sell signals are marked with prominent, glowing icons (triangles and arrows) based on trend direction, momentum, and specific Heikin Ashi patterns. The script’s customizable parameters allow traders to tailor the strategy to their preferences, balancing signal frequency and precision.
How It Works
The strategy leverages the synergy of Heikin Ashi, EMA, and RSI to filter trades and highlight opportunities:
Trend Direction: The price must be above the EMA for buy signals (bullish trend) or below for sell signals (bearish trend). The EMA’s gradient color shifts based on its slope, visually reinforcing trend strength.
Momentum Confirmation: RSI must exceed a user-defined threshold (default: 50) for buy signals or fall below it for sell signals, ensuring momentum supports the trade.
Candle Patterns: Buy signals require a green Heikin Ashi candle (close > open), with the two prior candles having minimal upper wicks (≤5% of candle body) and being red (indicating a retracement). Sell signals require a red candle, minimal lower wicks, and two prior green candles.
RSI Dashboard: Positioned in the top-right corner, it features a glowing circle (red for overbought, green for oversold, blue for neutral), the current RSI value, and a status indicator (triangle for extremes, square for neutral). This provides instant momentum insights without cluttering the chart.
By combining Heikin Ashi’s trend clarity, EMA’s directional filter, and RSI’s momentum validation, CyberCandle SwiftEdge minimizes false signals and highlights trades with strong potential. Its vibrant, AI-like visuals make it easy to interpret at a glance.
How to Use It
Add to Chart: In TradingView, search for "CyberCandle SwiftEdge" and add it to your chart. Set the chart to Heikin Ashi candles for optimal compatibility.
Interpret Signals:
Buy Signal: Large green triangles and arrows appear below candles when the price is above the EMA, RSI is above the buy threshold (default: 50), and conditions for a bullish retracement are met. Consider entering a long position with a 1:2 risk/reward ratio.
Sell Signal: Large red triangles and arrows appear above candles when the price is below the EMA, RSI is below the sell threshold (default: 50), and conditions for a bearish retracement are met. Consider entering a short position.
RSI Dashboard: Monitor the top-right dashboard. A red circle (RSI > 70) suggests caution for buys, a green circle (RSI < 30) indicates potential buying opportunities, and a blue circle (RSI 30-70) signals neutrality.
Customize Parameters: Open the indicator’s settings to adjust:
EMA Length (default: 100): Increase (e.g., 200) for longer-term trends or decrease (e.g., 50) for shorter-term sensitivity.
RSI Length (default: 14): Adjust for more (e.g., 7) or less (e.g., 21) responsive momentum signals.
RSI Buy/Sell Thresholds (default: 50): Set higher (e.g., 55) for buys or lower (e.g., 45) for sells to require stronger momentum.
Wick Tolerance (default: 0.05): Increase (e.g., 0.1) to allow larger wicks, generating more signals, or decrease (e.g., 0.02) for stricter conditions.
Require Retracement (default: true): Disable to remove the two-candle retracement requirement, increasing signal frequency.
Trading: Use signals in conjunction with the RSI dashboard and market context. For example, avoid buy signals if the RSI dashboard is red (overbought). Always apply proper risk management, such as setting stop-losses based on recent lows/highs.
What Makes It Original
CyberCandle SwiftEdge stands out due to its futuristic, AI-inspired visual design and user-friendly customization:
Neon Aesthetics: Glowing Heikin Ashi candles, gradient EMA, and dynamic signal icons (triangles and arrows) with RSI-driven transparency create a high-tech, immersive experience.
RSI Dashboard: A compact, top-right display with a neon circle, RSI value, and adaptive status indicator (triangle/square) provides instant momentum insights without cluttering the chart.
Customizability: Users can fine-tune EMA length, RSI parameters, wick tolerance, and retracement requirements via TradingView’s settings, balancing signal frequency and precision.
Integrated Approach: The synergy of Heikin Ashi’s trend clarity, EMA’s directional strength, and RSI’s momentum validation offers a cohesive strategy that reduces false signals.
Why This Combination?
The script combines Heikin Ashi, EMA, and RSI for a complementary effect:
Heikin Ashi smooths price fluctuations, making it ideal for identifying sustained trends and retracements, which are critical for the strategy’s signal logic.
EMA provides a reliable trend filter, ensuring signals align with the broader market direction. Its gradient color enhances visual trend recognition.
RSI adds momentum context, confirming that signals occur during favorable conditions (e.g., RSI > 50 for buys). The dashboard makes RSI intuitive, even for non-technical users.
Together, these components create a balanced system that captures trend reversals after retracements, validated by momentum, with a visually engaging interface that simplifies decision-making.
Tips
Best used on volatile assets (e.g., BTC/USD, EUR/USD) and higher timeframes (1H, 4H) for clearer trends.
Experiment with parameters in the settings to match your trading style (e.g., increase wick tolerance for more signals).
Combine with other analysis (e.g., support/resistance) for higher-confidence trades.
Note
This indicator is for informational purposes and does not guarantee profits. Always backtest and use proper risk management before trading.

Engulfing Candle with Streaks and CountIdentifies Engulfing Candles + The Number of Consecutive Signals + Identifies 3rd/4th Consecutive Signals + Keeps Count of Most Recent Number of Signals as Decided by User.
- Have coded in the latest version 6
- This script allows the tracking of engulfing candles over a user defined amount of time (candles).
- The script will signal every engulfing candle and its consecutive corresponding number across the entire chart.
- The Engulfing Count box in the bottom right counts how many bullish and bearish engulfing candles have occurred over the number decided by the user.
- The Engulfing Signal that prints is triggered when an opposite next candle prints and the body is over 100% larger than the previous candle. It does not need to "fully engulf" the previous candle, the coding has an allowance for an "equal to and greater/smaller than" the previous close price. This allows for signals were the open of the engulfing candle can be equal to the close of the previous opposite, however the engulfing still must reach an over 100% sizing of the previous to print a signal.
- Where a piercing candle occurs and the open price is within the body of the previous candle, this will void the equation and no matter how big the candle is, it will not trigger an engulfing signal as I was only looking for true engulfing candles.
- The script keeps count of the same consecutive signals no matter the timeframe.
- It will print the consecutive number above or below the signal (depending if bullish or bearish).
- To assist with trend identification the 3rd consecutive signal will print blue, and the 4th consecutive signal will print yellow (or I prefer to use the term "Gold"). This can help filter out the noise on lower timeframes to assist to see where the momentum is going, or if there are signals going against the trend to try trick traders.
- Back testing I found the 3rd and 4th signals are uncommon on higher timeframes and tend to act as fake-outs before the trend reverses.
- Overall a good tool to add to your trend analysis, either for additional confluence or to assist with reversal identification.
- Colors are set as default, but everything can be changed by the user as I didn't want to limit its possibilities.
*** Please note that this script does not take into any consideration candle wicks. Although it can be used with Heikin Ashi it is somewhat unreliable. This indicator is designed to be used with standard candles only ***

LinReg Heikin Ashi CandlesLinear Regression Heikin Ashi Candles will dramatically change how the candlesticks on your chart will appear. This script creates Heikin Ashi candles from the existing candlesticks and then applies wickless Linear Regression candles as an overlay. The result is an ultra smoothed 'Renko-like' chart that remains time-based and responsive.
Key Features:
Heikin Ashi Base: Provides a smoother representation of price trends by filtering out noise.
Linear Regression Candles on Heikin Ashi: Plots Linear Regression lines as candles on the Heikin Ashi chart, potentially highlighting the immediate trend direction and momentum within the smoothed data. Wicks are intentionally removed for a clearer focus on the linear progression.
Tillson T3 Moving Averages: Includes fast and slow T3 Moving Averages with customizable length and alpha. These smoothed moving averages can help identify trend direction and potential crossover signals. Users can toggle their visibility.
Volatility Bands: Integrates Volatility Bands based on Average True Range (ATR) with customizable length, ATR type (RMA, SMA, EMA, WMA), and inner/outer multipliers. These bands help gauge price volatility and potential reversal zones. Users can toggle the visibility of the basis line.
Customizable Colors: Allows users to customize the colors of the Linear Regression Heikin Ashi bullish and bearish candles.
How to Use:
This is an overlay on your chart so you'll need to 'hide' the existing candlesticks on your chart.
This indicator can be used on any timeframe from seconds to days to quickly identify market trend, gauge volatility, and potentially find entry/exit points. Consider looking for confluence between the candle color/direction, T3 MA crossovers, and price interaction with the Volatility Bands.
Note: This indicator plots Linear Regression directly on Heikin Ashi candles, removing wicks for a focus on the linear trend within the smoothed data. Adjust the input parameters to suit your trading style and the specific market conditions.
HUGE CREDIT to ugurvu who originally created the Linear Regression Candles indicator that my indicator pulls code from.

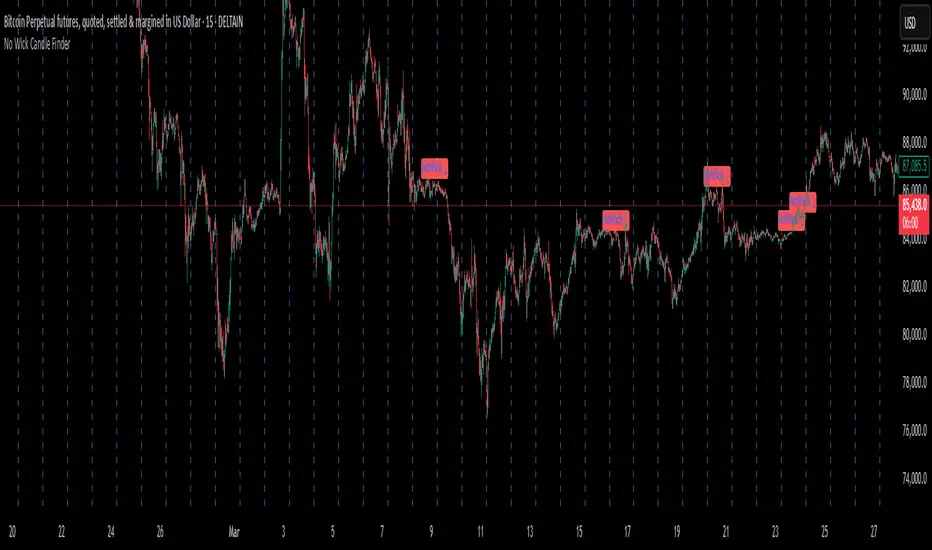
No Wick Candle Finder"No Wick Candle Finder", is a visual that identifies and confirms candlestick patterns with no wicks—a rare but significant type of price action. Here's a breakdown of what it does, how it works, and why traders might find it useful:
This script highlights candles with no wicks and adds an extra layer of confirmation before plotting a signal.
📌 What is a No-Wick Candle?
A "no-wick" candle means:
Bullish (green) no-wick candle:
Open = Low
Close = High
Strong buying pressure from start to end of the candle.
Bearish (red) no-wick candle:
Open = High
Close = Low
Strong selling pressure throughout the candle.
These candles indicate a clear directional move with no retracement during the timeframe.
🧠 Trading Use Cases
Trend Continuation Entry: These candles can signal strong momentum continuation.
Breakout Confirmation: Often appear on breakouts—confirming strength.
Scalping or Intraday: Great for short timeframes where clean moves matter most.
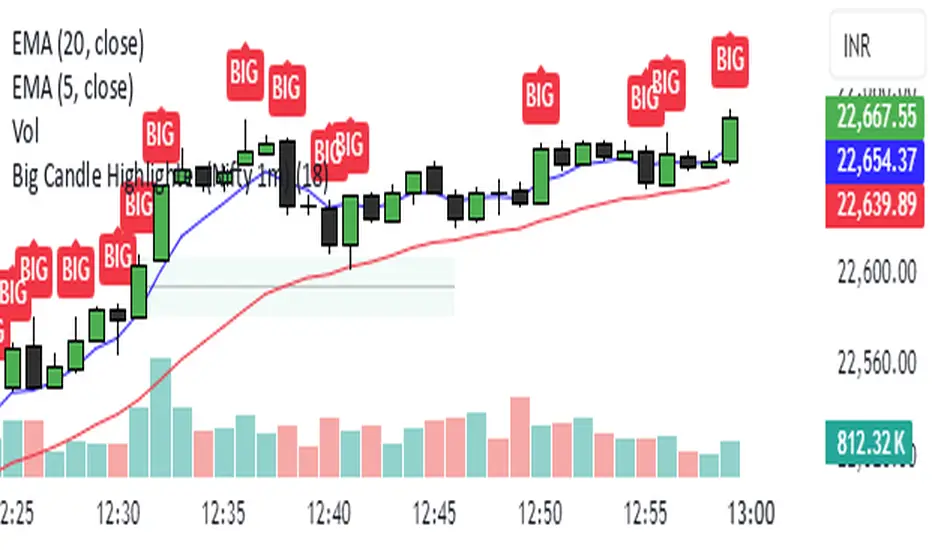
Big Candle Highlighter (Nifty 1m)This indicator will help option buyers to avoid taking trade in impulsive candles.
For Example :
Normal 1m candle: ~10–15 pts
Big candle (possible liquidity/impulse): >18 pts
Very large / avoid chasing: >25 pts
If you see a candle that breaks structure with a 25-30 point range and closes strong, it’s often:
A liquidity sweep
A news spike
Or the start of an impulsive leg — in which case entering at close can be risky without a retest
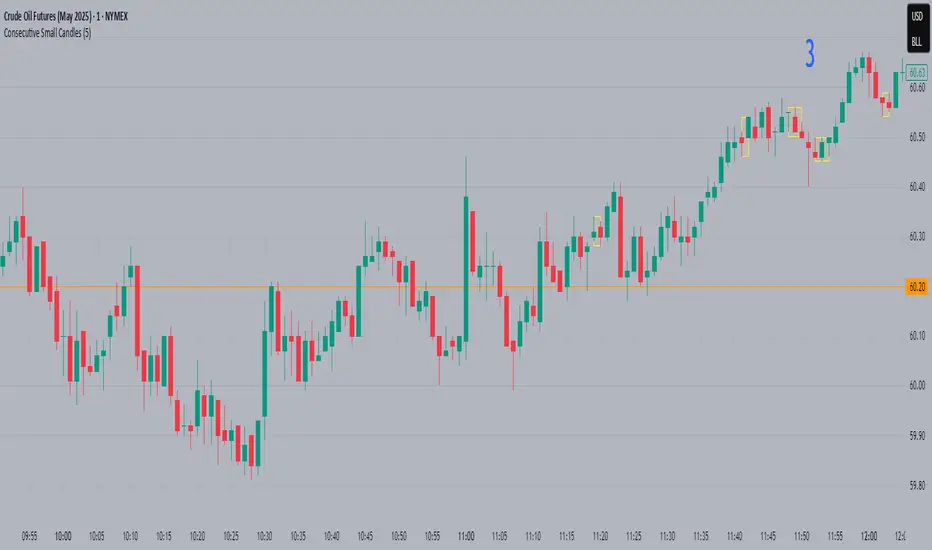
Consecutive Small CandlesThis script identifies relatively "small" candles based on their being smaller than a maximum size you set based on the instrument and your own criteria. Default is 5, as I use this indicator largely on CL which rarely has candles smaller than 3 ticks but frequently greater than 5.
It identifies 2 or more consecutive candles to help identify patterns similar to Bob Volman's Double Doji Break methodolgy. Written by Grok 3.
Candlestick Pattern Indicator – Doji, Harami, More [algo_aakash]This Candlestick Pattern Indicator is designed to help traders identify key price action patterns like Bullish Engulfing, Bearish Engulfing, Doji, Hammer, Morning Star, Evening Star, and many more directly on your TradingView chart. With customizable options to display both bullish and bearish patterns , this indicator provides real-time visual markers and labels, helping you make informed trading decisions.
Key features of the indicator include:
Detects popular candlestick patterns such as Bullish Engulfing, Bearish Engulfing, Hammer, Morning Star, Tweezer Tops, and more.
Customizable settings for displaying pattern shapes, labels, and opacity, tailored to your trading preferences.
Option to plot signals only after a candle closes, ensuring accuracy.
Alerts for immediate notification of detected patterns.
Visual markers on the chart, including arrows and labels, for quick recognition of potential trade setups.
This indicator is ideal for traders who rely on candlestick patterns for technical analysis and want an automated tool to highlight these setups for easier decision-making.
Whether you're a beginner or an experienced trader, this tool will help you spot important patterns in real-time without cluttering your chart.

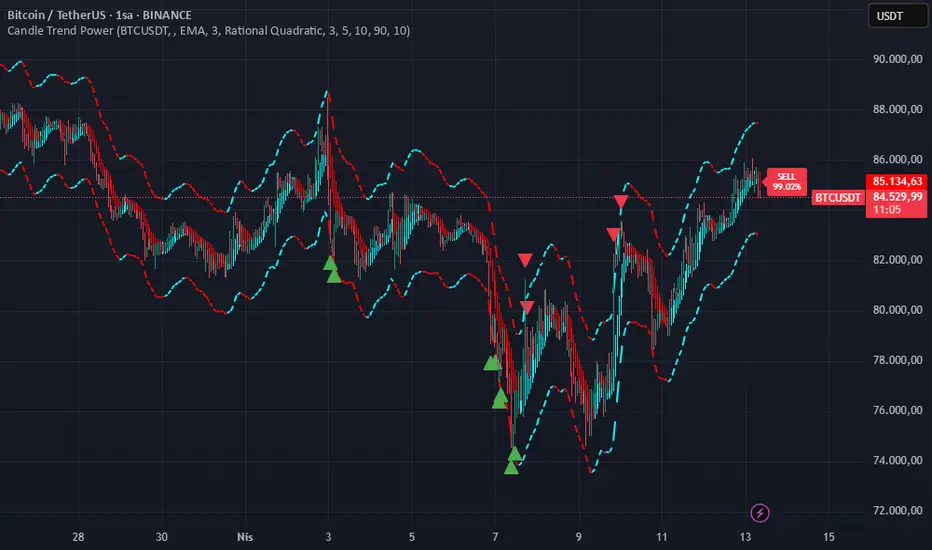
Candle Trend PowerThe Candle Trend Power is a custom technical indicator designed for advanced trend analysis and entry signal generation. It combines multiple smoothing methods, candle transformations, and volatility bands to visually and analytically enhance your trading decisions.
🔧 Main Features:
📉 Custom Candle Types
It transforms standard OHLC candles into one of several advanced types:
Normal Candles, Heikin-Ashi, Linear Regression, Rational Quadratic (via kernel filtering), McGinley Dynamic Candles
These transformations help traders better see trend continuations and reversals by smoothing out market noise.
🧮 Smoothing Method for Candle Data
Each OHLC value can be optionally smoothed using:
EMA, SMA, SMMA (RMA), WMA, VWMA, HMA, Mode (Statistical mode) Or no smoothing at all.
This flexibility is useful for customizing to different market conditions.
📊 Volatility Bands
Volatility-based upper and lower bands are calculated using:
Band = price ± (price% + ATR * multiplier)
They help identify overbought/oversold zones and potential reversal points.
📍 Candle Color Logic
Each candle is colored:
Cyan (#00ffff) if it's bullish and stronger than the previous candle
Red (#fd0000) if it's bearish and weaker
Alternating bar index coloring improves visual clarity.
📈 Trend Momentum Labels
The script includes a trend strength estimation using a smoothed RSI:
If the candle is bullish, it shows a BUY label with the overbought offset.
If bearish, it shows a SELL label with the oversold offset.
These labels are dynamic and placed next to the bar.
📍 Signal Markers
It also plots triangles when the price crosses the volatility bands:
Triangle up for potential long
Triangle down for potential short
✅ Use Case Summary
This script is mainly used for:
Visual trend confirmation with enhanced candles
Volatility-based entry signals
RSI-based trend momentum suggestions
Integrating different smoothing & transformation methods to fine-tune your strategy
It’s a flexible tool for both manual traders and automated system developers who want clear, adaptive signals across different market conditions.
💡 What's Different
🔄 Candle Type Transformations
⚙️ Custom Candle Smoothing
📉 Candle's Multi-level Volatility Bands
🔺 Dynamic Entry Signals (Buy/Sell Labels)
❗Important Note:
This script is provided for educational purposes and does not constitute financial advice. Traders and investors should conduct their research and analysis before making any trading decisions.
FVG, Swing, Target, D/W/M High Low Detector Basic by Trader Riaz"FVG, Swing, Target, D/W/M High Low Detector Basic by Trader Riaz " is a powerful TradingView indicator designed to enhance your trading strategy by identifying key market structures and levels. This all-in-one tool detects Fair Value Gaps (FVGs), Swing Highs/Lows, and previous Day, Previous Week, and Previous Month Highs/Lows, helping traders make informed decisions with ease.
Key Features:
Bullish & Bearish FVG Detection: Highlights Fair Value Gaps with customizable colors, labels, and extension options.
Swing Highs & Lows: Automatically detects and marks Swing Highs and Lows with adjustable display settings and extensions.
Next Target Levels: Identifies potential price targets based on market direction (rising or falling).
Daily, Weekly, and Monthly High/Low Levels: Displays previous day, week, and month highs/lows with customizable colors.
Customizable Settings: Fully adjustable inputs for colors, number of levels to display, and extension periods.
Clean Visuals: Intuitive and non-intrusive design with dashed lines, labels, and tooltips for better chart readability.
This indicator is ideal for traders looking to identify key price levels, improve market structure analysis, and enhance their trading strategies.
Happy Trading,
Trader Riaz

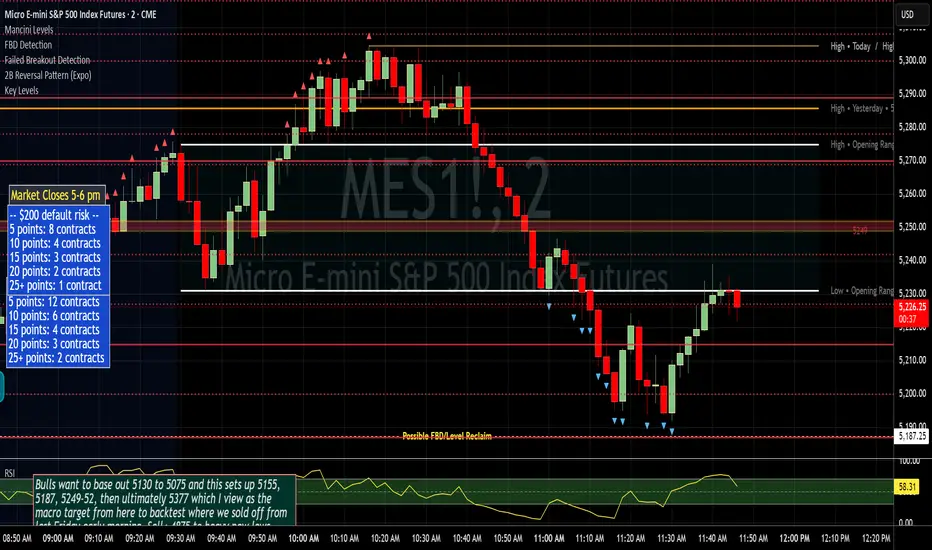
Failed Breakout DetectionThis indicator is a reverse-engineered copy of the FBD Detection indicator published by xfuturesgod. The original indicator aimed at detecting "Failed Breakdowns". This version tracks the opposite signals, "Failed Breakouts". It was coded with the ES Futures 15 minute chart in mind but may be useful on other instruments and time frames.
The original description, with terminology reversed to explain this version:
'Failed Breakouts' are a popular set up for short entries.
In short, the set up requires:
1) A significant high is made ('initial high')
2) Initial high is undercut with a new high
3) Price action then 'reclaims' the initial high by moving +8-10 points from the initial high
This script aims at detecting such set ups. It was coded with the ES Futures 15 minute chart in mind but may be useful on other instruments and time frames.
Business Logic:
1) Uses pivot highs to detect 'significant' initial highs
2) Uses amplitude threshold to detect a new high above the initial high; used /u/ben_zen script for this
3) Looks for a valid reclaim - a red candle that occurs within 10 bars of the new high
4) Price must reclaim at least 8 points for the set up to be valid
5) If a signal is detected, the initial high value (pivot high) is stored in array that prevents duplicate signals from being generated.
6) FBO Signal is plotted on the chart with "X"
7) Pivot high detection is plotted on the chart with "P" and a label
8) New highs are plotted on the chart with a red triangle
Notes:
User input
- My preference is to use the defaults as is, but as always feel free to experiment
- Can modify pivot length but in my experience 10/10 work best for pivot highs
- New high detection - 55 bars and 0.05 amplitude work well based on visual checks of signals
- Can modify the number of points needed to reclaim a high, and the # of bars limit over which this must occur.
Alerts:
- Alerts are available for detection of new highs and detection of failed breakouts
- Alerts are also available for these signals but only during 7:30PM-4PM EST - 'prime time' US trading hours
Limitations:
- Current version of the script only compares new highs to the most recent pivot high, does not look at anything prior to that
- Best used as a discretionary signal