Parameter Free RSI [InvestorUnknown]The Parameter Free RSI (PF-RSI) is an innovative adaptation of the traditional Relative Strength Index (RSI), a widely used momentum oscillator that measures the speed and change of price movements. Unlike the standard RSI, which relies on a fixed lookback period (typically 14), the PF-RSI dynamically adjusts its calculation length based on real-time market conditions. By incorporating volatility and the RSI's deviation from its midpoint (50), this indicator aims to provide a more responsive and adaptable tool for identifying overbought/oversold conditions, trend shifts, and momentum changes. This adaptability makes it particularly valuable for traders navigating diverse market environments, from trending to ranging conditions.
PF-RSI offers a suite of customizable features, including dynamic length variants, smoothing options, visualization tools, and alert conditions.
Key Features
1. Dynamic RSI Length Calculation
The cornerstone of the PF-RSI is its ability to adjust the RSI calculation period dynamically, eliminating the need for a static parameter. The length is computed using two primary factors:
Volatility: Measured via the standard deviation of past RSI values.
Distance from Midpoint: The absolute deviation of the RSI from 50, reflecting the strength of bullish or bearish momentum.
The indicator offers three variants for calculating this dynamic length, allowing users to tailor its responsiveness:
Variant I (Aggressive): Increases the length dramatically based on volatility and a nonlinear scaling of the distance from 50. Ideal for traders seeking highly sensitive signals in fast-moving markets.
Variant II (Moderate): Combines volatility with a scaled distance from 50, using a less aggressive adjustment. Strikes a balance between responsiveness and stability, suitable for most trading scenarios.
Variant III (Conservative): Applies a linear combination of volatility and raw distance from 50. Offers a stable, less reactive length adjustment for traders prioritizing consistency.
// Function that returns a dynamic RSI length based on past RSI values
// The idea is to make the RSI length adaptive using volatility (stdev) and distance from the RSI midpoint (50)
// Different "variant" options control how aggressively the length changes
parameter_free_length(free_rsi, variant) =>
len = switch variant
// Variant I: Most aggressive adaptation
// Uses standard deviation scaled by a nonlinear factor of distance from 50
// Also adds another distance-based term to increase length more dramatically
"I" => math.ceil(
ta.stdev(free_rsi, math.ceil(free_rsi)) *
math.pow(1 + (math.ceil(math.abs(50 - (free_rsi - 50))) / 100), 2)
) +
(
math.ceil(math.abs(free_rsi - 50)) *
(1 + (math.ceil(math.abs(50 - (free_rsi - 50))) / 100))
)
// Variant II: Moderate adaptation
// Adds the standard deviation and a distance-based scaling term (less nonlinear)
"II" => math.ceil(
ta.stdev(free_rsi, math.ceil(free_rsi)) +
(
math.ceil(math.abs(free_rsi - 50)) *
(1 + (math.ceil(math.abs(50 - (free_rsi - 50))) / 100))
)
)
// Variant III: Least aggressive adaptation
// Simply adds standard deviation and raw distance from 50 (linear scaling)
"III" => math.ceil(
ta.stdev(free_rsi, math.ceil(free_rsi)) +
math.ceil(math.abs(free_rsi - 50))
)
2. Smoothing Options
To refine the dynamic RSI and reduce noise, the PF-RSI provides smoothing capabilities:
Smoothing Toggle: Enable or disable smoothing of the dynamic length used for RSI.
Smoothing MA Type for RSI MA: Choose between SMA and EMA
Smoothing Length Options for RSI MA:
Full: Uses the entire calculated dynamic length.
Half: Applies half of the dynamic length for smoother output.
SQRT: Uses the square root of the dynamic length, offering a compromise between responsiveness and smoothness.
The smoothed RSI is complemented by a separate moving average (MA) of the RSI itself, further enhancing signal clarity.
3. Visualization Tools
The PF-RSI includes visualization options to help traders interpret market conditions at a glance.
Plots:
Dynamic RSI: Displayed as a white line, showing the adaptive RSI value.
RSI Moving Average: Plotted in yellow, providing a smoothed reference for trend and momentum analysis.
Dynamic Length: A secondary plot (in faint white) showing how the calculation period evolves over time.
Histogram: Represents the RSI’s position relative to 50, with color gradients.
Fill Area: The space between the RSI and its MA is filled with a gradient (green for RSI > MA, red for RSI < MA), highlighting momentum shifts.
Customizable bar colors on the price chart reflect trend and momentum:
Trend (Raw RSI): Green (RSI > 50), Red (RSI < 50).
Trend (RSI MA): Green (MA > 50), Red (MA < 50).
Trend (Raw RSI) + Momentum: Adds momentum shading (lighter green/red when RSI and MA diverge).
Trend (RSI MA) + Momentum: Similar, but based on the MA’s trend.
Momentum: Green (RSI > MA), Red (RSI < MA).
Off: Disables bar coloring.
Intrabar Updating: Optional real-time updates within each bar for enhanced responsiveness.
4. Alerts
The PF-RSI supports customizable alerts to keep traders informed of key events.
Trend Alerts:
Raw RSI: Triggers when the RSI crosses above (uptrend) or below (downtrend) 50.
RSI MA: Triggers when the moving average crosses 50.
Off: Disables trend alerts.
Momentum Alerts:
Triggers when the RSI crosses its moving average, indicating rising (RSI > MA) or declining (RSI < MA) momentum.
Alerts are fired once per bar close, with descriptive messages including the ticker symbol (e.g., " Uptrend on: AAPL").
How It Works
The PF-RSI operates in a multi-step process:
Initialization
On the first run, it calculates a standard RSI with a 14-period length to seed the dynamic calculation.
Dynamic Length Computation
Once seeded, the indicator switches to a dynamic length based on the selected variant, factoring in volatility and distance from 50.
If smoothing is enabled, the length is further refined using an SMA.
RSI Calculation
The adaptive RSI is computed using the dynamic length, ensuring it reflects current market conditions.
Moving Average
A separate MA (SMA or EMA) is applied to the RSI, with a length derived from the dynamic length (Full, Half, or SQRT).
Visualization and Alerts
The results are plotted, and alerts are triggered based on user settings.
This adaptive approach minimizes lag in fast markets and reduces false signals in choppy conditions, offering a significant edge over fixed-period RSI implementations.
Why Use PF-RSI?
The Parameter Free RSI stands out by eliminating the guesswork of selecting an RSI period. Its dynamic length adjusts to market volatility and momentum, providing timely signals without manual tweaking.
Centered Oscillators

CoffeeShopCrypto Supply Demand PPO AdvancedCoffeeShopCrypto PPO Advanced is a structure-aware momentum oscillator and price-trend overlay designed to help traders interpret momentum strength, exhaustion, and continuation across evolving market conditions. It’s not a “buy/sell” signal tool — it's a momentum context tool that helps confirm trend intent.
Original Code derived from the Price Oscillator Indicators (PPO) found in the TradingView Technical Indicators categories. You can view the info and calculation for the original PPO here
www.tradingview.com
Much like the MACD, the PPO uses a couple lagging indicators to present Momentum as a percentage. But it lacks context to market structure.
What It’s Based On
This tool is based on a dual-moving-average PPO oscillator structure (Percentage Price Oscillator) enhanced by:
Oscillator pivot structure: detection of Lower Highs (LH) and Higher Lows (HL) inside the oscillator.
Detection of Supply and Demand Trends via Market Absorption
Ability to transfer its average plots to price action
Detection of Trend Exhaustion
Real-time price-based exhaustion levels: projecting potential future supply and demand using trendlines from weakening momentum.
Integrated fast and slow Moving Averages on price using the same inputs as the oscillator, to visualize alignment between short- and long-term trends.
These elements combine momentum context with price action in a visual, intuitive system.
How It Works
1. Oscillator Structure
LHs (above zero): momentum weakening in uptrends.
HLs (below zero): momentum strengthening in downtrends.
Only valid pivots are shown (e.g., an LH must be preceded by a valid LL).
2. Exhaustion Levels
Green demand lines: price is making new lows, but oscillator prints HL → potential exhaustion.
Red supply lines: price is making new highs, but oscillator prints LH → potential exhaustion.
These lines are future-facing, projecting likely reaction zones based on momentum weakening.
3. Moving Averages on Price
Two MAs are drawn on the price chart:
Fast MA (same length as PPO short input)
Slow MA (same length as PPO long input)
These are not signal lines — they're visual guides for trend alignment.
MA crossover = PO crosses zero. This indicates short- and long-term momentum are syncing — a powerful signal of trend conviction.
When price is above both MAs, and the PO is rising above zero, bullish momentum is dominant.
When price is below both MAs, and the PO is falling below zero, bearish momentum dominates.
How Traders Can Use It
✅ Spot Trend Initiation
Wait for clear trend confirmation in price.
Use PPO Momentum+ to confirm momentum structure is aligned (e.g., HH/HL in oscillator + price above both MAs).
🔁 Track Continuations
In uptrends, look for oscillator HH and HL sequences with price holding above both MAs.
In downtrends, seek LL and LH sequences with price below both MAs.
⚠️ Watch for Exhaustion
Price breaking below red (supply) lines after oscillator LH = bearish exhaustion signal.
Price breaking above green (demand) lines after oscillator HL = bullish exhaustion signal.
These levels act like pre-mapped S/R zones, showing where momentum previously failed and price may react.
Why This Is Different
Momentum tools often lag or mislead when used blindly. This tool visualizes structural failure in momentum and maps potential outcomes. The integration of oscillator and price-based tools ensures traders are always reading context, not just raw signals.
Demand Trendlines
Demand trendlines show us Wykoff's law of "Absorbed Supply Reversal" In real time.
When aggressive selling pressure is persistently absorbed by passive buying interest without significant downward price continuation, and supply becomes exhausted, the market structure shifts as demand regains control—resulting in a directional reversal to the upside.
This commonly happens in a 3 phase interaction of price.
1. Selling pressure is absorbed quickly by buyers.
This PPO tool will calculate the trend of this absorption process
2. After there is a notable Bearish Exhaustion of price action, the PPO tool will draw a trendline of this absorption showing us the potential future prices where aggressive buyers will want to step in at lower prices.
3. After higher lows are defined in the oscillator, you'll see prices react in a strong bullish pattern at this trendline where aggressive buyers stepped in to reverse price action to the upside.
Supply Trendlines
Supply trendlines show us Wykoff's law of "Absorbed Demand Reversal" In real time.
When aggressive buying pressure is persistently absorbed by passive selling interest without significant downward price continuation, and demand becomes exhausted, the market structure shifts as supply regains control—resulting in a directional reversal to the downside.
This commonly happens in a 3 phase interaction of price.
1. Buying pressure is absorbed quickly by sellers.
This PPO tool will calculate the trend of this absorption process.
2. After there is a notable Bullish Exhaustion of price action, the PPO tool will draw a trendline of this absorption showing us the potential future prices where aggressive sellers will want to step in at higher prices.
3. After lower highs are defined in the oscillator, you'll see prices react in a strong bearish pattern at this trendline where aggressive sellers stepped in to reverse price action to the downside.
Lower High and Higher Low Signals
When the oscillator signals Lower Highs or High Lows its only noting that momentum in that trend direction is slowing. THis indicates a coming pause in the market and the proceeding longs of an uptrend or shorts of a downtrend should be taken with caution.
**These LH and HL markers are not reading as divergences in price vs momentum.**
They are simply registering against the highs and lows of itself..
Moving Averages on Price Action
The Oscillator will cross over its ZERO level the same time your Short and Long MAs cross each other. This will indicate that the short term average trend is moving ahead of the long term.
Crossovers are not an entry signal. It's a method in determining you current timeframe trend strength. Always observe price action as it passes through each of your moving averages and compare it to the positioning and direction of the oscillator.
If price dips in between the moving averages while the oscillator still shows a strong trend strength, you can wait for price to move ahead of your fast moving average.
Bar Colors and Signal Line for Trend Strength
Good Bullish Trend = Oscillator above zero + Signal rising below Oscillator
Weak Bullish Trend = Oscillator above zero + Signal above Oscillator
Good Bearish Trend = Oscillator below zero + Signal falling above Oscillator
Weak Bearish Trend = Oscillator below zero + Signal below Oscillator
Bar Colors
Bars are colored to match Oscillator Momentum Strength. Colors are set by user.
Why alter the known PPO (Percentage Price Oscillator) in this manner?
The PPO tool is great for measuring the strength as percentage of price action over and average amount of candles however, with these changes,
you know have the ability to correlate:
Wycoff theory of supply and demand,
Measure the depth of reversals and pullback by price positioning against moving averages,
Project potential reversal and exhaustion pricing,
Visibly note the structure of momentum much like you would note market structure,
Its not enough to know there is momentum. Its better to know
A) Is it enough
B) Is there something in the way which will cause price to push back
C) Does this momentum correlate to the prevailing trend

Liquid Pulse Liquid Pulse by Dskyz (DAFE) Trading Systems
Liquid Pulse is a trading algo built by Dskyz (DAFE) Trading Systems for futures markets like NQ1!, designed to snag high-probability trades with tight risk control. it fuses a confluence system—VWAP, MACD, ADX, volume, and liquidity sweeps—with a trade scoring setup, daily limits, and VIX pauses to dodge wild volatility. visuals include simple signals, VWAP bands, and a dashboard with stats.
Core Components for Liquid Pulse
Volume Sensitivity (volumeSensitivity) controls how much volume spikes matter for entries. options: 'Low', 'Medium', 'High' default: 'High' (catches small spikes, good for active markets) tweak it: 'Low' for calm markets, 'High' for chaos.
MACD Speed (macdSpeed) sets the MACD’s pace for momentum. options: 'Fast', 'Medium', 'Slow' default: 'Medium' (solid balance) tweak it: 'Fast' for scalping, 'Slow' for swings.
Daily Trade Limit (dailyTradeLimit) caps trades per day to keep risk in check. range: 1 to 30 default: 20 tweak it: 5-10 for safety, 20-30 for action.
Number of Contracts (numContracts) sets position size. range: 1 to 20 default: 4 tweak it: up for big accounts, down for small.
VIX Pause Level (vixPauseLevel) stops trading if VIX gets too hot. range: 10 to 80 default: 39.0 tweak it: 30 to avoid volatility, 50 to ride it.
Min Confluence Conditions (minConditions) sets how many signals must align. range: 1 to 5 default: 2 tweak it: 3-4 for strict, 1-2 for more trades.
Min Trade Score (Longs/Shorts) (minTradeScoreLongs/minTradeScoreShorts) filters trade quality. longs range: 0 to 100 default: 73 shorts range: 0 to 100 default: 75 tweak it: 80-90 for quality, 60-70 for volume.
Liquidity Sweep Strength (sweepStrength) gauges breakouts. range: 0.1 to 1.0 default: 0.5 tweak it: 0.7-1.0 for strong moves, 0.3-0.5 for small.
ADX Trend Threshold (adxTrendThreshold) confirms trends. range: 10 to 100 default: 41 tweak it: 40-50 for trends, 30-35 for weak ones.
ADX Chop Threshold (adxChopThreshold) avoids chop. range: 5 to 50 default: 20 tweak it: 15-20 to dodge chop, 25-30 to loosen.
VWAP Timeframe (vwapTimeframe) sets VWAP period. options: '15', '30', '60', '240', 'D' default: '60' (1-hour) tweak it: 60 for day, 240 for swing, D for long.
Take Profit Ticks (Longs/Shorts) (takeProfitTicksLongs/takeProfitTicksShorts) sets profit targets. longs range: 5 to 100 default: 25.0 shorts range: 5 to 100 default: 20.0 tweak it: 30-50 for trends, 10-20 for chop.
Max Profit Ticks (maxProfitTicks) caps max gain. range: 10 to 200 default: 60.0 tweak it: 80-100 for big moves, 40-60 for tight.
Min Profit Ticks to Trail (minProfitTicksTrail) triggers trailing. range: 1 to 50 default: 7.0 tweak it: 10-15 for big gains, 5-7 for quick locks.
Trailing Stop Ticks (trailTicks) sets trail distance. range: 1 to 50 default: 5.0 tweak it: 8-10 for room, 3-5 for fast locks.
Trailing Offset Ticks (trailOffsetTicks) sets trail offset. range: 1 to 20 default: 2.0 tweak it: 1-2 for tight, 5-10 for loose.
ATR Period (atrPeriod) measures volatility. range: 5 to 50 default: 9 tweak it: 14-20 for smooth, 5-9 for reactive.
Hardcoded Settings volLookback: 30 ('Low'), 20 ('Medium'), 11 ('High') volThreshold: 1.5 ('Low'), 1.8 ('Medium'), 2 ('High') swingLen: 5
Execution Logic Overview trades trigger when confluence conditions align, entering long or short with set position sizes. exits use dynamic take-profits, trailing stops after a profit threshold, hard stops via ATR, and a time stop after 100 bars.
Features Multi-Signal Confluence: needs VWAP, MACD, volume, sweeps, and ADX to line up.
Risk Control: ATR-based stops (capped 15 ticks), take-profits (scaled by volatility), and trails.
Market Filters: VIX pause, ADX trend/chop checks, volatility gates. Dashboard: shows scores, VIX, ADX, P/L, win %, streak.
Visuals Simple signals (green up triangles for longs, red down for shorts) and VWAP bands with glow. info table (bottom right) with MACD momentum. dashboard (top right) with stats.
Chart and Backtest:
NQ1! futures, 5-minute chart. works best in trending, volatile conditions. tweak inputs for other markets—test thoroughly.
Backtesting: NQ1! Frame: Jan 19, 2025, 09:00 — May 02, 2025, 16:00 Slippage: 3 Commission: $4.60
Fee Typical Range (per side, per contract)
CME Exchange $1.14 – $1.20
Clearing $0.10 – $0.30
NFA Regulatory $0.02
Firm/Broker Commis. $0.25 – $0.80 (retail prop)
TOTAL $1.60 – $2.30 per side
Round Turn: (enter+exit) = $3.20 – $4.60 per contract
Disclaimer this is for education only. past results don’t predict future wins. trading’s risky—only use money you can lose. backtest and validate before going live. (expect moderators to nitpick some random chart symbol rule—i’ll fix and repost if they pull it.)
About the Author Dskyz (DAFE) Trading Systems crafts killer trading algos. Liquid Pulse is pure research and grit, built for smart, bold trading. Use it with discipline. Use it with clarity. Trade smarter. I’ll keep dropping badass strategies ‘til i build a brand or someone signs me up.
2025 Created by Dskyz, powered by DAFE Trading Systems. Trade smart, trade bold.

Инвертированный мультиактивный индекс страха и жадностиWhat is the opposite of fear and greed? Correct, love.
The idea of an indicator is that if you take indexes of fear and greed for the top 3 corellated assets with the current one and weight the result by the index of corellations, you can see 2 things.
one is tops and bottoms of an assets movements as measured by the inverted fear and greed index,
and the other is that you can see the cycles of when the asset gets corellated and de-corellated, becoming stronger or weaker then the corellated asset's index.
Turn off the average blue line in settings - it's useless.
Cheers, love
Eugene

Swing Oracle + Cycle M5 // (\_/)
// ( •.•)
// (")_(")
Follow the White Rabbitz
Swing Oracle + Cycle M5 is a custom TradingView indicator combining a normalized oscillator (NDOS) with a 7-day cycle counter, designed for 5-minute charts. It helps traders identify overbought/oversold swing zones while tracking the market’s position within a weekly cycle that resets every Tuesday at midnight.
1. Inputs
Horizontal Levels
High Level (line_up): above this, NDOS signals overbought (“buy zone”)
Low Level (line_dn): below this, NDOS signals oversold (“sell zone”)
Mid-High / Mid-Low (line_mid_high, line_mid_low): for nuanced thresholding
Extra Levels (line_extra1–line_extra4): four additional hidden levels for advanced tuning
Trendline Source
Choose between EMA 8 or SMA 231 via trendline_source
Display Options
Draw Background Color? (button1): toggles colored background based on NDOS zone
Draw Candlesticks? (button2): toggles bar-coloring according to NDOS
2. Trendline & NDOS Calculation
Trendline
If “EMA8” selected: calculates ema(close, 8)
If “SMA231”: calculates sma(close, 231)
NDOS (Normalized Difference Oscillator)
Computes distance of current trendline value from its local high and low over the past Length bars (length)
Rendered on a 0–100 scale with a color gradient between two user-defined colors (gradientbull/gradientbear).
3. Weekly Cycle Counter (M5)
Cycle Start Detection
Marks every Tuesday at 00:00 as cycle zero (isTuesdayZero), storing its timestamp.
Cycle Number
Computes the number of full 7-day intervals since the last stored Tuesday, then plots it as a semi-transparent histogram aligned with the NDOS panel.
4. Visualization & Styles
Oscillator Plot
Thick line for NDOS, colored blue above line_up, red below line_dn, neutral otherwise—overlaid with the same gradient as the histogram.
Horizontal Levels
Distinct plots for each user level (High, Low, Mid-High, Mid-Low).
Filled Zones
Buy Zone: area between NDOS and High Level
No-Trade Zone: between High and Low Levels
Sell Zone: area between NDOS and Low Level
Optional Coloring
Background and candlesticks can be tinted based on whether NDOS is in buy or sell territory.
5. Typical Use Case
*Scalping & Swing: Quickly spot overbought/oversold conditions on 5-minute bars.
*Cycle Awareness: Ensure entries/exits align with your preferred phase of the weekly cycle (e.g., early vs. late in a Tuesday→Tuesday loop).
*Customization: Adjust levels, gradient colors, and trendline source to match your strategy’s sensitivity and preferred look.

MACD+RSI Cross Alert – Clean Signal by TFGMACD + RSI Cross Alert (Lightweight & Clean Visuals)
This script highlights potential momentum shifts using MACD line crossovers with RSI confirmation.
Clean, minimal ▲▼ markers make it suitable for any chart setup.
▲ Upward Marker: When MACD line crosses above signal line and RSI is above 50
▼ Downward Marker: When MACD line crosses below signal line and RSI is below 50
Signals are semi-transparent and offset for visual clarity
Compatible with any timeframe and symbol
🔰 For beginners:
These markers may suggest trend initiation or a momentum shift.
They can serve as timing references when used with support/resistance zones or moving averages.
MACD+RSIクロス マーカー(軽量・視認性重視)
このスクリプトは、MACDのクロスとRSIの方向をもとに、勢いの変化を示すマーカーを表示します。
チャートを邪魔しない小さな▲▼のみ表示され、シンプルで軽量な構成です。
▲ 上向きマーカー:MACDがシグナルを上抜け、かつRSIが50より上の場合
▼ 下向きマーカー:MACDがシグナルを下抜け、かつRSIが50より下の場合
半透明かつオフセット配置で視認性を確保
すべての時間足・銘柄に対応
🔰 初心者向け補足:
このマーカーは、トレンドの始まりや勢いの変化の可能性を示します。
サポートライン・移動平均などと組み合わせて、タイミングの参考として活用できます。


MomentumBreak AI SwiftEdgeMomentumbreak AI SwiftEdge
Overview
This indicator combines two powerful concepts: Pivot Trendlines by HoanGhetti and the Squeeze Momentum Oscillator by AlgoAlpha. The goal of this mashup is to provide traders with a tool that identifies key trendline breakouts while simultaneously gauging market momentum through a dynamic gradient overlay. By integrating these two elements, the indicator offers a unique perspective on price action, helping traders spot high-probability breakout opportunities that align with momentum shifts.
How It Works
Pivot Trendlines:
The indicator uses HoanGhetti's Pivot Trendlines to identify pivot highs and lows based on user-defined settings (Pivot Length and Pivot Type).
Trendlines are drawn between these pivots, and breakouts are detected when the price crosses above (bullish) or below (bearish) the trendline.
Breakouts are visually highlighted with gradient boxes and an "AI: BREAK ⚡" label for clarity.
Squeeze Momentum Oscillator:
The Squeeze Momentum Oscillator calculates market momentum using a combination of volatility and price movement.
A dynamic midline (price_mid) is plotted, with its color indicating squeeze conditions (yellow for hypersqueeze, orange for normal squeeze, gray otherwise).
A gradient overlay is added above or below the midline to reflect momentum:
Green gradient for bullish momentum (vf > 0), placed below candles in an uptrend (close > price_mid) or above in a downtrend (close < price_mid).
Red gradient for bearish momentum (vf < 0), placed above candles in an uptrend or below in a downtrend.
The gradient's intensity increases as the price moves further from the midline, visually emphasizing momentum strength.
Breakout Confirmation:
Breakout signals are only generated when the momentum aligns with the breakout direction:
Bullish breakouts require bullish momentum (vf > 0).
Bearish breakouts require bearish momentum (vf < 0).
This alignment ensures that breakouts are more reliable and reduces false signals.
Default Settings
Pivot Length: 20 (determines the lookback period for identifying pivot points)
Pivot Type: Normal (can be set to "Fast" for more frequent pivots)
Repainting: True (trendlines may repaint as new pivots form; can be disabled)
Target Levels: False (optional horizontal levels at pivot points; can be enabled)
Extend: None (trendline extension; options: none, right, left, both)
Trendline Style: Dotted (options: dotted, dashed, solid)
Underlying Momentum Oscillator Length: 10
Swing Momentum Oscillator Length: 20
Squeeze Calculation Period: 14
Squeeze Smoothing Length: 7
Squeeze Detection Length: 14
Hyper Squeeze Detection Length: 5
Usage
This indicator is ideal for traders who want to combine trendline breakouts with momentum analysis:
Trendline Breakouts: Look for gradient boxes and "AI: BREAK ⚡" labels to identify confirmed breakouts. Bullish breakouts are marked with green boxes, and bearish breakouts with red boxes.
Momentum Confirmation: The gradient overlay (green for bullish, red for bearish) helps confirm the strength of the trend. Stronger gradients (less transparent) indicate stronger momentum.
Midline Crosses: Small triangles below (bullish) or above (bearish) candles indicate when the price crosses the dynamic midline, providing additional entry/exit signals.
Why This Combination?
The integration of Pivot Trendlines and Squeeze Momentum Oscillator creates a synergy that enhances trade decision-making:
Pivot Trendlines identify key structural levels in the market, making breakouts significant events.
The Squeeze Momentum Oscillator adds a momentum filter, ensuring that breakouts are supported by underlying market strength.
Together, they provide a more holistic view of price action, filtering out low-probability breakouts and highlighting opportunities where trendline breaks align with strong momentum.
Notes
This indicator does not use request.security() or barmerge.lookahead_on, so there is no risk of lookahead bias.
The script is designed to provide clear visual cues without making unrealistic claims about performance. It is intended as a tool for analysis, not a guaranteed trading system.

RSI Strategy//@version=5
strategy("RSI Strategy", overlay=true, default_qty_type=strategy.percent_of_equity, default_qty_value=10)
// Configuración del RSI
rsiLength = 14
rsi = ta.rsi(close, rsiLength)
// Niveles de referencia
rsiLongLevel = 30
rsiShortLevel = 70
// Condiciones de entrada
longCondition = ta.crossover(rsi, rsiLongLevel)
shortCondition = ta.crossunder(rsi, rsiShortLevel)
// Parámetros de gestión de riesgo
stopLossRatio = 0.01 // 1% del precio de entrada
trailStopRatio = 0.005 // 0.5% de trailing stop
breakevenTrigger = 0.005 // 0.5% de movimiento a favor para activar breakeven
// Cálculo de Stop Loss y Take Profit
longStopLoss = close * (1 - stopLossRatio)
longTakeProfit = close * (1 + 2 * stopLossRatio)
shortStopLoss = close * (1 + stopLossRatio)
shortTakeProfit = close * (1 - 2 * stopLossRatio)
// Entrada en largo
if (longCondition)
strategy.entry("Long", strategy.long)
strategy.exit("TakeProfit", from_entry="Long", limit=longTakeProfit, stop=longStopLoss, trail_points=trailStopRatio * close, trail_offset=trailStopRatio * close)
// Entrada en corto
if (shortCondition)
strategy.entry("Short", strategy.short)
strategy.exit("TakeProfit", from_entry="Short", limit=shortTakeProfit, stop=shortStopLoss, trail_points=trailStopRatio * close, trail_offset=trailStopRatio * close)
// Mostrar RSI en el gráfico
rsiPlot = plot(rsi, title="RSI", color=color.blue)
hline(rsiLongLevel, "RSI 30", color=color.green)
hline(rsiShortLevel, "RSI 70", color=color.red)

UltraAlgoguy Toolkit [CuriousB]modified QuantVue GMMA Toolkit to change the moving average bands for UltraGuppy specs for Scott's Zone Traders Algoguy++ (courtesy Anthony Algoguy's updated specs)
bands are:
short term: 10-120 ema in 2 step increments
long term: 150-300 ema in 2 step increments
the oscillator shows:
trend strength in the distance away from the 0 line
compression or short term, long term and both indicating market consolidation possibly affecting reversal or continuation
band cross over
buy and sell signals

TEMA Pressure+DivergenceTEMA Divergence + Pressure indicators feature the best of both TEMA indicators in one indicator, providing effective management of your charts for the auxiliary TEMA studies which are crucial in the decision-making process of taking directional entries.
Both indicators combined offer a sense of strength and directionality of current conditions. 55 is an optimal lookback, although 28 can be used for faster response if preferred.


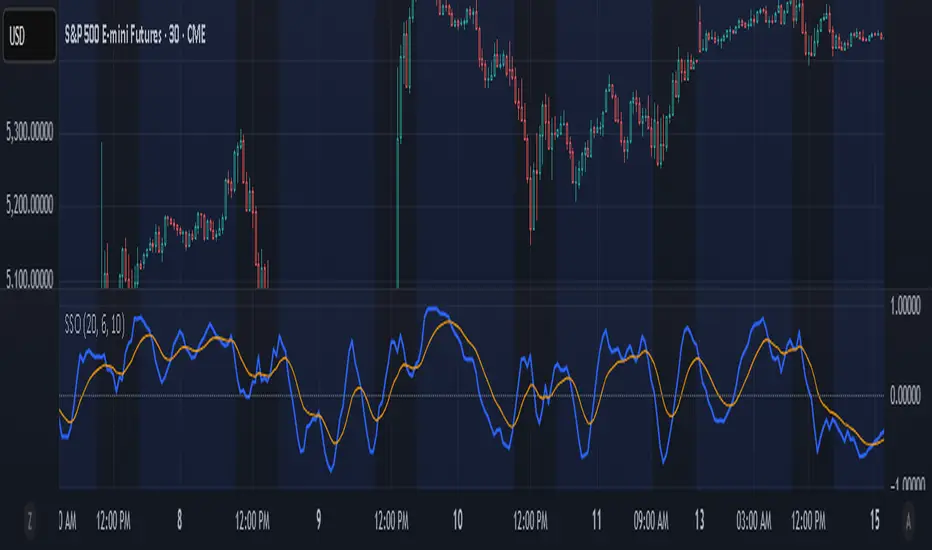
Sine Swing OscillatorThe Sine Swing Oscillator (SSO) is a custom momentum indicator that transforms price movement into a sine-based oscillator ranging from -1 to +1. It does this by measuring the deviation of the current price from a reference price, which is updated at fixed bar intervals. The price deviation is normalized using the Average True Range (ATR) over the same interval, then mapped through a sine transformation to create a bounded oscillator. This transformation helps identify cyclical price behavior in a consistent range.
The resulting sine values are smoothed using a Simple Moving Average (SMA), and a signal line is derived by applying an Exponential Moving Average (EMA) to the smoothed oscillator. Traders can use signal line crossovers, or moves through the zero line, to help identify potential entry or exit signals based on cyclical momentum shifts.
The oscillator and signal line are plotted in a separate pane, with user-configurable smoothing lengths and colors. The zero line is also included for reference.
MACD-V with Volatility Normalisation [DCD]MACD-V with Volatility Normalisation
This indicator is a modified version of the traditional MACD, designed to account for market volatility by normalizing the MACD line using the Average True Range (ATR). It provides a more adaptive approach to identifying momentum shifts and potential trend reversals. This indicator was developed by Alex Spiroglou in this paper:
Spiroglou, Alex, MACD-V: Volatility Normalised Momentum (May 3, 2022).
Features:
Volatility Normalization: The MACD line is adjusted using ATR to standardize its values across different market conditions.
Customizable Parameters: Users can adjust the MACD fast length, slow length, signal line smoothing, and ATR length to suit their trading style.
Histogram Visualization: The histogram highlights the difference between the MACD and signal lines, with customizable colors for positive and negative momentum.
Crossover Signals: Green and red dots indicate bullish and bearish crossovers between the MACD and signal lines.
Background Highlighting: The chart background changes to green when the MACD is above 0 and red when it is below 0, providing a clear visual cue for bullish and bearish conditions.
Horizontal Levels: Dotted horizontal lines are plotted at key levels for better visualization of MACD values.
How to Use:
Look for crossovers between the MACD and signal lines to identify potential buy or sell signals.
Use the histogram to gauge the strength of momentum.
Pay attention to the background color for quick identification of bullish (green) or bearish (red) conditions.
This indicator is ideal for traders who want a more dynamic MACD that adapts to market volatility. Customize the settings to align with your trading strategy and timeframe.

Blue Dot Indicator (Dr. Wish Style)The blue dot is just telling you:
“The stock was oversold and is now bouncing (stochastic %K crossed above 20).”
That's it. It does not guarantee the bounce will continue—only that one might be starting.
So it should not be used alone to take entries.
📉 Why Earlier Blue Dots Failed in this chart before it succeeded -
In the chart (TG Therapeutics), earlier blue dots:
Happened during sideways consolidation
Had no follow-through volume or momentum
Were below or near flat moving averages
Had no breakout of prior swing highs
Hence, they were low-probability setups.
So what you should do -
Practical Rule You Can Try
✅ Only act on a blue dot when price closes above previous swing high, and is above rising 50 SMA or 21 EMA.
🛑 Avoid blue dots during consolidation or if price is below moving averages.

Parabolic RSI Strategy + MA Filter + TP/SL 【PakunFX】🧠 Parabolic RSI Strategy + MA Filter + TP/SL【PakunFX】
This strategy combines a **custom Parabolic SAR applied to the RSI** (momentum-based trend reversal detection) with a **price-based moving average filter** to create a clear and responsive trend-following system.
Additionally, it **automatically draws Take Profit (TP) and Stop Loss (SL) levels** on the chart based on a fixed risk-reward ratio, providing visual risk clarity and supporting consistent trade planning.
---
## 🔍 What This Script Does
**RSI-Based Trend Detection:**
A custom Parabolic SAR is applied to RSI rather than price, enabling detection of **momentum reversals** instead of just price swings.
**MA Directional Filter:**
Entries are filtered by a moving average (EMA or SMA). The strategy only allows trades **in the direction of the trend**—longs above the MA, shorts below.
**Auto-Drawn TP/SL Levels:**
Each trade includes auto-calculated TP and SL lines using a configurable risk-reward ratio (e.g., 2.0), helping traders maintain consistency and discipline.
**Clear Entry Triggers:**
Positions are opened **when the RSI-based Parabolic SAR flips direction**, but only if the price is on the correct side of the MA filter.
→ This ensures trades are made **at the moment of momentum shift**, but only **in the direction of the dominant trend**.
---
## 🧮 Core Logic Breakdown
✅ Entry Conditions
**Long Entry:**
RSI-based SAR flips below the RSI (bullish signal) **and** price is **above** the moving average.
**Short Entry:**
RSI-based SAR flips above the RSI (bearish signal) **and** price is **below** the moving average.
✅ Exit Conditions (Position Reversal)
When an opposite signal occurs, the current position is **closed immediately**, and a new one is **opened in the opposite direction**.
✅ TP / SL Setup
- SL is placed at a **virtual buffer distance** (e.g., 100 pips from entry).
- TP is calculated using the **risk-reward ratio** (e.g., 2.0 → TP at 200 pips if SL = 100).
→ Delivers consistent, risk-defined trades.
---
## 💰 Risk Management Parameters
**Asset / Timeframe:** Any (Backtested on 10-minute chart)
**Account Size (Virtual):** $3,000
**Commission:** 0.02% per trade
**Slippage Buffer:** Equivalent to 100 pips
**Risk Per Trade:** Approximately 5% of account balance
**Number of Trades (Backtest Period):** 125 trades
---
## 📈 Recommended Usage
**Timeframes:** 5m to 30m (scalping to intraday)
**Market Conditions:** Best in trending markets; responsive even in mild ranges
**Assets:** Forex pairs, Gold, WTI Crude, Indexes with volatility
**Discretionary Support:** Visual TP/SL allows for **pre-planned trades** and avoids impulsive decisions
---
## ⚠️ Notes & Considerations
Positions are reversed on opposite signals (no simultaneous longs & shorts).
Backtests do not include broker-specific execution factors—adjust for slippage and spreads if needed.
Strategy is **originally developed**, inspired by “ChartPrime's RSI Parabolic SAR” idea, but fully standalone.
---
## 🖼 Chart Visuals & Features
**MA Line (orange):** Shows trend direction
**TP Line (green dashed):** Take Profit visualization
**SL Line (red dashed):** Stop Loss boundary
**RSI-SAR Flip Points:** Highlight entry timing visually
---
## ✅ Summary
Parabolic RSI Strategy + MA Filter + TP/SL【PakunFX】 is a
“Momentum Detection × Trend Filtering × Exit Visualization” strategy designed for consistent, visually guided decision-making.
With clearly structured logic and visual aids, it serves both discretionary and systematic traders looking for a **momentum-aligned, risk-controlled approach**.

TUE ADX/MACD Confluence Strategy V1.0📈 TUE ADX/MACD Confluence Strategy with SL/TP & PineConnector Integration
This strategy is designed to capture trend-following entries using the ADX (Average Directional Index) and MACD (Moving Average Convergence Divergence) indicators, enhanced with built-in Stop Loss (SL) and Take Profit (TP) management. It is fully compatible with PineConnector, allowing for real-time trade automation on supported brokers via MT4/MT5.
🔍 Core Logic:
Entry Signals:
Long Entry: When +DI > -DI, MACD Line > Signal Line, and ADX confirms a strong trend.
Short Entry: When -DI > +DI, MACD Line < Signal Line, and ADX confirms a strong trend.
Risk Management:
Configurable Stop Loss and Take Profit percentages.
Exits are triggered when either SL or TP is hit.
Projections:
Visual SL/TP projection lines for each position.
Overlay:
Colored candles for visual trend confirmation.
Entry markers for quick signal recognition.
🔧 Customizable Inputs:
ADX & MACD lengths
SL/TP percentages
Candle coloring toggle
Signal visibility toggle
🟢 PineConnector Integration:
This strategy is ideal for use with PineConnector, enabling you to:
Execute trades in real time on your preferred broker.
Use it in live, paper, or demo trading environments.
Automate your strategy with zero coding — simply connect, authorize, and trade.

First Hour TrendThis indicator analyzes the first hour of trading to determine if the market is showing bullish, bearish, or neutral momentum. By default, it's configured for regular US market hours (9:30-10:30 AM ET), but can be customized for any market session. It's based on the "Opening Candle Continuation" strategy, which has shown strong predictive power for daily market direction based on first hour performance.

New Momentum H/LNew Momentum H/L shows when momentum, defined as the rate of price change over time, exceeds the highest or lowest values observed over a user-defined period. These events shows points where momentum reaches new extremes relative to that period, and the indicator plots a column to mark each occurrence.
Increase in momentum could indicate the start of a trend phase from a low volatile or balanced state. However in developed trends, extreme momentum could also mark potential climaxes which can lead to trend termination. This reflects the dual nature of the component.
This indicator is based on the MACD calculated as the difference between a 3-period and a 10-period simple moving average. New highs are indicated when this value exceeds all previous values within the lookback window; new lows when it drops below all previous values. The default lookback period is set to 40 bars, which corresponds with two months on a daily chart.
The indicator also computes a z-score of the MACD line over the past 100 bars. This standardization helps compare momentum across different periods and normalizes the values of current moves relative to recent history.
In practice, use the indicator to confirm presence of momentum at the start of a move from a balanced state (often following a volatility expansion), track how momentum develops inside of a trend structure and locate potential climactic events.
Momentum should in preference be interpreted from price movement. However, to measure and standardize provides structure and helps build more consistent models. This should be used in context of price structure and broader market conditions; as all other tools.

Price OI Division Price OI Division Indicator
Overview
The Price OI Division indicator (`P_OI_D`) is a custom TradingView script designed to analyze the relationship between price momentum and open interest (OI) momentum. It visualizes the divergence between these two metrics using a modified MACD (Moving Average Convergence Divergence) approach, normalized to percentage values. The indicator is plotted as a histogram and two lines (MACD and Signal), with color-coded signals for easier interpretation.
Key Features
- Normalized Price MACD : Compares short-term and long-term price momentum.
- OI-Adjusted MACD : Incorporates open interest data to reflect market positioning.
- Divergence Histogram : Highlights the difference between price and OI momentum.
- Signal Line : Smoothed EMA of the divergence for trend confirmation.
- Threshold Lines : Horizontal reference lines at ±10% and 0 for quick visual analysis.
Interpretation Guide
- Bullish Signal :
Histogram turns red (positive & increasing).
MACD (red line) crosses above Signal (blue line).
Divergence above +10% indicates extreme bullish conditions.
- Bearish Signal :
Histogram turns green (negative & increasing).
MACD (lime line) crosses below Signal (maroon line).
Divergence below -10% indicates extreme bearish conditions.
- Neutral/Reversal :
Histogram fading (teal/pink) suggests weakening momentum.
Crossings near the Zero Line may signal trend shifts.
Usage Notes
Asset Compatibility : Works best with futures/perpetual contracts where OI data is available.
Timeframe : Suitable for all timeframes, but align `fastLength`/`slowLength` with your strategy.
Data Limitations : Relies on exchange-specific OI symbols (e.g., `BTC:USDT.P_OI`). Verify data availability for your asset.
Confirmation : Pair with volume analysis or support/resistance levels for higher accuracy.
Disclaimer
This indicator is for educational purposes only. Trading decisions should not be based solely on this tool. Always validate signals with additional analysis and risk management.

Dual-Phase Trend Regime Oscillator (Zeiierman)█ Overview
Trend Regime: Dual-Phase Oscillator (Zeiierman) is a volatility-sensitive trend classification tool that dynamically switches between two oscillators, one optimized for low volatility, the other for high volatility.
By analyzing standard deviation-based volatility states and applying correlation-derived oscillators, this indicator reveals not only whether the market is trending but also what kind of trend regime it is in —Bullish or Bearish —and how that regime reacts to market volatility.
█ Its Uniqueness
Most trend indicators assume a static market environment; they don't adjust their logic when the underlying volatility shifts. That often leads to false signals in choppy conditions or late entries in trending phases.
Trend Regime: Dual-Phase Oscillator solves this by introducing volatility-aware adaptability. It switches between a slow, stable oscillator in calm markets and a fast, reactive oscillator in volatile ones, ensuring the right sensitivity at the right time.
█ How It Works
⚪ Volatility State Engine
Calculates returns-based volatility using standard deviation of price change
Smooths the current volatility with a moving average
Builds a volatility history window and performs median clustering to determine typical "Low" and "High" volatility zones
Dynamically assigns the chart to one of two internal volatility regimes: Low or High
⚪ Dual Oscillators
In Low Volatility, it uses a Slow Trend Oscillator (longer lookback, smoother)
In High Volatility, it switches to a Fast Trend Oscillator (shorter lookback, responsive)
Both oscillators use price-time correlation as a measure of directional strength
The output is normalized between 0 and 1, allowing for consistent interpretation
⚪ Trend Regime Classification
The active oscillator is compared to a neutral threshold (0.5)
If above: Bullish Regime, if below: Bearish Regime, else: Neutral
The background and markers update to reflect regime changes visually
Triangle markers highlight bullish/bearish regime shifts
█ How to Use
⚪ Identify Current Trend Regime
Use the background color and chart table to immediately recognize whether the market is trending up or down.
⚪ Trade Regime Shifts
Use triangle markers (▲ / ▼) to spot fresh regime entries, which are ideal for confirming breakouts within trends.
⚪ Pullback Trading
Look for pullbacks when the trend is in a stable condition and the slow oscillator remains consistently near the upper or lower threshold. Watch for moments when the fast oscillator retraces back toward the midline, or slightly above/below it — this often signals a potential pullback entry in the direction of the prevailing trend.
█ Settings Explained
Length (Slow Trend Oscillator) – Used in calm conditions. Longer = smoother signals
Length (Fast Trend Oscillator) – Used in volatile conditions. Shorter = more responsive
Volatility Refit Interval – Controls how often the system recalculates Low/High volatility levels
Current Volatility Period – Lookback used for immediate volatility measurement
Volatility Smoothing Length – Applies an SMA to the raw volatility to reduce noise
-----------------
Disclaimer
The content provided in my scripts, indicators, ideas, algorithms, and systems is for educational and informational purposes only. It does not constitute financial advice, investment recommendations, or a solicitation to buy or sell any financial instruments. I will not accept liability for any loss or damage, including without limitation any loss of profit, which may arise directly or indirectly from the use of or reliance on such information.
All investments involve risk, and the past performance of a security, industry, sector, market, financial product, trading strategy, backtest, or individual's trading does not guarantee future results or returns. Investors are fully responsible for any investment decisions they make. Such decisions should be based solely on an evaluation of their financial circumstances, investment objectives, risk tolerance, and liquidity needs.

15-Min Candlestick StrategyThis strategy combines the MACD (Moving Average Convergence Divergence) indicator with the 200 EMA (Exponential Moving Average) to identify trend-confirmed entry signals on the 15-minute timeframe.
📊 Logic:
The 200 EMA acts as a trend filter:
Only long trades are taken when price is above the EMA
Only short trades are taken when price is below the EMA
MACD crossovers provide the trade signals:
Bullish crossover (MACD crosses above Signal) = Long entry (if above 200 EMA)
Bearish crossover (MACD crosses below Signal) = Short entry (if below 200 EMA)
Trades are exited when the MACD crosses in the opposite direction or price closes on the wrong side of the 200 EMA.
✅ Features:
Simple trend-following logic with momentum confirmation
Works on any asset (Forex, Crypto, Stocks) and optimized for 15m charts
Backtestable and compatible with PineConnector for live algo trading
Ideal for traders seeking a clean and effective MACD-based strategy that avoids counter-trend setups.

AP_Ultimate CCI MTF v5**AP Ultimate CCI Multi-Timeframe Indicator**
*Track Commodity Channel Index trends across multiple timeframes in one view!*
**Overview:**
Adapted from ChrisMoody's popular RSI MTF concept, this enhanced version brings powerful multi-timeframe analysis to the CCI indicator. Perfect for traders who want to confirm trends across different time horizons without switching charts.
**Key Features:**
📈 **Dual CCI Analysis**
- Primary CCI (Default: 1H) + Secondary CCI (Default: 4H)
- Fully customizable timeframes for both indicators
- Independent length settings (14-50 periods recommended)
🚦 **Visual Trading Signals**
- Automatic Buy/Sell markers on crossovers
- 🟢 **B** Signals: When CCI crosses above -100 (Oversold reversal)
- 🔴 **S** Signals: When CCI crosses below +100 (Overbought reversal)
- Clean triangular markers at chart edges for clear visibility
🎨 **Customizable Visuals**
- Adjustable overbought/oversold levels (Default: ±100)
- Background highlights for extreme zones
- Modern color schemes with transparency control
- Optional zero line display
⚙️ **Technical Specs**
- Built in Pine Script v6
- Non-repainting calculations
- Timeframe-aware alerts support
- Optimized for all asset classes
**How to Use (my use case):**
1. Apply to 15M-4H charts for intraday trading
2. Default setup: Compare 1H vs 4H CCI
3. Look for confluence between timeframes:
- Strong trend = Both CCIs moving in same direction
- Reversal signal = Crossovers with volume confirmation
4. Combine with price action or support/resistance
**Why this Indicator:**
✅ Eliminates manual timeframe switching
✅ Identifies hidden divergences between time horizons
✅ Works equally well for stocks, forex, and crypto
✅ Perfect for momentum and mean-reversion strategies
*Pro Tip: Pair with volume indicators and moving averages for enhanced confirmation!*
