Chart patterns

Equal High/Low (EQH/EQL) [AlgoAlpha]OVERVIEW
This script detects and visualizes Equal High (EQH) and Equal Low (EQL) zones—key liquidity areas where price has previously stalled or reversed. These levels often attract institutional interest due to the liquidity buildup around them. The indicator is built to highlight such zones using dynamic thresholding, overbought/oversold RSI filtering, and adaptive mitigation logic to manage zone relevance over time.
CONCEPTS
Equal Highs/Lows are price points where the market has repeatedly failed to break past a certain high or low, hinting at areas where stop orders and pending interest may be concentrated. These areas are often prime targets for liquidity grabs or reversals. By combining this with RSI filtering, the script avoids false signals during neutral conditions and instead focuses on zones where market pressure is more directional.
FEATURES
Detection Logic: The script identifies EQH and EQL zones by comparing the similarity between recent highs or lows with a dynamic volatility threshold. The `tolerance` input allows users to control how strict this comparison is.
RSI Filtering: If enabled, it only creates zones when RSI is significantly overbought or oversold (based on the `state_thresh` input). This helps ensure zones form only in meaningful market conditions.
Zone Display: Bullish (EQL) zones are shown in grey, while bearish (EQH) zones are in blue. Two horizontal lines mark the zone using wick and body extremes, and a filled area visualizes the zone between them.
Zone Management: Zones automatically extend with price until they’re invalidated. You can choose whether a zone is removed based on wick or body sweeps and whether it requires one or two candle confirmations. Zones also expire after a customizable number of bars.
Alerts: Four alert conditions are built in—when a new EQH/EQL is formed and when one is mitigated—making it easy to integrate into alert-based workflows.
USAGE
Equal highs/lows can be used as liquidity markers, either as entry points or as take-profit targets.
This tool is ideal for liquidity-based strategies and helps traders map out possible reversal or sweep zones that often precede aggressive moves.

ICT Killzones & Pivots [TFO]adjusted the script to fit my needs. I mainly use it to identify the FVG and OB, as well as D/W/M HH/LL

stracturre.x// This source code is subject to the terms of the Mozilla Public License 2.0 at mozilla.org
// © @mr_khan_smc
////////////////////////////////////////
// Commercial Use Protection Notice:
// This code is protected for commercial use. Any unauthorized reproduction, distribution, or modification
// of this code for commercial purposes is strictly prohibited and may result in legal actions.
////////////////////////////////////////
//@version=5
indicator("stracturre.x", "KHAN SMC", true,
max_bars_back = 5000, max_labels_count = 500, max_lines_count = 500)
//#region variable declaration
var bool mnUp = na
var bool mnDn = na
float mnStrc = na
var top = high
var bot = low
var puUp = high
var puDn = low
var L = low
var H = high
var idmB = low
var idmS = high
var lastH = high
var lastL = low
var lastHH = high
var lastLL = low
//bar indexes
var int puUpbar = na
var int puDnbar = na
var int idmB_bar = na
var int idmS_bar = na
var int Hbar = bar_index
var int Lbar = bar_index
var int lastHbar = bar_index
var int lastLbar = bar_index
var int lastHHbar = bar_index
var int lastLLbar = bar_index
//structure confirmaions
lastHL = math.max(Hbar, Lbar)
var bool isBosUp = 0
var bool isBosDn = 0
var bool isCocUp = 1
var bool isCocDn = 1
//color
color transp = color.new(#59ff62, 5)
//drawing options
equalHL = input.bool(0,"Use equal H/L", "To calculate valid pullbacks and minor structure", group = "Calculation method")
showHL = input.bool(1, "Mark H/L", group = "H/L marking options")
HLcolor = input.color(color.rgb(0, 0, 0), "H/L color", group = "H/L marking options")
showMn = input.bool(0, "Mark out internal structure", group = "Internal structue")
puUpco = input.color(color.rgb(255, 82, 82) , "High pivots", inline = "mnco", group = "Internal structue")
puDnco = input.color(color.green, "Low pivots" , inline = "mnco", group = "Internal structue")
showBC = input.bool(1, "Mark BoS/ChoCH", group = "BoS/Choch")
bull = input.color(color.green, "Bull color", inline = "BSclor" ,group = "BoS/Choch")
bear = input.color(color.red , "Bear color", inline = "BSclor" ,group = "BoS/Choch")
showbarcolor = input.bool(0,"Bar color", group = "Bar color")
showSCOB = input.bool(1, "Show SCOB pattern", group = "Bar color")
scobUp = input.color(color.aqua , "Bullish SCOB", inline = "scob" , group = "Bar color")
scobDn = input.color(color.fuchsia, "Bearish SCOB", inline = "scob" , group = "Bar color")
showIDM = input.bool(1,"Mark previous IDM", group = "IDM")
showliveIDM = input.bool(1,"Mark live IDM", group = "IDM")
idmColor = input.color(color.rgb(21, 6, 230), "IDM color", group = "IDM")
var label lv_lbl = na
var line lv_line = na
showSw = input.bool(1, "Show H/L sweeping lines", group = "H/L sweeps")
markX = input.bool(1, 'Mark "X"', group = "H/L sweeps")
swColor = input.color(color.white, "Sweeping line color", group = "H/L sweeps")
//max line length
maxlen = bar_index - 500
//#endregion
//#region drawing functions
mnMark(bool UD) =>
if showMn
label.new(
x = UD ? puUpbar : puDnbar,
y = UD ? puUp : puDn,
yloc = UD ? yloc.abovebar : yloc.belowbar,
text = "",
color = UD ? puUpco : puDnco,
style = UD ? label.style_arrowdown : label.style_arrowup,
size = size.tiny
)
BoS_ChoCh(bool B_C, bool UpDn) =>
= switch
B_C == 1 and UpDn == 1 =>
B_C == 0 and UpDn == 1 =>
B_C == 0 and UpDn == 0 =>
B_C == 1 and UpDn == 0 =>
HLbarid := HLbarid < maxlen ? maxlen : HLbarid
if showBC
line.new(HLbarid, BCprc, bar_index, BCprc, color = BCcolor, style = line.style_dashed)
label.new(
int( math.avg(bar_index,HLbarid) ), BCprc
,BCtxt
,color = transp
,style = BCstyle
,textcolor = BCcolor
)
cfHL(bool ifHL) =>
= switch
ifHL =>
if high > H
else
=>
if low < L
else
ifHL_txt = if ifHL
if H == lastHH
"HH"
else
"LH"
else
if L == lastLL
"LL"
else
"HL"
cfHLStyle = ifHL ? label.style_label_down : label.style_label_up
if showHL
label.new(ifHLbarid,HLprc,ifHL_txt, color = transp, textcolor = HLcolor, style = cfHLStyle)
sweep(bool swHL, bool swHrLr) =>
swStyle = swHL ? label.style_label_down : label.style_label_up
= switch
swHL == 1 and swHrLr == 1 =>
swHL == 1 and swHrLr == 0 =>
swHL == 0 and swHrLr == 1 =>
swHL == 0 and swHrLr == 0 =>
swHLbarid := swHLbarid < maxlen ? maxlen : swHLbarid
//draw sweeping line
if showSw
line.new(swHLbarid,swprc,bar_index,swprc,color = swColor,style = line.style_dotted)
if markX
label.new(int(math.avg(bar_index,swHLbarid)),swprc, "X", color = transp, textcolor = swColor, style = swStyle, size = size.small)
IDM(bool BS) =>
IDMid = BS ? idmB_bar : idmS_bar
idmprc = BS ? idmB : idmS
idmStyle = BS ? label.style_label_up : label.style_label_down
IDMid := IDMid < maxlen ? maxlen : IDMid
//draw idm takeout line
if showIDM
line.new(IDMid,idmprc,bar_index,idmprc,color = idmColor,style = line.style_dotted)
label.new(int(math.avg(bar_index,IDMid)),idmprc, "IDM", color = transp, textcolor = idmColor, style = idmStyle,size = size.small)
//Bar color
ba_color = if showSCOB
if low == puDn and low >= low and close > high and close > low
scobUp
else if high == puUp and high <= high and close < low and close < high
scobDn
else if showbarcolor
isCocUp?bull:bear
else
na
barcolor(ba_color,-1)
//#endregion
//#region structure mapping
//update IDM
if (high > H or (high == H and equalHL)) and low > idmB
if low <= puDn
idmB := low
idmB_bar := bar_index
else
idmB := puDn
idmB_bar := puDnbar
if (low < L or (low == L and equalHL)) and high < idmS
if high >= puUp
idmS := high
idmS_bar := bar_index
else
idmS := puUp
idmS_bar := puUpbar
//Check for IDM and ChoCh
if isCocUp and lastHL != Lbar
if low < idmB
if idmB != lastL
IDM(1)
isBosUp := 0
lastH := H
lastHbar := Hbar
lastHH := H
lastHHbar := Hbar
cfHL(1)
L := low
Lbar := bar_index
else if lastH != lastHH and high > lastH
cfHL(0)
isCocDn := 0
isBosDn := 0
if close > lastH
BoS_ChoCh(0,1)
isCocUp := 1
else
sweep(1,0)
if isCocDn and lastHL != Hbar
if high > idmS
if idmS != lastH
IDM(0)
isBosDn := 0
lastL := L
lastLbar := Lbar
lastLL := L
lastLLbar := Lbar
cfHL(0)
H := high
Hbar := bar_index
else if low < lastL and lastL != lastLL
if close < lastL
BoS_ChoCh(0,0)
cfHL(1)
isCocDn := 1
isCocUp := 0
isBosUp := 0
else
sweep(0,1)
//Check for BoS
if isBosUp == 0
if high > lastHH
if close > lastHH
BoS_ChoCh(1,1)
cfHL(0)
lastL := L
lastLbar := Lbar
isCocUp := 1
isBosUp := 1
isCocDn := 0
isBosDn := 0
else
sweep(1,1)
if isBosDn == 0
if low < lastLL
if close < lastLL
BoS_ChoCh(1,0)
cfHL(1)
lastH := H
lastHbar := Hbar
isCocUp := 0
isBosUp := 0
isCocDn := 1
isBosDn := 1
else
sweep(0,0)
//#endregion
//#region internal structure
if equalHL
if high >= top
if low > bot
mnDn :=0
mnUp := 1
if low <= bot
if high < top
mnUp := 0
mnDn := 1
if mnUp and not mnUp
mnMark(1)
if mnDn and not mnDn
mnMark(0)
else
if high > top
if low > bot
mnDn :=0
mnUp := 1
if low < bot
if high < top
mnUp := 0
mnDn := 1
if mnUp and not mnUp
mnMark(1)
if mnDn and not mnDn
mnMark(0)
if equalHL
if high >= top
puUp := high
puUpbar := bar_index
if low <= bot
puDn := low
puDnbar := bar_index
top := high
bot := low
if high >= top
top := high
bot := low
else
if high > top
puUp := high
puUpbar := bar_index
if low < bot
puDn := low
puDnbar := bar_index
top := high
bot := low
if high > top
top := high
bot := low
//#endregion
//#region auto update High and Low vars
if high > H or (high == H and equalHL)
H := high
Hbar := bar_index
if high > idmS
idmS := high
idmS_bar := bar_index
if high > lastH or (high == lastH and equalHL)
lastH := high
lastHbar := bar_index
if high > lastHH or (high == lastHH and equalHL)
lastHH := high
lastHHbar := bar_index
if low < L or (low == L and equalHL)
L := low
Lbar := bar_index
if low < idmB
idmB := low
idmB_bar := bar_index
if low < lastL or (low == lastL and equalHL)
lastL := low
lastLbar := bar_index
if low < lastLL or (low == lastLL and equalHL)
lastLL := low
lastLLbar := bar_index
//#endregion
//#region live IDM
if showliveIDM and barstate.islast
= if isCocUp and lastHL == Hbar
else if isCocDn and lastHL == Lbar
lv_line := line.new(liveIDMbar, liveIDM, bar_index + 20, liveIDM, color = idmColor, style = line.style_dotted),
lv_lbl := label.new(bar_index + 20, liveIDM, "IDM", color = transp, textcolor = idmColor, style = isCocUp ? label.style_label_down : label.style_label_up, size = size.small)
else
lv_line := na
lv_lbl := na
line.delete(lv_line )
label.delete(lv_lbl )
//#endregion
//#region fixing bugs
// plot(H,"H")
// plot(lastH, "lastH")
// plot(lastHH, "lastHH")
// plot(idmS, "idmS")
// plot(puUp, "puUp")
// plot(L,"L")
// plot(lastL, "lastL")
// plot(lastLL, "lastLL")
// plot(idmB, "idmB")
// plot(puDn, "puDn")
//#endregion

Expected Move Manual EditVisualize key weekly support and resistance levels based on manually entered Previous Week
Close (PWC) and Expected Move (EM) values.
This script plots:
Your entered PWC (Black, Solid Line).
Expected Move Top (+1 SD based on your EM input) (Green, Solid Line).
Expected Move Bottom (-1 SD based on your EM input) (Red, Solid Line).
Intermediate quadrant levels (+/- 0.25, 0.50, 0.75 SD) (Green/Red, Dotted Lines).
Features:
Manual PWC & Expected Move inputs.
Clear visual styling for levels.
Toggleable labels on the price axis.
Toggleable labels directly on the chart (right-aligned).
How to Use:
Add to chart.
Go to Settings -> Inputs.
Enter your calculated/sourced PWC value.
Enter your calculated/sourced Expected Move value (treated as 1 Standard Deviation).
Adjust label visibility if desired.
Note: This indicator requires manual input for PWC and EM; it does not calculate them automatically. The Ticker Symbol input is for reference only.

Smart Range DetectorSmart Range Detector
What It Does
This indicator automatically detects and validates significant trading ranges using pivot point analysis combined with logarithmic fibonacci relationships. It operates by identifying specific pivot patterns (High-Low-High and Low-High-Low) that meet fibonacci validation criteria to filter out noise and highlight only the most reliable trading ranges. Each range is continuously monitored for potential mitigation (breakout) events.
Key Features
Identifies both High-Low-High and Low-High-Low range patterns
Validates each range using logarithmic fibonacci relationships (more accurate than linear fibs)
Detects range mitigations (breakouts) and visually differentiates them
Shows fibonacci levels within ranges (25%, 50%, 75%) for potential reversal points
Visualizes extension levels beyond ranges for breakout targets
Analyzes volume profile with customizable price divisions (default: 60)
Displays Point of Control (POC) and Value Area for traded volume analysis
Implements performance optimization with configurable range limits
Includes user-adjustable safety checks to prevent Pine Script limitations
Offers fully customizable colors, line widths, and transparency settings
How To Use It
Identify Valid Ranges : The indicator automatically detects and highlights trading ranges that meet fibonacci validation criteria
Monitor Fibonacci Levels : Watch for price reactions at internal fib levels (25%, 50%, 75%) for potential reversal opportunities
Track Extension Targets : Use the extension lines as potential targets when price breaks out of a range
Analyze Volume Structure : Enable the volume profile mode to see where most volume was traded within mitigated ranges
Trade Range Boundaries : Look for reactions at range highs/lows combined with volume POC for higher probability entries
Manage Performance : Adjust the maximum displayed ranges and history bars settings for optimal chart performance
Settings Guide
Left/Right Bars Look Back : Controls how far back the indicator looks to identify pivot points (higher values find more ranges but may reduce sensitivity)
Max History Bars : Limits how far back in history the indicator will analyze (stays within Pine Script's 10,000 bar limitation)
Max Ranges to Display : Restricts the total number of ranges kept in memory for improved performance (1-50)
Volume Profile : When enabled, shows volume distribution analysis for mitigated ranges
Volume Profile Divisions : Controls the granularity of the volume analysis (higher values show more detail)
Display Options : Toggle visibility of range lines, fibonacci levels, extension lines, and volume analysis elements
Transparency & Color Settings : Fully customize the visual appearance of all indicator elements
Line Width Settings : Adjust the thickness of lines for better visibility on different timeframes
Technical Details
The indicator uses logarithmic fibonacci calculations for more accurate price relationships
Volume profile analysis creates 60 price divisions by default (adjustable) for detailed volume distribution
All timestamps are properly converted to work with Pine Script's bar limitations
Safety checks prevent "array index out of bounds" errors that plague many complex indicators
Time-based coordinates are used instead of bar indices to prevent "bar index too far" errors
This indicator works well on all timeframes and instruments, but performs best on 5-minute to daily charts. Perfect for swing traders, range traders, and breakout strategists.
What Makes It Different
Most range indicators simply draw boxes based on recent highs and lows. Smart Range Detector validates each potential range using proven fibonacci relationships to filter out noise. It then adds sophisticated volume analysis to help traders identify the most significant price levels within each range. The performance optimization features ensure smooth operation even on lower timeframes and extended history analysis.

Time-Based Fair Value Gaps (FVG) with Inversions (iFVG)Overview
The Time-Based Fair Value Gaps (FVG) with Inversions (iFVG) (ICT/SMT) indicator is a specialized tool designed for traders using Inner Circle Trader (ICT) methodologies. Inspired by LuxAlgo's Fair Value Gap indicator, this script introduces significant enhancements by integrating ICT principles, focusing on precise time-based FVG detection, inversion tracking, and retest signals tailored for institutional trading strategies. Unlike LuxAlgo’s general FVG approach, this indicator filters FVGs within customizable 10-minute windows aligned with ICT’s macro timeframes and incorporates ICT-specific concepts like mitigation, liquidity grabs, and session-based gap prioritization.
This tool is optimized for 1–5 minute charts, though probably best for 1 minute charts, identifying bullish and bearish FVGs, tracking their mitigation into inverted FVGs (iFVGs) as key support/resistance zones, and generating retest signals with customizable “Close” or “Wick” confirmation. Features like ATR-based filtering, optional FVG labels, mitigation removal, and session-specific FVG detection (e.g., first FVG in AM/PM sessions) make it a powerful tool for ICT traders.
Originality and Improvements
While inspired by LuxAlgo’s FVG indicator (credit to LuxAlgo for their foundational work), this script significantly extends the original concept by:
1. Time-Based FVG Detection: Unlike LuxAlgo’s continuous FVG identification, this script filters FVGs within user-defined 10-minute windows each hour (:00–:10, :10–:20, etc.), aligning with ICT’s emphasis on specific periods of institutional activity, such as hourly opens/closes or kill zones (e.g., New York 7:00–11:00 AM EST). This ensures FVGs are relevant to high-probability ICT setups.
2. Session-Specific First FVG Option: A unique feature allows traders to display only the first FVG in ICT-defined AM (9:30–10:00 AM EST) or PM (1:30–2:00 PM EST) sessions, reflecting ICT’s focus on initial market imbalances during key liquidity events.
3. ICT-Driven Mitigation and Inversion Logic: The script tracks FVG mitigation (when price closes through a gap) and converts mitigated FVGs into iFVGs, which serve as ICT-style support/resistance zones. This aligns with ICT’s view that mitigated gaps become critical reversal points, unlike LuxAlgo’s simpler gap display.
4. Customizable Retest Signals: Retest signals for iFVGs are configurable for “Close” (conservative, requiring candle body confirmation) or “Wick” (faster, using highs/lows), catering to ICT traders’ need for precise entry timing during liquidity grabs or Judas swings.
5. ATR Filtering and Mitigation Removal: An optional ATR filter ensures only significant FVGs are displayed, reducing noise, while mitigation removal declutters the chart by removing filled gaps, aligning with ICT’s principle that mitigated gaps lose relevance unless inverted.
6. Timezone and Timeframe Safeguards: A timezone offset setting aligns FVG detection with EST for ICT’s New York-centric strategies, and a timeframe warning alerts users to avoid ≥1-hour charts, ensuring accuracy in time-based filtering.
These enhancements make the script a distinct tool that builds on LuxAlgo’s foundation while offering ICT traders a tailored, high-precision solution.
How It Works
FVG Detection
FVGs are identified when a candle’s low is higher than the high of two candles prior (bullish FVG) or a candle’s high is lower than the low of two candles prior (bearish FVG). Detection is restricted to:
• User-selected 10-minute windows (e.g., :00–:10, :50–:60) to capture ICT-relevant periods like hourly transitions.
• AM/PM session first FVGs (if enabled), focusing on 9:30–10:00 AM or 1:30–2:00 PM EST for key market opens.
An optional ATR filter (default: 0.25× ATR) ensures only gaps larger than the threshold are displayed, prioritizing significant imbalances.
Mitigation and Inversion
When price closes through an FVG (e.g., below a bullish FVG’s bottom), the FVG is mitigated and becomes an iFVG, plotted as a support/resistance zone. iFVGs are critical in ICT for identifying reversal points where institutional orders accumulate.
Retest Signals
The script generates signals when price retests an iFVG:
• Close: Triggers when the candle body confirms the retest (conservative, lower noise).
• Wick: Triggers when the candle’s high/low touches the iFVG (faster, higher sensitivity). Signals are visualized with triangular markers (▲ for bullish, ▼ for bearish) and can trigger alerts.
Visualization
• FVGs: Displayed as colored boxes (green for bullish, red for bearish) with optional “Bull FVG”/“Bear FVG” labels.
• iFVGs: Shown as extended boxes with dashed midlines, limited to the user-defined number of recent zones (default: 5).
• Mitigation Removal: Mitigated FVGs/iFVGs are removed (if enabled) to keep the chart clean.
How to Use
Recommended Settings
• Timeframe: Use 1–5 minute charts for precision, avoiding ≥1-hour timeframes (a warning label appears if misconfigured).
• Time Windows: Enable :00–:10 and :50–:60 for hourly open/close FVGs, or use the “Show only 1st presented FVG” option for AM/PM session focus.
• ATR Filter: Keep enabled (multiplier 0.25–0.5) for significant gaps; disable on 1-minute charts for more FVGs during volatility.
• Signal Preference: Use “Close” for conservative entries, “Wick” for aggressive setups.
• Timezone Offset: Set to -5 for EST (or -4 for EDT) to align with ICT’s New York session.
Trading Strategy
1. Macro Timeframes: Focus on New York (7:00–11:00 AM EST) or London (2:00–5:00 AM EST) kill zones for high institutional activity.
2. FVG Entries: Trade bullish FVGs as support in uptrends or bearish FVGs as resistance in downtrends, especially in :00–:10 or :50–:60 windows.
3. iFVG Retests: Enter on retest signals (▲/▼) during liquidity grabs or Judas swings, using “Close” for confirmation or “Wick” for speed.
4. Session FVGs: Use the “Show only 1st presented FVG” option to target the first gap in AM/PM sessions, often tied to ICT’s market maker algorithms.
5. Risk Management: Combine with ICT concepts like order blocks or breaker blocks for confluence, and set stops beyond FVG/iFVG boundaries.
Alerts
Set alerts for:
• “Bullish FVG Detected”/“Bearish FVG Detected”: New FVGs in selected windows.
• “Bullish Signal”/“Bearish Signal”: iFVG retest confirmations.
Settings Description
• Show Last (1–100, default: 5): Number of recent iFVGs to display. Lower values reduce clutter.
• Show only 1st presented FVG : Limits FVGs to the first in 9:30–10:00 AM or 1:30–2:00 PM EST sessions (overrides time window checkboxes).
• Time Window Checkboxes: Enable/disable FVG detection in 10-minute windows (:00–:10, :10–:20, etc.). All enabled by default.
• Signal Preference: “Close” (default) or “Wick” for iFVG retest signals.
• Use ATR Filter: Enables ATR-based size filtering (default: true).
• ATR Multiplier (0–∞, default: 0.25): Sets FVG size threshold (higher values = larger gaps).
• Remove Mitigated FVGs: Removes filled FVGs/iFVGs (default: true).
• Show FVG Labels: Displays “Bull FVG”/“Bear FVG” labels (default: true).
• Timezone Offset (-12 to 12, default: -5): Aligns time windows with EST.
• Colors: Customize bullish (green), bearish (red), and midline (gray) colors.
Why Use This Indicator?
This indicator empowers ICT traders with a tool that goes beyond generic FVG detection, offering precise, time-filtered gaps and inversion tracking aligned with institutional trading principles. By focusing on ICT’s macro timeframes, session-specific imbalances, and customizable signal logic, it provides a clear edge for scalping, swing trading, or reversal setups in high-liquidity markets.

NY Open Market Condition Analyzer – TTR & RINY Open Market Condition Analyzer – TTR & RI
Built for MNQ/NQ futures scalpers, this indicator filters out weak sessions and highlights when conditions at the **New York Open (6:30–8:30AM PST)** align with high-probability setups.
📊 Core Strategy Filters
TTR = Total Trading Range (2:00–6:30AM PST premarket movement)
RI = Reactive Impulse (first 5-minute candle size)
VWAP Clearance = directional clarity
🎯 Primary Objective
This tool helps you:
Skip indecisive sessions (often Mondays/Fridays)
Trade only when structural volatility and momentum support your scalping edge
Save mental capital by confirming setup quality *before* taking trades
✅ Features
🧠 Smart Session Filter
Automatically scans for 3 key signals:
- Premarket Range ≥ customizable threshold (default: 15 points)
- Opening Candle Impulse ≥ customizable threshold (default: 10 points)
- Price Distance from VWAP ≥ customizable threshold (default: 5 points)
🎨 Visual Feedback
Background Color
- 🟩 Green = Strong Session (GOOD SETUP)
- 🟥 Red = Weak Structure (SKIP)
Labels & Shapes** at 6:30AM PST
📋 Dashboard Panel (6:30AM PST)
Displays key live metrics:
Premarket Range
First 5-minute Candle Body Size
VWAP Distance
Overall Setup Signal (✅ or ⚠️)
🔔 Real-Time Alert System
Get notified right at the NY open if a “GOOD SETUP” is detected.
🛠️ Configurable Settings
🔧 Minimum Premarket Range
🔧 Minimum Candle Body Size
🔧 Minimum VWAP Distance
🎨 Custom Colors for:
- Session Quality
- Dashboard
- VWAP / Range Lines
🔔 How to Add the Alert
Load this script on your MNQ chart.
Click the **"Alerts" tab** (🔔 icon on the right sidebar).
Click **"+ Create Alert"**.
For **Condition**, select:
- `NY Open Market Condition Analyzer – TTR & RI` → `Good Setup Alert`
Set **Alert Action** (app push, email, webhook, etc.)
Set **"Only Once Per Bar"** to ensure you’re only notified once at 6:30AM PST.
🧪 Best For
NQ/MNQ scalpers using 1R setups (10–30pt targets)
Traders who want to avoid Mondays/Fridays unless structure proves otherwise
Structure-first discretionary or semi-systematic traders
🧠 Pro Tip
Pair this with:
Session VWAP
Pre-market S/R zones
Opening Range Breakout strategies
This tool ensures you’re only hunting on the right terrain.

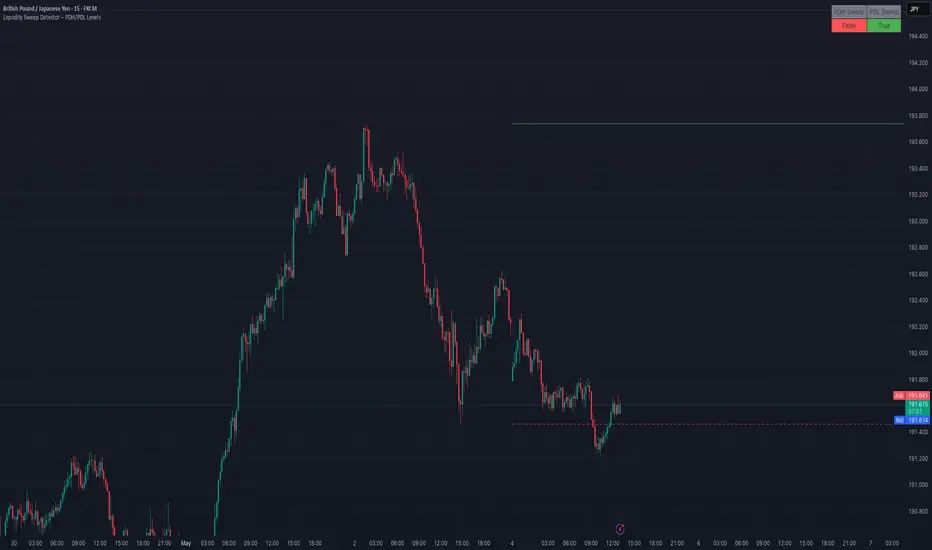
Liquidity Sweep Detector – PDH/PDL LevelsPrevious Day High/Low Liquidity Sweep Detector (Intraday Accurate)
This indicator tracks the previous day's high and low using intraday data, rather than the daily candle, ensuring precise sweep detection across lower timeframes (15m to 4H).
It monitors for liquidity sweeps—moments when price briefly moves above the previous high or below the previous low—and visually marks these events on the chart.
Key Features
Intraday-accurate PDH/PDL tracking
Real-time sweep detection
On-chart labels marking sweep events
Toggleable table showing sweep status
Alert conditions for PDH/PDL sweep triggers
Best For
Traders who use Smart Money Concepts (SMC), liquidity-based strategies, or look for stop hunts and reversal zones tied to key prior-day levels.
Works well across FX, crypto, and indices on 15m, 1H, and 4H charts.
Model+ - Dynamic Trendlines//@version=5
indicator("Model+ - Dynamic Trendlines", overlay=true)
// === Helper: Detect Swing Highs and Lows ===
isSwingLow(idx) => low < low and low < low
isSwingHigh(idx) => high > high and high > high
// === Function to find trendlines ===
findTrendline(_isLow, length) =>
var float point1 = na
var float point2 = na
var int idx1 = na
var int idx2 = na
for i = length to 1 by -1
if _isLow ? isSwingLow(i) : isSwingHigh(i)
if na(point1)
point1 := _isLow ? low : high
idx1 := bar_index - i
else if na(point2)
point2 := _isLow ? low : high
idx2 := bar_index - i
break
slope = (point2 - point1) / (idx2 - idx1)
offset = bar_index - idx2
start = point2 + slope * (-offset)
end = point2 + slope * (1 - offset)
// === Dynamic detection per timeframe ===
timeframeName = timeframe.period
len = switch timeframeName
"D" => 50
"W" => 30
"M" => 20
=> 50
// === Detect trendlines ===
= findTrendline(true, len)
= findTrendline(false, len)
// === Draw lines ===
var line trendSupport = na
var line trendResistance = na
if not na(startLow) and not na(endLow)
line.delete(trendSupport)
trendSupport := line.new(x1=bar_index - 1, y1=startLow, x2=bar_index, y2=endLow, color=color.green, width=2, style=line.style_solid)
if not na(startHigh) and not na(endHigh)
line.delete(trendResistance)
trendResistance := line.new(x1=bar_index - 1, y1=startHigh, x2=bar_index, y2=endHigh, color=color.red, width=2, style=line.style_solid)
// === Support/Resistance Horizontal (based on swing points) ===
getHorizontalLevels(n) =>
var float support = na
var float resistance = na
for i = n to 1 by -1
if isSwingLow(i) and na(support)
support := low
if isSwingHigh(i) and na(resistance)
resistance := high
if not na(support) and not na(resistance)
break
= getHorizontalLevels(len)
var line srSupportLine = na
var line srResistanceLine = na
if not na(supportLine)
line.delete(srSupportLine)
srSupportLine := line.new(x1=bar_index - len, y1=supportLine, x2=bar_index, y2=supportLine, color=color.green, style=line.style_dashed)
if not na(resistanceLine)
line.delete(srResistanceLine)
srResistanceLine := line.new(x1=bar_index - len, y1=resistanceLine, x2=bar_index, y2=resistanceLine, color=color.red, style=line.style_dashed)

EMA Scalping Buy/Sell Labels5-min chart Gold (XAU/USD)
✅ EMA 9 crosses above EMA 21
✅ Price pulls back and touches EMA 21
✅ Bullish engulfing candle appears
✅ Enter long, target quick 10 pips
✅ Stop-loss 5 pips below EMA 21

Intraday Trading IndicatorIndicator Overview
Moving Averages: Uses a fast EMA (9-period) and a slow EMA (21-period) to determine the trend direction.
Market Profile Approximation: Utilizes VWAP (Volume Weighted Average Price) as a simplified proxy for value area, acting as a dynamic support/resistance level.
SMC: Incorporates the concept of trend confirmation and price interaction with key levels, focusing on pullbacks to the fast EMA within a trending market.
Signals: Generates buy and sell signals when price crosses the fast EMA, filtered by the trend (fast EMA vs. slow EMA) and VWAP position, aiming for high-probability setups.
This design ensures responsiveness on short timeframes while filtering out noise, aligning with the goal of accurate signals for intraday trading.

Tango Rocket velas 1.5Tango Rocket Indicator:
Daily Volatility Range Projection
This indicator identifies the 3 largest-bodied candles from the last N daily bars and calculates a projected price range centered on the current day’s opening price. The projected channel is displayed for the current day and past days, helping visualize potential daily movement and historical volatility patterns.

תחזית ממוצע נע (4 ממוצעים)Visualize potential future movements of up to four Simple Moving Averages (SMAs) with this customizable forecasting tool for TradingView, built on Pine Script v4.
How It Works:
This indicator plots your chosen SMAs and then, from the most recent bar, projects their paths into the future. The projection is based on a single, global 'Future Price Change %' that you define. This allows you to model how the SMAs might react under different market scenarios (e.g., if the price is expected to rise by 10%, fall by 5%, or remain flat).
Key Features:
Four Configurable SMAs: Set distinct lengths and colors for up to four different SMAs.
Global Price Change Scenario: Input a single percentage (positive, negative, or zero) to simulate future price behavior, which then drives all SMA projections.
Adjustable Projection Horizon: Specify how many future bars to project the SMAs over.
Clear Visuals: Current SMAs are plotted as solid lines, while their future projections are displayed as corresponding dotted lines for easy differentiation.
Important Note (Pine Script v4):
Due to line drawing limitations in Pine Script v4 (max_lines_count=500), when all four SMAs are active, the 'Future Bars to Inspect' input is capped at 126. This ensures the script functions correctly within platform limits (drawing 125 segments * 4 SMAs = 500 lines).
Use Cases:
Anticipate potential future support and resistance levels based on projected SMA crossovers or positions.
Analyze how different SMAs might behave if the market trends up, down, or sideways by your assumed percentage.
Enhance your technical analysis by adding a forward-looking dimension to your SMA strategy.
This script is an extension of an idea by vladimir.kamba, modified to support four SMAs and provide future projections.

HAHAHAThe "ICT Killzones + Macros" indicator is a comprehensive market structure and session visualizer built for day traders and ICT (Inner Circle Trader) method followers. It plots key session zones, previous highs/lows, and macro time blocks to help identify liquidity zones, entry windows, and price reactions.

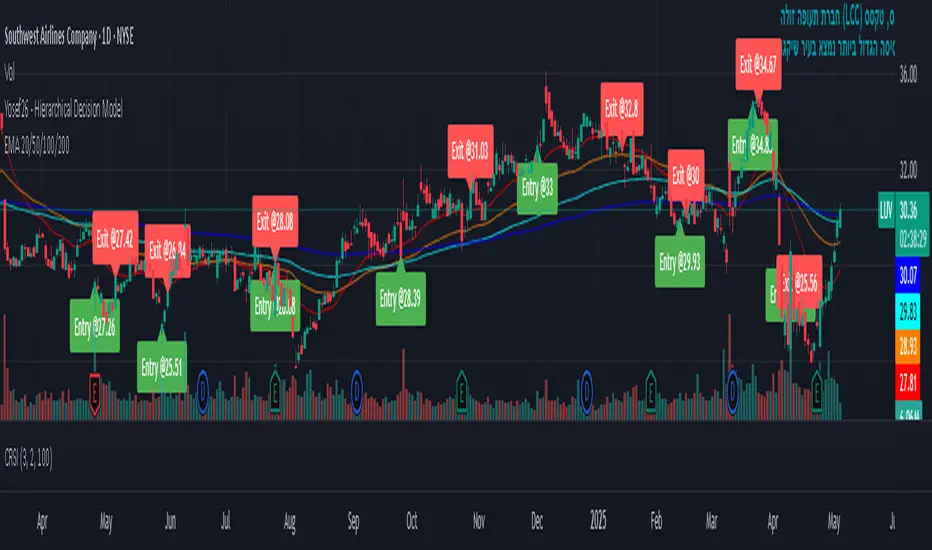
Yosef26 - Hierarchical Decision Model//@version=5
indicator("Yosef26 - Hierarchical Decision Model", overlay=true)
// === Moving Averages ===
ema20 = ta.ema(close, 20)
ema50 = ta.ema(close, 50)
ema100 = ta.ema(close, 100)
// === Candle Components ===
priceRange = high - low
body = math.abs(close - open)
upperWick = high - math.max(close, open)
lowerWick = math.min(close, open) - low
volSMA = ta.sma(volume, 20)
// === Volume Momentum ===
volUp3 = (volume > volume ) and (volume > volume )
// === Candlestick Pattern Detection ===
bullishEngulfing = (close < open ) and (close > open) and (close > open ) and (open < close )
bearishEngulfing = (close > open ) and (close < open) and (close < open ) and (open > close )
doji = body < (priceRange * 0.1)
hammer = (lowerWick > body * 2) and (upperWick < body) and (close > open)
shootingStar = (upperWick > body * 2) and (lowerWick < body) and (close < open)
// === Multi-Timeframe Trend Detection ===
monthlyTrendUp = request.security(syminfo.tickerid, "M", close > ta.sma(close, 50))
weeklyTrendUp = request.security(syminfo.tickerid, "W", close > ta.sma(close, 50))
dailyTrendUp = close > ta.sma(close, 50)
// === Support/Resistance Zones ===
atSupport = low <= ta.lowest(low, 5)
atResistance = high >= ta.highest(high, 5)
// === Breakout Detection ===
breakoutAboveResistance = close > ta.highest(high , 5) and volume > volSMA and close > ema50
// === Confirming Candles ===
twoGreenCandles = (close > open) and (close > open )
twoRedCandles = (close < open) and (close < open )
// === Overextension Filter ===
overbought = close > ema20 * 1.05
// === Entry/Exit Conditions Tracking ===
var int lastEntryBar = na
var int lastExitBar = na
minBarsBetweenEntries = 10
canEnter = na(lastEntryBar) or (bar_index - lastEntryBar >= minBarsBetweenEntries and bar_index - lastExitBar >= minBarsBetweenEntries)
// === Continuation Filter (3 green candles with volume rise) ===
bullContinuation = (close > open) and (close > open ) and (close > open ) and (volume > volume ) and (volume > volume )
// === Entry Price Tracking ===
var float entryPrice = na
// === Weakness After Uptrend for Exit ===
recentGreenTrend = (close > open ) and (close > open ) and (close > open )
reversalCandle = shootingStar or bearishEngulfing or doji
reversalVolumeDrop = (volume < volume ) and (volume < volume )
signalWeakness = recentGreenTrend and reversalCandle and reversalVolumeDrop
// === Scoring System ===
entryScore = 0
entryScore := entryScore + (atSupport ? 3 : 0)
entryScore := entryScore + (bullishEngulfing ? 3 : 0)
entryScore := entryScore + (hammer ? 2 : 0)
entryScore := entryScore + (volUp3 ? 2 : 0)
entryScore := entryScore + ((volume > volSMA) ? 2 : 0)
entryScore := entryScore + ((close > ema20 or close > ema50) ? 1 : 0)
entryScore := entryScore + ((close > close ) ? 1 : 0)
entryScore := entryScore + (breakoutAboveResistance ? 2 : 0)
entryScore := entryScore + (twoGreenCandles ? 1 : 0)
entryScore := entryScore - (overbought ? 2 : 0)
entryScore := entryScore + ((monthlyTrendUp and weeklyTrendUp and dailyTrendUp) ? 2 : 0)
exitScore = 0
exitScore := exitScore + (atResistance ? 3 : 0)
exitScore := exitScore + (bearishEngulfing ? 3 : 0)
exitScore := exitScore + (shootingStar ? 2 : 0)
exitScore := exitScore + (doji ? 1 : 0)
exitScore := exitScore + ((volume < volSMA * 1.1) ? 1 : 0)
exitScore := exitScore + ((close < ema50) ? 1 : 0)
exitScore := exitScore + ((close < close ) ? 1 : 0)
exitScore := exitScore + (twoRedCandles ? 1 : 0)
exitScore := exitScore + ((not dailyTrendUp and not weeklyTrendUp) ? 2 : 0)
exitScore := exitScore + (signalWeakness ? 2 : 0)
// === Profit Target Exit Condition ===
profitTargetHit = not na(entryPrice) and close >= entryPrice * 1.09
profitZoneSignal = (atResistance or shootingStar or bearishEngulfing) and volume > volSMA
isNewHigh = high >= ta.highest(high, 50)
exitAtProfitTarget = profitTargetHit and profitZoneSignal and not isNewHigh
// === Final Decision Thresholds ===
entryCond1 = entryScore >= 8
entryCond2 = entryScore >= 6 and breakoutAboveResistance and volume > volSMA and close > ema50
entryCond3 = monthlyTrendUp and weeklyTrendUp and (close > ema50 or volume > volSMA or twoGreenCandles)
entryCond = (entryCond1 or entryCond2 or entryCond3) and canEnter
exitCondRaw = (exitScore >= 7)
exitCond = (exitCondRaw and not bullContinuation) or exitAtProfitTarget
// === Position Tracking ===
var bool inPosition = false
var int barsInPosition = 0
var label entryLabel = na
var label exitLabel = na
if entryCond and not inPosition
inPosition := true
barsInPosition := 0
lastEntryBar := bar_index
entryPrice := close
entryLabel := label.new(bar_index, close, "Entry @" + str.tostring(close), style=label.style_label_up, color=color.green, textcolor=color.white)
if inPosition
barsInPosition += 1
if exitCond and inPosition
inPosition := false
barsInPosition := 0
lastExitBar := bar_index
exitLabel := label.new(bar_index, close, "Exit @" + str.tostring(close), style=label.style_label_down, color=color.red, textcolor=color.white)
// === Alerts ===
alertcondition(entryCond, title="Entry Alert", message="Yosef26: Entry Signal (Hierarchical Model)")
alertcondition(exitCond, title="Exit Alert", message="Yosef26: Exit Signal (Hierarchical Model)")
AAPL Covered Call + CSP Alerts (Enhanced)This is a work-in-progress tool designed to help identify ideal setups for selling covered calls (CC) and cash-secured puts (CSP) on Apple (AAPL) using price levels, volume confirmation, and moving average context.
📈 What It Does
🔴 CC SELL Alert
Triggers when:
Price breaks above a custom resistance level
A volume spike confirms momentum
Designed to catch strong upside pushes where call premiums are rich.
🟠 CC WATCH Alert
Triggers when:
Price is near the 200-day MA
Volume is elevated but there’s no breakout yet
A pre-alert to watch for potential call-selling setups near resistance.
🟢 CSP BUY Alert
Triggers when:
Price drops below a custom support level
A volume flush signals potential short-term capitulation
Meant to time CSP entries when downside panic sets in.
⚙️ Adjustable Settings
Input Description
ccPriceTrigger Resistance level to trigger CC SELL
ccVolumeMultiplier Volume threshold for CC confirmation
maProximityBuffer Distance from 200 MA to trigger WATCH
cspSupportLevel Support level to trigger CSP BUY
cspVolumeMultiplier Volume threshold for CSP confirmation
🧭 Timeframe + Expiration Guidelines
Timeframe Use Case Recommended Option Expirations
1H Primary strategy view 21–30 days to expiration
15m Scalping / fast alerts 7–14 DTE (more sensitive)
Daily Swing or macro setups 30–45+ DTE for stability
📣 Alerts (How-To)
This script supports TradingView alerts — just right-click any chart and choose:
"Add Alert" → Select one of the following conditions:
"AAPL CC SELL Alert"
→ Triggers when breakout and volume spike align
"AAPL CC WATCH Alert"
→ Triggers when price approaches 200 MA with volume
"AAPL CSP Alert"
→ Triggers when support breaks with high volume
These alerts are great for traders who want real-time notification when premium-selling setups form — whether you're at your desk or mobile.
🧠 Strategy Context
Built after months of active trading on AAPL, this script distills real trading lessons from volume-based breakouts and support flushes into a signal system for timing covered call and CSP entries. We found these triggers especially reliable when paired with option delta targeting and open interest zones.
Feel free to clone, fork, or improve. Suggestions welcome — this is a living tool.

High Probability FVG Detector (MTF)Utilizes the logic behind why Fair Value Gaps exist in the first place; momentum leaving orders partially filled, therefore leaving resting liquidity that still needs to be filled. The more orders remaining, the higher the likelihood of price revisiting. However, there are high quality fair value gaps and low quality fair value gaps. High quality FVG's (the one's most likely to act as support/resistance) would likely be formed during high liquidity. This creates a more volume saturated zone. Saturation meaning remaining orders at each tick level, or as close as possible. Low quality FVG's would be one's formed during low liquidity, which price movement range is more related to gaps in the order book (thin ladder) rather than volume based momentum. Due to the limitations of Pine Script I don't have access to DOM/Order Book functionality but this indicator will make use of volume. Here is the executive summary:
FVG Detection: It scans the price action for the specific three-candle pattern that defines a bullish or bearish FVG.
Multi-Timeframe (MTF) Capability: It allows you to detect FVGs on a timeframe different from the one currently displayed on your chart (e.g., find 1-hour FVGs while looking at a 5-minute chart).
Probability Filtering: It attempts to classify FVGs based on the conditions during their formation.
Volume Filter: Checks if the FVG was formed with volume significantly higher than average (indicating strong participation).
Candle Range Filter: Checks if the FVG was formed by a candle with a significantly larger range than average (using ATR, indicating strong momentum/volatility).
Differentiated Coloring: It visually distinguishes between different types of FVGs using different colors.
High Probability: FVGs that meet the enabled Volume and/or Range filter criteria.
Low Volume: FVGs that specifically fail the Volume filter (when enabled), potentially indicating weaker conviction.
Regular: FVGs that don't meet any specific filter criteria (if the option to show them is enabled).
Mitigation Tracking: It monitors if the price later trades back into the identified FVG zone (based on either the wick touching or the body closing within the zone, selectable by the user) and changes the color of the FVG box once this happens.
Visual Display: It draws colored boxes representing the price range of the FVGs, optionally extending unmitigated boxes into the future for easy visibility.
In essence, the indicator aims to automate the detection of these price inefficiencies, filter them based on volume and momentum characteristics, and track when they are revisited by price, providing traders with visual cues about potentially significant support/resistance zones and/or target zones for trading into.

Buy/Sell Signal - RSI + EMA + MACDSignal 'Buy' if all of the following three conditions are true
Rsi crosses above 55
Ema 9 crosses over ema 21
Macd histogram shows second green on
Signal 'Sell' if all of the following three conditions are true
Rsi crosses below 45
Ema 9 crosses below Ema 21
Macd histogram shows second red on

ICT Killzones + Macros [TakingProphets]The "ICT Killzones + Macros" indicator is a comprehensive market structure and session visualizer built for day traders and ICT (Inner Circle Trader) method followers. It plots key session zones, previous highs/lows, and macro time blocks to help identify liquidity zones, entry windows, and price reactions.

RSI + RSI MA + Choppiness IndexThe indicator is an extension of the Chopiness & RSI Index but takes it one step further by adding the RSI based MA .
Strong uptrend occurs when the RSI is at least 15% above the RSI based MA and the choppiness index value is below the RSI based MA.
Strong downtrend occurs when the Choppiness index line is at least 15% above the RSI based MA and the RSI is below the RSI based MA.
When both the RSI and Chopiness index are above the RSI based MA, this can mean either an uptrend or approaching downtrend.
When both the RSI and Chopiness index are below the RSI based MA, this can mean either an downtrend or approaching uptrend.
*Use at own risk.

Model+ - Trendlines & S/R//@version=5
indicator("Model+ - Trendlines & S/R", overlay=true)
// === Parameters ===
length = input.int(20, title="Pivot Length")
lookback = input.int(252, title="Lookback Period (trading days ~ 1 year)", minval=1, maxval=5000)
minTouches = input.int(2, title="Minimum Touches for Valid S/R")
maxLines = input.int(15, title="Max Lines")
tolerance = input.float(1.5, title="Price Tolerance for S/R Match")
// === Arrays to Store Pivot Points ===
var line supportLines = array.new_line()
var line resistanceLines = array.new_line()
var float supportLevels = array.new_float()
var float resistanceLevels = array.new_float()
// === Function to Check Pivot High ===
isPivotHigh(src, len, idx) =>
idxValid = idx - len >= 0 and idx + len < bar_index and idx < 5000
result = true
if idxValid
for j = 1 to len
result := result and src > src and src > src
else
result := false
result
// === Function to Check Pivot Low ===
isPivotLow(src, len, idx) =>
idxValid = idx - len >= 0 and idx + len < bar_index and idx < 5000
result = true
if idxValid
for j = 1 to len
result := result and src < src and src < src
else
result := false
result
// === Helper Function: Count Nearby Pivots ===
countTouches(src, level, lookbackBars) =>
count = 0
maxBack = math.min(lookbackBars, bar_index)
for j = 0 to maxBack - 1
if math.abs(src - level) <= tolerance
count := count + 1
count
// === Loop Over Past Bars to Find S/R Levels ===
startIdx = math.max(length, bar_index - math.min(lookback, 4500))
endIdx = bar_index - length
if bar_index > startIdx + length
for i = startIdx to endIdx by 1
if isPivotHigh(high, length, i)
lvl = high
touches = countTouches(high, lvl, lookback)
if touches >= minTouches
l = line.new(x1=i, y1=lvl, x2=bar_index, y2=lvl, color=color.red, width=1)
array.push(resistanceLines, l)
array.push(resistanceLevels, lvl)
if isPivotLow(low, length, i)
lvl = low
touches = countTouches(low, lvl, lookback)
if touches >= minTouches
l = line.new(x1=i, y1=lvl, x2=bar_index, y2=lvl, color=color.green, width=1)
array.push(supportLines, l)
array.push(supportLevels, lvl)
// === Clean Up Old Lines ===
while array.size(resistanceLines) > maxLines
line.delete(array.shift(resistanceLines))
array.shift(resistanceLevels)
while array.size(supportLines) > maxLines
line.delete(array.shift(supportLines))
array.shift(supportLevels)

Black Candle - First Sell/Buy Signalthis indicator gives you signals to buy and sell with high accuracy.
