Short Below 20 EMA with Exit Above Prior High - 15 Minshort trade strategy when price comes below 20 ema
Chart patterns

1m Confirmation: EMA20 + QQE + Vol Spike by RalpinoyThis is a “confirmation” indicator for 1-minute scalping. We created to assure us before entering a trade.
It fires a ✅ long arrow when all three line up:
Trend: price is above the 20-period EMA
Momentum: QQE histogram is above zero
Volume: current bar’s volume > 1.5× its 20-bar SMA
A ❌ short arrow shows when the inverse conditions are met.
Guys you may use this and drop it onto your 1 min chart and adjust the multipliers to taste.
How to use:
Add this as a single indicator on your 1 min chart.
Watch for the ✅/❌ arrows to mark “all-clear” entries.
You can hook the built-in alerts to get pinged exactly when those arrows appear.
Feel free to tweak the QQE multiplier, volume multiplier or even swap in your preferred momentum calc. Happy scalping!

Gap-Up and Gap-Down Screenerreate Screener at Trading View :Criteria: AS on Date Indian Stock Market Timing: 9:05 AM to 3:34 PM
To find stocks that have opened with a gap-up or gap-down in the last 7 days, follow these steps:
Criteria:
1. Gap-up: When the stock opens 0.7% or more higher than the previous day's close.
2. Gap-down: When the stock opens 0.7% or more lower than the previous day's close.

EU vs GU Strength @smEURUSD vs GBPUSD Strength Tester
✅ What it does:
-Plots EURUSD change (blue line)
-Plot GBPUSD change (green line)
-Plots EURGBP change (orange line)
Background turns bluish if EUR is stronger, greenish if GBP is stronger!
So, just by watching the background color, you can immediately tell:
If you prefer EURUSD or GBPUSD for your long/short setup.

BTST By ANTThe BTST Indicator is a powerful tool specifically designed for traders in the Indian stock market. This unique indicator identifies and highlights key price movements at a pivotal time—3:15 PM. This time is crucial for making BTST (Buy Today, Sell Tomorrow) decisions, a popular trading strategy in India.
Key Features:
Gap Identification : The indicator detects whether the current price action represents a gap-up or gap-down situation compared to the Heikinashi candle close price. This information is vital for short-term traders looking to capitalize on price momentum.
Visual Alerts : When a gap-up trend is detected, a green label "Gap Up" is displayed above the relevant bar. Similarly, a red label "Gap Down" appears below the bar for gap-down movements. These visual indicators help traders make quick and informed decisions.
User-Friendly Insights: The BTST Indicator provides vital information about last closed prices and the dynamics between normal candles and Heikinashi candles. With detailed logs, users can see the exact conditions leading to buy or sell signals, helping optimize trading strategies.
Why Use the BTST Indicator?
Timeliness: The focus on the 3:15 PM mark aligns perfectly with trading patterns and market behavior specific to the Indian stock market, making it an invaluable addition to your trading arsenal.
Enhanced Decision-Making: By receiving immediate visual cues on significant price movements, traders can execute their BTST strategies with greater confidence and speed.
Designed for Indian Markets: This indicator caters specifically to the nuances of Indian stock trading, ensuring relevance and effectiveness for local traders.
Start utilizing the BTST Indicator today to enhance your trading strategies and position yourself for successful trades in the Indian stock market!

Pmax + T3Pmax + T3 is a versatile hybrid trend-momentum indicator that overlays two complementary systems on your price chart:
1. Pmax (EMA & ATR “Risk” Zones)
Calculates two exponential moving averages (Fast EMA & Slow EMA) and plots them to gauge trend direction.
Highlights “risk zones” behind price as a colored background:
Green when Fast EMA > Slow EMA (up-trend)
Red when Fast EMA < Slow EMA (down-trend)
Yellow when EMAs are close (“flat” zone), helping you avoid choppy markets.
You can toggle risk-zone highlighting on/off, plus choose to ignore signals in the yellow (neutral) zone.
2. T3 (Triple-Smoothed EMA Momentum)
Applies three sequential EMA smoothing (the classic “T3” algorithm) to your chosen source (usually close).
Fills the area between successive T3 curves with up/down colors for a clear visual of momentum shifts.
Optional neon-glow styling (outer, mid, inner glows) in customizable widths and transparencies for a striking “cyber” look.
You can highlight T3 movements only when the line is rising (green) or falling (red), or disable movement coloring.

CISD [TakingProphets]🧠 Indicator Purpose:
The "CISD - Change in State of Delivery" is a precision tool designed for traders utilizing ICT (Inner Circle Trader) conecpets. It detects critical shifts in delivery conditions after liquidity sweeps — helping you spot true smart money activity and optimal trade opportunities. This script is especially valuable for traders applying liquidity concepts, displacement recognition, and market structure shifts at both intraday and swing levels.
🌟 What Makes This Indicator Unique:
Unlike basic trend-following or scalping tools, CISD operates through a two-phase smart money logic:
Liquidity Sweep Detection (sweeping Buyside or Sellside Liquidity).
State of Delivery Change Identification (through bearish or bullish displacement after the sweep).
It intelligently tracks candle sequences and only signals a CISD event after true displacement — offering a much deeper context than ordinary indicators.
⚙️ How the Indicator Works:
Swing Point Detection: Identifies recent pivot highs/lows to map Buyside Liquidity (BSL) and Sellside Liquidity (SSL) zones.
Liquidity Sweeps: Watches for price breaches of these liquidity points to detect institutional stop hunts.
Sequence Recognition: Finds series of same-direction candles before sweeps to mark institutional accumulation/distribution.
Change of Delivery Confirmation: Confirms CISD only after significant displacement moves price against the initial candle sequence.
Visual Markings: Automatically plots CISD lines and optional labels, customizable in color, style, and size.
🎯 How to Use It:
Identify Liquidity Sweeps: Watch for CISD levels plotted after a liquidity sweep event.
Plan Entries: Look for retracements into CISD lines for high-probability entries.
Manage Risk: Use CISD levels to refine your stop-loss and profit-taking zones.
Best Application:
After stop hunts during Killzones (London Open, New York AM).
As part of the Flow State Model: identify higher timeframe PD Arrays ➔ wait for lower timeframe CISD confirmation.
🔎 Underlying Concepts:
Liquidity Pools: Highs and lows cluster stop orders, attracting institutional sweeps.
Displacement: Powerful price moves post-sweep confirm smart money involvement.
Market Structure: CISD frequently precedes major Change of Character (CHoCH) or Break of Structure (BOS) shifts.
🎨 Customization Options:
Adjustable line color, width, and style (solid, dashed, dotted).
Optional label display with customizable color and sizing.
Line extension settings to keep CISD zones visible for future reference.
✅ Recommended for:
Traders studying ICT Smart Money Concepts.
Intraday scalpers and higher timeframe swing traders.
Traders who want to improve entries around liquidity sweeps and institutional displacement moves.
🚀 Bonus Tip:
For maximum confluence, pair this with the HTF POI, ICT Liquidity Levels, and HTF Market Structure indicators available at TakingProphets.com! 🔥


V3 Theonator Bank Volume Entry & Exitsnipe the huz out of the banks like tralala leo trlala like this indicator is fine shi liek fr

Theonator Bank Volume Entry & Exit v2best of the best im telling you liek this shit slapps the bank in the head

1-Hour Candlestick Patterns on 15m Chartplots 1 hour candlesticks on lower timeframe so there is no need to jump from higher time frame to lower time frame.

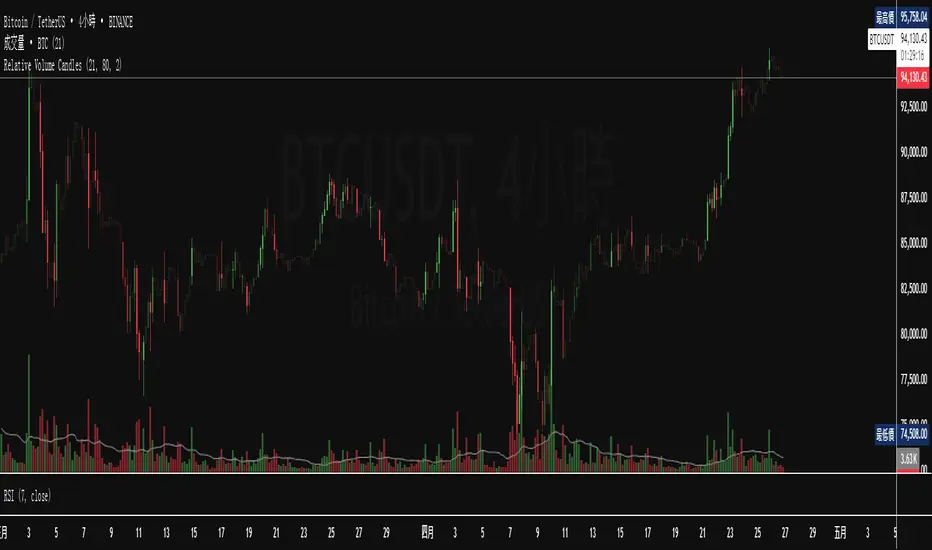
Relative Volume CandlesVisualizes candlesticks with transparency based on volume relative to a moving average. Higher-than-average volume makes candles more opaque, while lower volume increases transparency—helping you spot significant price movements at a glance!
Features:
Customizable up/down candle colors (default: green/red)
Adjustable lookback period for volume averaging (default: 21)
Fine-tune transparency with base transparency (default: 80) and scale (default: 2.0)
Overlay directly on your chart for seamless analysis
Real Relative Strength vs SPY (Clean Visual)This indicator plots Real Relative Strength/Weakness (RS/RW) of any stock relative to SPY, normalised by ATR. Designed to aid trading aligned to RDT philosophy.
Designed for intraday and swing traders to quickly identify stocks showing true institutional strength or weakness compared to the market.
Uses a clean, color-coded center-line display for fast reading of live RS/RW performance.
It automatically syncs to whatever timeframe you’re trading (5min, 15min, 1hr)
Default comparison ticker is SPY (you can easily swap if needed later)
Length = 12 by default → (rolling 1-hour window on M5 chart)
Clean green/red visual breakout = immediately obvious relative strength or weakness!
How to use
Strong Green move above zero ➔ RS developing ➔ Long bias
Strong Red move below zero ➔ RW developing ➔ Short bias
Choppy around zero ➔ No clear edge ➔ maybe avoid that stock

Crypto EMA TableCrypto EMA Trend Scanner
A powerful tool for crypto traders to quickly identify trend strength across multiple timeframes
This indicator helps you spot potential trading opportunities by analyzing the EMA (Exponential Moving Average) alignment across four different timeframes. It displays a clean, color-coded table showing which cryptocurrencies are in a strong uptrend.
Key Features:
Multi-Timeframe Analysis: Simultaneously scan 3-minute, 15-minute, 1-hour, and 4-hour charts
Clear Visual Signals: Green cells indicate bullish EMA alignment (EMA 20 > EMA 50 > EMA 200)
Customizable Symbols: Track up to 3 different cryptocurrencies of your choice
Exchange Selection: Compatible with major exchanges (Bybit, Binance, Coinbase, Kraken, KuCoin, FTX)
Flexible Positioning: Place the table anywhere on your chart
How to Use:
Add the indicator to your chart
Select your preferred cryptocurrencies in the settings
Position the table where you want it
Look for green cells indicating EMA lineup.
Use this information to identify potential entry points or confirm your trading bias

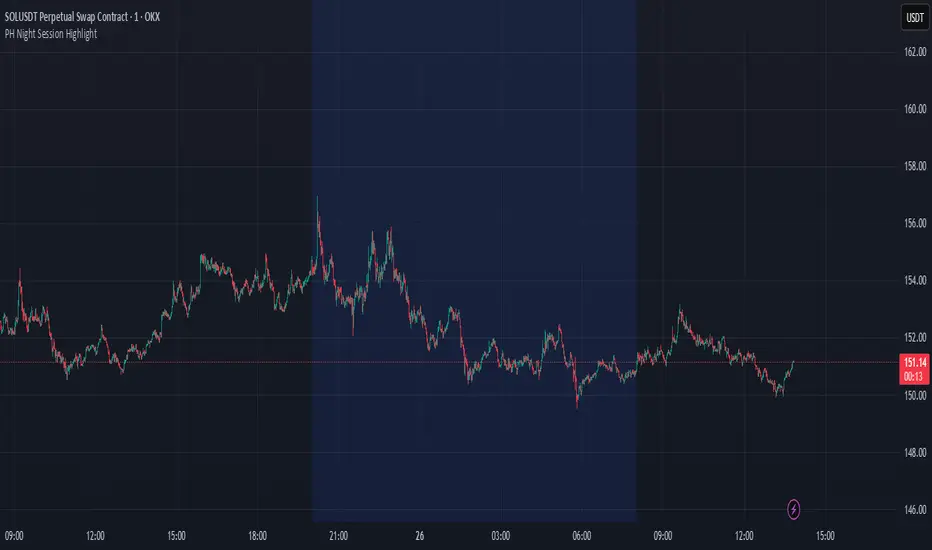
PH Night Session HighlightTraders who want to visually separate the night session on their charts. It highlights the period from 8:01 PM to 7:59 AM (Philippine Time), making it easy to distinguish off-hours or pre-market activity, especially when analyzing crypto or 24/7 markets.
The script automatically adjusts server time (UTC) to Philippine Time (UTC+8) and overlays a soft blue background during the specified time window.
Price Flip StrategyPrice Flip Strategy with User-Defined Ticker Max/Max
This strategy leverages an inverted price calculation based on user-defined maximum and minimum price levels over customizable lookback periods. It generates buy and sell signals by comparing the previous bar's original price to the inverted price, within a specified date range. The script plots key metrics, including ticker max/min, original and inverted prices, moving averages, and HLCC4 averages, with customizable visibility toggles and labels for easy analysis.
Key Features:
Customizable Inputs: Set lookback periods for ticker max/min, moving average length, and date range for signal generation.
Inverted Price Logic: Calculates an inverted price using ticker max/min to identify trading opportunities.
Flexible Visualization: Toggle visibility for plots (e.g., ticker max/min, prices, moving averages, HLCC4 averages) and last-bar labels with user-defined colors and sizes.
Trading Signals: Generates buy signals when the previous original price exceeds the inverted price, and sell signals when it falls below, with alerts for real-time notifications.
Labeling: Displays values on the last bar for all plotted metrics, aiding in quick reference.
How to Use:
Add to Chart: Apply the script to a TradingView chart via the Pine Editor.
Configure Settings:
Date Range: Set the start and end dates to define the active trading period.
Ticker Levels: Adjust the lookback periods for calculating ticker max and min (e.g., 100 bars for max, 100 for min).
Moving Averages: Set the length for exponential moving averages (default: 20 bars).
Plots and Labels: Enable/disable specific plots (e.g., Inverted Price, Original HLCC4) and customize label colors/sizes for clarity.
Interpret Signals:
Buy Signal: Triggered when the previous close price is above the inverted price; marked with an upward label.
Sell Signal: Triggered when the previous close price is below the inverted price; marked with a downward label.
Set Alerts: Use the built-in alert conditions to receive notifications for buy/sell signals.
Analyze Plots: Review plotted lines (e.g., ticker max/min, HLCC4 averages) and last-bar labels to assess price behavior.
Tips:
Use in trending markets by enabling ticker max for uptrends or ticker min for downtrends, as indicated in tooltips.
Adjust the label offset to prevent overlapping text on the last bar.
Test the strategy on a demo account to optimize lookback periods and moving average settings for your asset.
Disclaimer: This script is for educational purposes and should be tested thoroughly before use in live trading. Past performance is not indicative of future results.

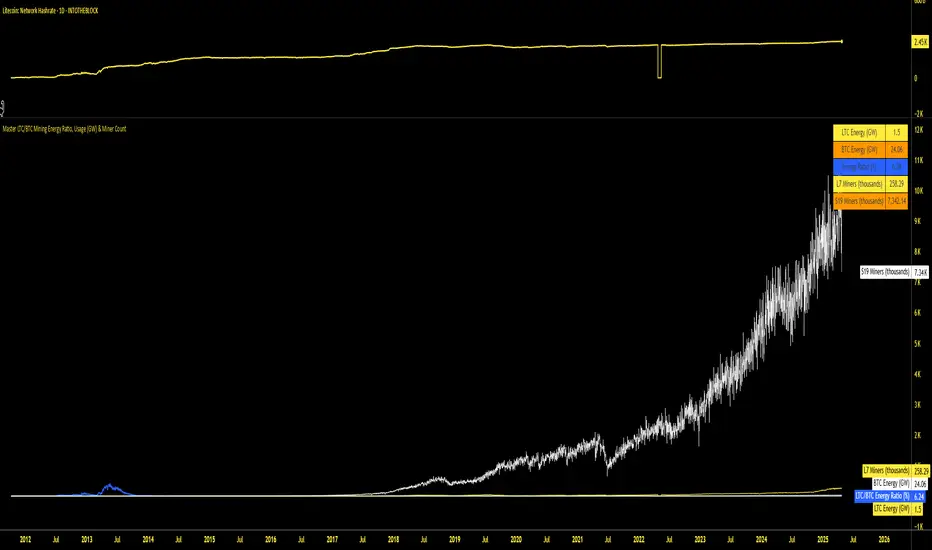
Master LTC/BTC Mining Energy Ratio, Usage (GW) & Miner CountThis Pine Script indicator, "Master LTC/BTC Mining Energy Ratio, Usage (GW) & Miner Count," calculates and visualizes key metrics for Litecoin (LTC) and Bitcoin (BTC) mining operations. Using IntoTheBlock hashrate data, it estimates the number of L7 (LTC) and S19 (BTC) miners, computes energy consumption in gigawatts (GW) based on calibrated efficiency values, and derives the LTC/BTC energy ratio as a percentage. The script plots these metrics—energy ratio, LTC/BTC energy usage, and miner counts (in thousands)—and displays a concise table summarizing the results. Assuming most miners use previous-generation hardware, it provides a clear comparison of the energy dynamics between LTC’s Scrypt and BTC’s SHA-256 algorithms.
NR4/NR7 + Trend + MACD + VWAP FilterThe Ultimate Momentum-Compression Strategy
This strategy merges the power of price compression and trend confirmation, ensuring you're trading when the market is coiled and ready to move. By combining multiple filters—NR4/NR7, trend alignment, MACD momentum, and VWAP support—this setup identifies high-probability trade opportunities in dynamic, trending stocks. Here's how it works:
NR4/NR7 Patterns: These are narrow-range days where the current price range is smaller than the previous 4 or 7 days. This signals potential breakout or continuation setups, as the market is compressing before making a move.
Trend Confirmation: To ensure you're not trading against the current trend, the price must be above the 20 EMA, and the 10 EMA must be above the 20 EMA. This confirms a bullish structure, with the price trending in your favour.
MACD Momentum: The fast MACD line must be above the slow MACD line, confirming the trend is not only intact but also gaining momentum.
VWAP Filter: Price must be above the VWAP (Volume Weighted Average Price). This is the final confirmation that the market is in a strong, bullish phase, with buyers dominating the market.
By requiring all these conditions to align, this strategy takes the guesswork out of day trading. It ensures you're trading within a well-established trend, with compression patterns and momentum backing your trade. The result? You’re entering positions with confidence and clarity, poised to ride strong, sustained moves.
This strategy is for the trader who values both flexibility and discipline—able to capture dynamic moves while staying aligned with market structure and momentum. It’s a refined, systematic approach that makes decisions clear, without the emotional second-guessing.

SPY 0DTE Scalper - Auto AlertsTimeframes:
Main chart: 1-minute (for precision entries)
Confirmations: 3-minute or 5-minute (to avoid fakeouts)
Indicators I Use:
VWAP – Orange line → Institutional fair value
EMA 9 – Green line → Short-term momentum
EMA 21 – Red line → Trend filter
Custom Pullback Signal Script – Marks buy/sell/pullback signals with labels (triangles)
Above VWAP = Bullish Bias
Below VWAP = Bearish Bias
Institutions treat this as the "fair price" — so I do too.
EMA 9 (Green):
If price hugs or bounces off EMA 9 = 🔥 strong continuation move.
I use this as my guide for momentum.
EMA 21 (Red):
Great for trend confirmation.
Above EMA 21 = Trend building to the upside.
Below EMA 21 = Weakness or possible reversal.
💸 Step 3: How I Read the Signals
✅ BUY Signal:
Price breaks above VWAP with volume 1.5x+ average
Candle must close strong (not a wickfest)
EMA 9 becomes my trailing stop for the move
🚨 SELL Signal:
Price breaks below VWAP with strong volume
Clean body close below → momentum shift to the downside
EMA 9 again = trailing resistance guide
🔵 Pullback Long (Blue Triangle Under Candle):
Bullish continuation entry
Price pulls back to EMA 9 or 21, but stays above VWAP
Low-risk re-entry after a breakout
🟣 Pullback Short (Purple Triangle Above Candle):
Bearish continuation entry
Price retraces into EMA 9, but stays below VWAP & EMA 21
Ideal for catching second legs after breakdowns

Whale Psychology Insights
### 🧠 Whale Psychology Insights – Unmasking Smart Money Moves
**Understand the mind games behind every candle.**
This advanced indicator is designed to reveal the psychological warfare played by whales and market manipulators in the crypto space. Stop trading blind—start trading with the insights of the smart money.
#### 🔍 What It Does:
- **Liquidity Zone Detection** – Automatically identifies key **swing highs/lows** where stop hunts are likely.
- **Volume Spike Alerts** – Spot **suspicious activity** where big players enter or exit.
- **Order Block Zones** – Highlights **bullish/bearish engulfing patterns** used by institutions.
- **Fair Value Gaps (FVG)** – Marks price inefficiencies where price may return.
- **Fakeout Detection** – Finds **manipulative wicks** designed to trap retail traders.
#### 💡 Use Cases:
- Avoid getting stopped out by **liquidity grabs**
- Enter after the **whales have made their move**
- Identify **high-probability reversal zones**
- Trade **with smart money**, not against it
Perfect for scalpers, intraday traders, and swing traders looking to understand *why* price moves—not just *where*.
> 🧠 **Trade the psychology, not just the chart.**

2HH2LL [CCE_Charts]Detects the "Two Higher Highs, Two Lower Lows" (2HH2LL) pattern formation and provides strength analysis with trade signals. The indicator displays visual markers, S/R zones, and clear signals for LONG or SHORT positions.
Pattern Description
The 2HH2LL pattern consists of two consecutive higher highs and two consecutive lower lows. This formation can signal potential trend reversals or continuations depending on market context.
Key Features
• Pattern strength analysis using S/R zone and volume confirmation
• Clear LONG or SHORT trade signals
• Visual markers highlighting pattern components
• Support/Resistance zone visualization
• Customizable alerts for real-time notifications
• Detailed information panel
How to Use This Indicator
1. Add the indicator to your chart
2. Configure settings based on your trading style
3. Look for the "2HH2LL" label when a valid pattern forms
4. Check the pattern strength (STRONG, MEDIUM, WEAK)
5. Note the trade direction signal (LONG or SHORT)
6. Verify the pattern with other technical tools
7. Set up alerts for real-time notifications
Settings Guide
Pattern Settings
• Lookback Period: Controls pivot point detection (5-50)
• Minimum Swing Strength: Required percentage change between highs/lows
Confirmation Settings
• S/R Zone Size: Size of support/resistance zone
• Volume Confirmation Threshold: Volume multiple required for confirmation
• Volume Average Period: Bars used for volume average calculation
Visual Settings
• Show H1/H2/L1/L2 Labels: Toggle pattern component labels
• Show S/R Zone: Toggle support/resistance zone display
Signal Settings
• Trade Direction: How trade direction is determined (SHORT, LONG, AUTO)
Alert Settings
• Alert on All Patterns: Trigger alerts for all valid patterns
• Alert on STRONG Patterns Only: Only alert on strong patterns
• Alert on Direction: Filter alerts by trade direction
Pattern Strength Analysis
The indicator classifies pattern strength into three categories:
• STRONG: Both confirmation factors present (S/R test and volume)
• MEDIUM: One confirmation factor present
• WEAK: No confirmation factors present
For best results, use this indicator in combination with other technical tools and always consider the broader market context.

ADR% Extension Levels from SMA 50I created this indicator inspired by RealSimpleAriel (a swing trader I recommend following on X) who does not buy stocks extended beyond 4 ADR% from the 50 SMA and uses extensions from the 50 SMA at 7-8-9-10-11-12-13 ADR% to take profits with a 20% position trimming.
RealSimpleAriel's strategy (as I understood it):
-> Focuses on leading stocks from leading groups and industries, i.e., those that have grown the most in the last 1-3-6 months (see on Finviz groups and then select sector-industry).
-> Targets stocks with the best technical setup for a breakout, above the 200 SMA in a bear market and above both the 50 SMA and 200 SMA in a bull market, selecting those with growing Earnings and Sales.
-> Buys stocks on breakout with a stop loss set at the day's low of the breakout and ensures they are not extended beyond 4 ADR% from the 50 SMA.
-> 3-5 day momentum burst: After a breakout, takes profits by selling 1/2 or 1/3 of the position after a 3-5 day upward move.
-> 20% trimming on extension from the 50 SMA: At 7 ADR% (ADR% calculated over 20 days) extension from the 50 SMA, takes profits by selling 20% of the remaining position. Continues to trim 20% of the remaining position based on the stock price extension from the 50 SMA, calculated using the 20-period ADR%, thus trimming 20% at 8-9-10-11 ADR% extension from the 50 SMA. Upon reaching 12-13 ADR% extension from the 50 SMA, considers the stock overextended, closes the remaining position, and evaluates a short.
-> Trailing stop with ascending SMA: Uses a chosen SMA (10, 20, or 50) as the definitive stop loss for the position, depending on the stock's movement speed (preferring larger SMAs for slower-moving stocks or for long-term theses). If the stock's closing price falls below the chosen SMA, the entire position is closed.
In summary:
-->Buy a breakout using the day's low of the breakout as the stop loss (this stop loss is the most critical).
--> Do not buy stocks extended beyond 4 ADR% from the 50 SMA.
--> Sell 1/2 or 1/3 of the position after 3-5 days of upward movement.
--> Trim 20% of the position at each 7-8-9-10-11-12-13 ADR% extension from the 50 SMA.
--> Close the entire position if the breakout fails and the day's low of the breakout is reached.
--> Close the entire position if the price, during the rise, falls below a chosen SMA (10, 20, or 50, depending on your preference).
--> Definitively close the position if it reaches 12-13 ADR% extension from the 50 SMA.
I used Grok from X to create this indicator. I am not a programmer, but based on the ADR% I use, it works.
Below is Grok from X's description of the indicator:
Script Description
The script is a custom indicator for TradingView that displays extension levels based on ADR% relative to the 50-period Simple Moving Average (SMA). Below is a detailed description of its features, structure, and behavior:
1. Purpose of the Indicator
Name: "ADR% Extension Levels from SMA 50".
Objective: Draw horizontal blue lines above and below the 50-period SMA, corresponding to specific ADR% multiples (4, 7, 8, 9, 10, 11, 12, 13). These levels represent potential price extension zones based on the average daily percentage volatility.
Overlay: The indicator is overlaid on the price chart (overlay=true), so the lines and SMA appear directly on the price graph.
2. Configurable Inputs
The indicator allows users to customize parameters through TradingView settings:
SMA Length (smaLength):
Default: 50 periods.
Description: Specifies the number of periods for calculating the Simple Moving Average (SMA). The 50-period SMA serves as the reference point for extension levels.
Constraint: Minimum 1 period.
ADR% Length (adrLength):
Default: 20 periods.
Description: Specifies the number of days to calculate the moving average of the daily high/low ratio, used to determine ADR%.
Constraint: Minimum 1 period.
Scale Factor (scaleFactor):
Default: 1.0.
Description: An optional multiplier to adjust the distance of extension levels from the SMA. Useful if levels are too close or too far due to an overly small or large ADR%.
Constraint: Minimum 0.1, increments of 0.1.
Tooltip: "Adjust if levels are too close or far from SMA".
3. Main Calculations
50-period SMA:
Calculated with ta.sma(close, smaLength) using the closing price (close).
Serves as the central line around which extension levels are drawn.
ADR% (Average Daily Range Percentage):
Formula: 100 * (ta.sma(dhigh / dlow, adrLength) - 1).
Details:
dhigh and dlow are the daily high and low prices, obtained via request.security(syminfo.tickerid, "D", high/low) to ensure data is daily-based, regardless of the chart's timeframe.
The dhigh / dlow ratio represents the daily percentage change.
The simple moving average (ta.sma) of this ratio over 20 days (adrLength) is subtracted by 1 and multiplied by 100 to obtain ADR% as a percentage.
The result is multiplied by scaleFactor for manual adjustments.
Extension Levels:
Defined as ADR% multiples: 4, 7, 8, 9, 10, 11, 12, 13.
Stored in an array (levels) for easy iteration.
For each level, prices above and below the SMA are calculated as:
Above: sma50 * (1 + (level * adrPercent / 100))
Below: sma50 * (1 - (level * adrPercent / 100))
These represent price levels corresponding to a percentage change from the SMA equal to level * ADR%.
4. Visualization
Horizontal Blue Lines:
For each level (4, 7, 8, 9, 10, 11, 12, 13 ADR%), two lines are drawn:
One above the SMA (e.g., +4 ADR%).
One below the SMA (e.g., -4 ADR%).
Color: Blue (color.blue).
Style: Solid (style=line.style_solid).
Management:
Each level has dedicated variables for upper and lower lines (e.g., upperLine1, lowerLine1 for 4 ADR%).
Previous lines are deleted with line.delete before drawing new ones to avoid overlaps.
Lines are updated at each bar with line.new(bar_index , level, bar_index, level), covering the range from the previous bar to the current one.
Labels:
Displayed only on the last bar (barstate.islast) to avoid clutter.
For each level, two labels:
Above: E.g., "4 ADR%", positioned above the upper line (style=label.style_label_down).
Below: E.g., "-4 ADR%", positioned below the lower line (style=label.style_label_up).
Color: Blue background, white text.
50-period SMA:
Drawn as a gray line (color.gray) for visual reference.
Diagnostics:
ADR% Plot: ADR% is plotted in the status line (orange, histogram style) to verify the value.
ADR% Label: A label on the last bar near the SMA shows the exact ADR% value (e.g., "ADR%: 2.34%"), with a gray background and white text.
5. Behavior
Dynamic Updating:
Lines update with each new bar to reflect new SMA 50 and ADR% values.
Since ADR% uses daily data ("D"), it remains constant within the same day but changes day-to-day.
Visibility Across All Bars:
Lines are drawn on every bar, not just the last one, ensuring visibility on historical data as well.
Adaptability:
The scaleFactor allows level adjustments if ADR% is too small (e.g., for low-volatility symbols) or too large (e.g., for cryptocurrencies).
Compatibility:
Works on any timeframe since ADR% is calculated from daily data.
Suitable for symbols with varying volatility (e.g., stocks, forex, cryptocurrencies).
6. Intended Use
Technical Analysis: Extension levels represent significant price zones based on average daily volatility. They can be used to:
Identify potential price targets (e.g., take profit at +7 ADR%).
Assess support/resistance zones (e.g., -4 ADR% as support).
Measure price extension relative to the 50 SMA.
Trading: Useful for strategies based on breakouts or mean reversion, where ADR% levels indicate reversal or continuation points.
Debugging: Labels and ADR% plot help verify that values align with the symbol’s volatility.
7. Limitations
Dependence on Daily Data: ADR% is based on daily dhigh/dlow, so it may not reflect intraday volatility on short timeframes (e.g., 1 minute).
Extreme ADR% Values: For low-volatility symbols (e.g., bonds) or high-volatility symbols (e.g., meme stocks), ADR% may require adjustments via scaleFactor.
Graphical Load: Drawing 16 lines (8 upper, 8 lower) on every bar may slow the chart for very long historical periods, though line management is optimized.
ADR% Formula: The formula 100 * (sma(dhigh/dlow, Length) - 1) may produce different values compared to other ADR% definitions (e.g., (high - low) / close * 100), so users should be aware of the context.
8. Visual Example
On a chart of a stock like TSLA (daily timeframe):
The 50 SMA is a gray line tracking the average trend.
Assuming an ADR% of 3%:
At +4 ADR% (12%), a blue line appears at sma50 * 1.12.
At -4 ADR% (-12%), a blue line appears at sma50 * 0.88.
Other lines appear at ±7, ±8, ±9, ±10, ±11, ±12, ±13 ADR%.
On the last bar, labels show "4 ADR%", "-4 ADR%", etc., and a gray label shows "ADR%: 3.00%".
ADR% is visible in the status line as an orange histogram.
9. Code: Technical Structure
Language: Pine Script @version=5.
Inputs: Three configurable parameters (smaLength, adrLength, scaleFactor).
Calculations:
SMA: ta.sma(close, smaLength).
ADR%: 100 * (ta.sma(dhigh / dlow, adrLength) - 1) * scaleFactor.
Levels: sma50 * (1 ± (level * adrPercent / 100)).
Graphics:
Lines: Created with line.new, deleted with line.delete to avoid overlaps.
Labels: Created with label.new only on the last bar.
Plots: plot(sma50) for the SMA, plot(adrPercent) for debugging.
Optimization: Uses dedicated variables for each line (e.g., upperLine1, lowerLine1) for clear management and to respect TradingView’s graphical object limits.
10. Possible Improvements
Option to show lines only on the last bar: Would reduce visual clutter.
Customizable line styles: Allow users to choose color or style (e.g., dashed).
Alert for anomalous ADR%: A message if ADR% is too small or large.
Dynamic levels: Allow users to specify ADR% multiples via input.
Optimization for short timeframes: Adapt ADR% for intraday timeframes.
Conclusion
The script creates a visual indicator that helps traders identify price extension levels based on daily volatility (ADR%) relative to the 50 SMA. It is robust, configurable, and includes debugging tools (ADR% plot and labels) to verify values. The ADR% formula based on dhigh/dlow

Wyckoff Accumulation Distribution Wyckoff Accumulation & Distribution Indicator (RSI-Based)
This Pine Script is a technical analysis indicator built around the Wyckoff Method, designed to detect accumulation and distribution phases using RSI (Relative Strength Index) and pivot points. It automatically marks key structural turning points on the chart and highlights relevant zones with colored boxes.
What Does It Do?
Draws accumulation and distribution boxes based on RSI behavior.
Automatically detects Wyckoff structural signals:
SC (Selling Climax)
AR (Automatic Rally)
ST (Secondary Test)
BC (Buying Climax)
DAR (Automatic Reaction)
DST (Secondary Test - Distribution)
Identifies trend transitions by detecting sideways RSI movement.
Attempts to detect spring and UTAD-like deviations based on RSI reversals.
Uses RSI extremes in conjunction with pivot points to generate Wyckoff signals.
How Does It Work?
RSI Zone: It identifies sideways markets when RSI stays within ±20 of the 50 level (this range is configurable).
Pivot Points: It detects pivot highs/lows that sync with RSI values (pivotLen is adjustable).
Trend Box Drawing:
When RSI exits the sideways zone, the script draws a gray box between the highest high and lowest low within that range.
If RSI breaks upward, the box becomes green (Accumulation); if downward, it becomes red (Distribution).
Wyckoff Structural Points:
SC/BC: Detected when a pivot occurs with RSI below/above a threshold.
AR/DAR: The next opposite pivot after SC or BC.
ST/DST: The next same-direction pivot after AR or DAR.
How to Use It
Works best on 4H or daily charts for more reliable signals. Shorter timeframes may generate noise.
Primarily used for interpreting RSI structures through the lens of Wyckoff methodology.
Box colors help quickly identify market phase:
Green box: Likely Accumulation
Red box: Likely Distribution
Triangular markers show key signals:
SC, AR, ST: Accumulation points
BC, DAR, DST: Distribution points
Use these signals alongside price action to manually interpret Wyckoff phases.
image.binance.vision
image.binance.vision
What Is the Wyckoff Method?
The Wyckoff Method, developed in the 1930s by Richard Wyckoff, is a market analysis approach that focuses on supply and demand dynamics behind price movements.
Wyckoff’s 5 Phases:
Accumulation: Smart money gradually buying at low prices.
Markup: Price begins trending upwards.
Distribution: Smart money selling to retail traders.
Markdown: Downtrend begins as supply outweighs demand.
Re-accumulation / Re-distribution: Trend-continuation phases with consolidations.
This indicator is specifically designed to detect phase 1 (Accumulation) and phase 3 (Distribution).
Extra Notes
Repainting is minimal, as pivots are confirmed using historical candles.
Labels use plotshape for a clean, minimalist visual style.
Other Wyckoff events (like SOS, LPS, UT, UTAD) could be added in future updates.
This script does not generate buy/sell signals; it is meant for structural interpretation.
