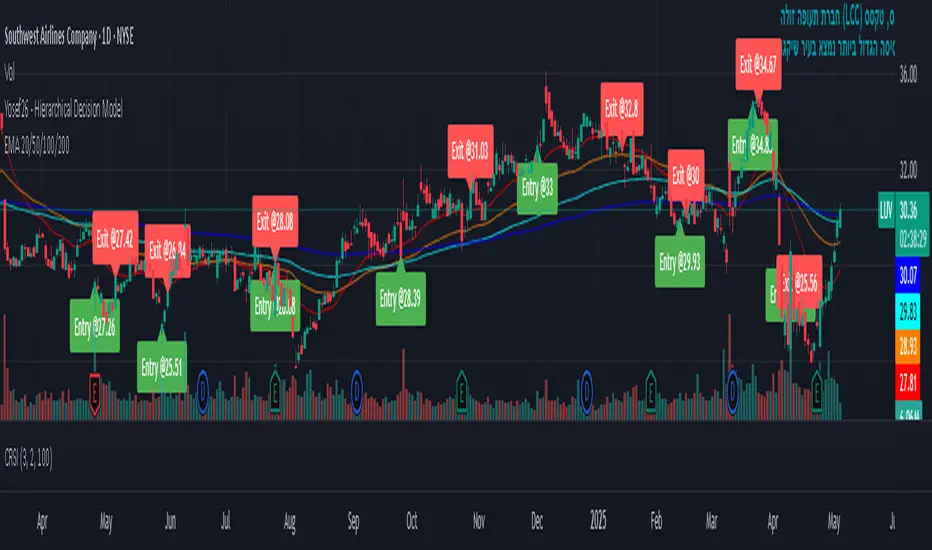
Yosef26 - Hierarchical Decision Model//@version=5
indicator("Yosef26 - Hierarchical Decision Model", overlay=true)
// === Moving Averages ===
ema20 = ta.ema(close, 20)
ema50 = ta.ema(close, 50)
ema100 = ta.ema(close, 100)
// === Candle Components ===
priceRange = high - low
body = math.abs(close - open)
upperWick = high - math.max(close, open)
lowerWick = math.min(close, open) - low
volSMA = ta.sma(volume, 20)
// === Volume Momentum ===
volUp3 = (volume > volume ) and (volume > volume )
// === Candlestick Pattern Detection ===
bullishEngulfing = (close < open ) and (close > open) and (close > open ) and (open < close )
bearishEngulfing = (close > open ) and (close < open) and (close < open ) and (open > close )
doji = body < (priceRange * 0.1)
hammer = (lowerWick > body * 2) and (upperWick < body) and (close > open)
shootingStar = (upperWick > body * 2) and (lowerWick < body) and (close < open)
// === Multi-Timeframe Trend Detection ===
monthlyTrendUp = request.security(syminfo.tickerid, "M", close > ta.sma(close, 50))
weeklyTrendUp = request.security(syminfo.tickerid, "W", close > ta.sma(close, 50))
dailyTrendUp = close > ta.sma(close, 50)
// === Support/Resistance Zones ===
atSupport = low <= ta.lowest(low, 5)
atResistance = high >= ta.highest(high, 5)
// === Breakout Detection ===
breakoutAboveResistance = close > ta.highest(high , 5) and volume > volSMA and close > ema50
// === Confirming Candles ===
twoGreenCandles = (close > open) and (close > open )
twoRedCandles = (close < open) and (close < open )
// === Overextension Filter ===
overbought = close > ema20 * 1.05
// === Entry/Exit Conditions Tracking ===
var int lastEntryBar = na
var int lastExitBar = na
minBarsBetweenEntries = 10
canEnter = na(lastEntryBar) or (bar_index - lastEntryBar >= minBarsBetweenEntries and bar_index - lastExitBar >= minBarsBetweenEntries)
// === Continuation Filter (3 green candles with volume rise) ===
bullContinuation = (close > open) and (close > open ) and (close > open ) and (volume > volume ) and (volume > volume )
// === Entry Price Tracking ===
var float entryPrice = na
// === Weakness After Uptrend for Exit ===
recentGreenTrend = (close > open ) and (close > open ) and (close > open )
reversalCandle = shootingStar or bearishEngulfing or doji
reversalVolumeDrop = (volume < volume ) and (volume < volume )
signalWeakness = recentGreenTrend and reversalCandle and reversalVolumeDrop
// === Scoring System ===
entryScore = 0
entryScore := entryScore + (atSupport ? 3 : 0)
entryScore := entryScore + (bullishEngulfing ? 3 : 0)
entryScore := entryScore + (hammer ? 2 : 0)
entryScore := entryScore + (volUp3 ? 2 : 0)
entryScore := entryScore + ((volume > volSMA) ? 2 : 0)
entryScore := entryScore + ((close > ema20 or close > ema50) ? 1 : 0)
entryScore := entryScore + ((close > close ) ? 1 : 0)
entryScore := entryScore + (breakoutAboveResistance ? 2 : 0)
entryScore := entryScore + (twoGreenCandles ? 1 : 0)
entryScore := entryScore - (overbought ? 2 : 0)
entryScore := entryScore + ((monthlyTrendUp and weeklyTrendUp and dailyTrendUp) ? 2 : 0)
exitScore = 0
exitScore := exitScore + (atResistance ? 3 : 0)
exitScore := exitScore + (bearishEngulfing ? 3 : 0)
exitScore := exitScore + (shootingStar ? 2 : 0)
exitScore := exitScore + (doji ? 1 : 0)
exitScore := exitScore + ((volume < volSMA * 1.1) ? 1 : 0)
exitScore := exitScore + ((close < ema50) ? 1 : 0)
exitScore := exitScore + ((close < close ) ? 1 : 0)
exitScore := exitScore + (twoRedCandles ? 1 : 0)
exitScore := exitScore + ((not dailyTrendUp and not weeklyTrendUp) ? 2 : 0)
exitScore := exitScore + (signalWeakness ? 2 : 0)
// === Profit Target Exit Condition ===
profitTargetHit = not na(entryPrice) and close >= entryPrice * 1.09
profitZoneSignal = (atResistance or shootingStar or bearishEngulfing) and volume > volSMA
isNewHigh = high >= ta.highest(high, 50)
exitAtProfitTarget = profitTargetHit and profitZoneSignal and not isNewHigh
// === Final Decision Thresholds ===
entryCond1 = entryScore >= 8
entryCond2 = entryScore >= 6 and breakoutAboveResistance and volume > volSMA and close > ema50
entryCond3 = monthlyTrendUp and weeklyTrendUp and (close > ema50 or volume > volSMA or twoGreenCandles)
entryCond = (entryCond1 or entryCond2 or entryCond3) and canEnter
exitCondRaw = (exitScore >= 7)
exitCond = (exitCondRaw and not bullContinuation) or exitAtProfitTarget
// === Position Tracking ===
var bool inPosition = false
var int barsInPosition = 0
var label entryLabel = na
var label exitLabel = na
if entryCond and not inPosition
inPosition := true
barsInPosition := 0
lastEntryBar := bar_index
entryPrice := close
entryLabel := label.new(bar_index, close, "Entry @" + str.tostring(close), style=label.style_label_up, color=color.green, textcolor=color.white)
if inPosition
barsInPosition += 1
if exitCond and inPosition
inPosition := false
barsInPosition := 0
lastExitBar := bar_index
exitLabel := label.new(bar_index, close, "Exit @" + str.tostring(close), style=label.style_label_down, color=color.red, textcolor=color.white)
// === Alerts ===
alertcondition(entryCond, title="Entry Alert", message="Yosef26: Entry Signal (Hierarchical Model)")
alertcondition(exitCond, title="Exit Alert", message="Yosef26: Exit Signal (Hierarchical Model)")
Chart patterns
Session Start Lines (NY AM/PM, Asia, London)Session Start Lines (NY AM/PM, Asia, London)
Plot vertical lines for sessions.

Model+ - Trendlines & S/R//@version=5
indicator("Model+ - Trendlines & S/R", overlay=true)
// === Parameters ===
length = input.int(20, title="Pivot Length")
lookback = input.int(252, title="Lookback Period (trading days ~ 1 year)", minval=1, maxval=5000)
minTouches = input.int(2, title="Minimum Touches for Valid S/R")
maxLines = input.int(15, title="Max Lines")
tolerance = input.float(1.5, title="Price Tolerance for S/R Match")
// === Arrays to Store Pivot Points ===
var line supportLines = array.new_line()
var line resistanceLines = array.new_line()
var float supportLevels = array.new_float()
var float resistanceLevels = array.new_float()
// === Function to Check Pivot High ===
isPivotHigh(src, len, idx) =>
idxValid = idx - len >= 0 and idx + len < bar_index and idx < 5000
result = true
if idxValid
for j = 1 to len
result := result and src > src and src > src
else
result := false
result
// === Function to Check Pivot Low ===
isPivotLow(src, len, idx) =>
idxValid = idx - len >= 0 and idx + len < bar_index and idx < 5000
result = true
if idxValid
for j = 1 to len
result := result and src < src and src < src
else
result := false
result
// === Helper Function: Count Nearby Pivots ===
countTouches(src, level, lookbackBars) =>
count = 0
maxBack = math.min(lookbackBars, bar_index)
for j = 0 to maxBack - 1
if math.abs(src - level) <= tolerance
count := count + 1
count
// === Loop Over Past Bars to Find S/R Levels ===
startIdx = math.max(length, bar_index - math.min(lookback, 4500))
endIdx = bar_index - length
if bar_index > startIdx + length
for i = startIdx to endIdx by 1
if isPivotHigh(high, length, i)
lvl = high
touches = countTouches(high, lvl, lookback)
if touches >= minTouches
l = line.new(x1=i, y1=lvl, x2=bar_index, y2=lvl, color=color.red, width=1)
array.push(resistanceLines, l)
array.push(resistanceLevels, lvl)
if isPivotLow(low, length, i)
lvl = low
touches = countTouches(low, lvl, lookback)
if touches >= minTouches
l = line.new(x1=i, y1=lvl, x2=bar_index, y2=lvl, color=color.green, width=1)
array.push(supportLines, l)
array.push(supportLevels, lvl)
// === Clean Up Old Lines ===
while array.size(resistanceLines) > maxLines
line.delete(array.shift(resistanceLines))
array.shift(resistanceLevels)
while array.size(supportLines) > maxLines
line.delete(array.shift(supportLines))
array.shift(supportLevels)

Automated Trading Session: New York KillzoneAutomated Trading Session: New York Killzone (Timezone & DST Aware)
This indicator tracks the New York Killzone session using intraday data and real-time timezone adjustments. It draws high/low boxes after the session ends and highlights the active session on your chart, making it ideal for traders focused on U.S. market volatility.
Key Features
Timezone & DST Support
Accurately reflects session timing based on your selected timezone and daylight saving settings.
Custom Session Input
Set your preferred New York Killzone hours (default: 08:00–09:30 New York time).
Visual Session Boxes
High/low ranges of the session are boxed on the chart for quick reference.
End-of-Session Alert
Get notified when the session closes, supporting both manual and automated workflows.
On-Chart Info Table
Displays active session time and timezone directly on the chart.

Dual DEMA w/ Trend TableDual DEMA
Updated with multi time frame trend table
Couldn't find one on trading view so I made one my self.

High Probability FVG Detector (MTF)Utilizes the logic behind why Fair Value Gaps exist in the first place; momentum leaving orders partially filled, therefore leaving resting liquidity that still needs to be filled. The more orders remaining, the higher the likelihood of price revisiting. However, there are high quality fair value gaps and low quality fair value gaps. High quality FVG's (the one's most likely to act as support/resistance) would likely be formed during high liquidity. This creates a more volume saturated zone. Saturation meaning remaining orders at each tick level, or as close as possible. Low quality FVG's would be one's formed during low liquidity, which price movement range is more related to gaps in the order book (thin ladder) rather than volume based momentum. Due to the limitations of Pine Script I don't have access to DOM/Order Book functionality but this indicator will make use of volume. Here is the executive summary:
FVG Detection: It scans the price action for the specific three-candle pattern that defines a bullish or bearish FVG.
Multi-Timeframe (MTF) Capability: It allows you to detect FVGs on a timeframe different from the one currently displayed on your chart (e.g., find 1-hour FVGs while looking at a 5-minute chart).
Probability Filtering: It attempts to classify FVGs based on the conditions during their formation.
Volume Filter: Checks if the FVG was formed with volume significantly higher than average (indicating strong participation).
Candle Range Filter: Checks if the FVG was formed by a candle with a significantly larger range than average (using ATR, indicating strong momentum/volatility).
Differentiated Coloring: It visually distinguishes between different types of FVGs using different colors.
High Probability: FVGs that meet the enabled Volume and/or Range filter criteria.
Low Volume: FVGs that specifically fail the Volume filter (when enabled), potentially indicating weaker conviction.
Regular: FVGs that don't meet any specific filter criteria (if the option to show them is enabled).
Mitigation Tracking: It monitors if the price later trades back into the identified FVG zone (based on either the wick touching or the body closing within the zone, selectable by the user) and changes the color of the FVG box once this happens.
Visual Display: It draws colored boxes representing the price range of the FVGs, optionally extending unmitigated boxes into the future for easy visibility.
In essence, the indicator aims to automate the detection of these price inefficiencies, filter them based on volume and momentum characteristics, and track when they are revisited by price, providing traders with visual cues about potentially significant support/resistance zones and/or target zones for trading into.

MTF Moving Average (itsmeterada)Hello TradingView Community,
Today, I'd like to introduce a simple and useful indicator I've developed.
**MTF Moving Average (itsmeterada):**
**What kind of indicator is this?**
This indicator allows you to display Moving Averages (MAs) from multiple timeframes (MTF) on your chart. It's convenient when you want to see MAs from higher timeframes alongside your current chart timeframe.
**Key Features of this Indicator:**
With traditional MTF Moving Average indicators, when you displayed multiple lines, it was often hard to remember "Which timeframe and period does this line represent?" and you had to open the parameters each time to check.
The biggest feature of this indicator is that it solves this problem!
It **automatically displays text labels at the end of each displayed Moving Average line**, indicating which timeframe and period that line corresponds to.
* Example: "240 SMA(20)" (Meaning: 4-hour chart's 20-period Moving Average)
* Example: "1D EMA(50)" (Meaning: Daily chart's 50-period Exponential Moving Average)
This makes it clear at a glance what settings each line uses, even when you display multiple MTF Moving Averages. You can analyze your charts more intuitively without getting confused. I believe this is a simple yet very convenient feature.
**How to Use:**
In the parameter settings, you can freely customize the timeframe, period, type of Moving Average (SMA, EMA, etc.), line color, thickness, and more. Please set it up to suit your trading style.
**Finally:**
I developed this indicator because I wanted to make MTF Moving Average analysis more visually clear and efficient. I hope it will be helpful for your trading.
Please give it a try! If you have any questions, feedback, or suggestions for improvement, please feel free to leave a comment.
If you like it, I'd appreciate a "Like"!
Thank you for your time and consideration.

Strategia Forex con RSI, MACD, SuperTrend, MA, SL/TPQuesto indicatore è progettato per il trading su Forex e XAUUSD nel time frame 1H. Combina 4 elementi tecnici fondamentali: RSI, MACD, SuperTrend e Media Mobile a 200 periodi.
Un segnale BUY viene generato quando:
- L'RSI è in ipervenduto
- Il MACD è in incrocio rialzista
- Il SuperTrend è verde (trend up)
- Il prezzo è sopra la media mobile a 200
Un segnale SELL viene generato quando:
- L'RSI è in ipercomprato
- Il MACD è in incrocio ribassista
- Il SuperTrend è rosso (trend down)
- Il prezzo è sotto la media mobile a 200
Il sistema mostra inoltre Stop Loss e Take Profit sul grafico, con un’etichetta del rapporto Rischio/Rendimento (R:R). Sono inclusi anche alert per segnali BUY e SELL. Ideale per strategie trend following su base oraria.
This indicator is designed for trading Forex and XAUUSD on the 1H timeframe. It combines 4 key technical tools: RSI, MACD, SuperTrend, and 200-period Moving Average.
Se volete anche il secondo script da allegare al primo per l'indicatore macd contattatemi che lo invio subito
A BUY signal is generated when:
- RSI is in oversold territory
- MACD shows a bullish crossover
- SuperTrend is green (uptrend)
- Price is above the 200 MA
A SELL signal is generated when:
- RSI is overbought
- MACD shows a bearish crossover
- SuperTrend is red (downtrend)
- Price is below the 200 MA
The system also plots Stop Loss and Take Profit levels, along with a Risk/Reward (R:R) label. Alerts for BUY and SELL signals are included. Ideal for 1H trend-following strategies.

Burr 5 Minute SHASmooth Heiken Ashi candles with buy sell indicators. Can adjust volume spike ratio to provide more accurate signals. Works best with 5 minute timeframe but settings are adjustable.


Forex Sessions - Simple//@version=5
indicator("Forex Sessions - Simple", overlay=true)
// === INPUTS === //
showSydney = input.bool(true, "Show Sydney")
showTokyo = input.bool(true, "Show Tokyo")
showLondon = input.bool(true, "Show London")
showNY = input.bool(true, "Show New York")
// Color customization
colorSydney = input.color(color.new(color.blue, 70), "Sydney Color")
colorTokyo = input.color(color.new(color.orange, 70), "Tokyo Color")
colorLondon = input.color(color.new(color.green, 70), "London Color")
colorNY = input.color(color.new(color.red, 70), "New York Color")
// === SESSION LOGIC (UTC TIME) === //
sydneySession = showSydney and ((hour >= 22) or (hour < 7))
tokyoSession = showTokyo and (hour >= 0 and hour < 9)
londonSession = showLondon and (hour >= 8 and hour < 17)
nySession = showNY and (hour >= 13 and hour < 22)
// Determine active session (priority order: NY > London > Tokyo > Sydney)
sessionColor = color(na)
if nySession
sessionColor := colorNY
else if londonSession
sessionColor := colorLondon
else if tokyoSession
sessionColor := colorTokyo
else if sydneySession
sessionColor := colorSydney
// === BACKGROUND COLOR === //
bgcolor(sessionColor, title="Session Highlight")
// === SESSION LEGEND === //
var table legend = table.new(position.top_right, 1, 5, border_width=1)
if bar_index == 0
table.cell(legend, 0, 0, "Sessions", bgcolor=color.gray, text_color=color.white)
table.cell(legend, 0, 1, "Sydney", bgcolor=colorSydney)
table.cell(legend, 0, 2, "Tokyo", bgcolor=colorTokyo)
table.cell(legend, 0, 3, "London", bgcolor=colorLondon)
table.cell(legend, 0, 4, "New York", bgcolor=colorNY)

Guppy Multiple Moving Average (GMMA)The GMMA Momentum Indicator plots 12 EMAs on your chart, divided into two groups:
Short-term EMAs (6 lines, default periods: 3, 5, 8, 10, 12, 15): Represent short-term trader sentiment and momentum.
Long-term EMAs (6 lines, default periods: 30, 35, 40, 45, 50, 60): Reflect long-term investor behavior and broader market trends.
By analyzing the interaction between these two groups, the indicator identifies:
Bullish and bearish trends based on the relative positions of the short- and long-term EMAs.
Momentum strength through the spread or convergence of the EMAs.
Potential reversals or breakouts via compression signals.
This PineScript version enhances the traditional GMMA by adding visual cues like background colors, bearish signals, and compression detection, making it ideal for swing traders seeking clear, actionable insights.
The GMMA Momentum Indicator provides several key features:
1. Trend Identification
Bullish Trend: When the short-term EMAs (green lines) are above the long-term EMAs (blue lines) and spreading apart, it signals strong upward momentum. The chart background turns light green to highlight this condition.
Bearish Trend: When the short-term EMAs cross below the long-term EMAs and converge, it indicates downward momentum. The background turns light red, and an orange downward triangle appears above the bar to mark a new bearish signal.
2. Momentum Analysis
The spread between the short-term EMAs reflects the strength of short-term momentum. A wide spread suggests strong momentum, while a tight grouping indicates weakening momentum or consolidation. Similarly, the long-term EMAs act as dynamic support or resistance, guiding traders on the broader trend.
3. Compression Detection
Compression occurs when both the short-term and long-term EMAs converge, signaling low volatility and a potential breakout or reversal. A yellow upward triangle appears below the bar when compression is detected, alerting traders to watch for price action.
4. Visual Cues
Green short-term EMAs: Show short-term trader activity.
Blue long-term EMAs: Represent long-term investor sentiment.
Background colors: Light green for bullish trends, light red for bearish trends, and transparent for neutral conditions.
Orange downward triangles: Mark new bearish trends.
Yellow upward triangles: Indicate compression, hinting at potential breakouts.
How to Use the GMMA Momentum Indicator for Swing Trading
Swing trading involves capturing price moves over days to weeks, and the GMMA Momentum Indicator is an excellent tool for this strategy. Here’s how to use it effectively:
1. Identifying Trade Entries
Buy Opportunities:
Look for a bullish trend (green background) where the short-term EMAs are above the long-term EMAs and spreading apart, indicating strong momentum.
A compression signal (yellow triangle) followed by a breakout above resistance or a bullish candlestick pattern can confirm an entry.
Example: On a daily chart, if the short-term EMAs cross above the long-term EMAs and the background turns green, consider entering a long position, especially if volume supports the move.
Sell Opportunities:
Watch for a bearish signal (orange downward triangle) or a bearish trend (red background) where the short-term EMAs cross below the long-term EMAs.
Example: If the short-term EMAs collapse below the long-term EMAs and an orange triangle appears, it may signal a shorting opportunity or a time to exit longs.
2. Managing Trades
Use the long-term EMAs as dynamic support (in uptrends) or resistance (in downtrends) to set stop-loss levels or trail stops.
Monitor the spread of the short-term EMAs. A widening spread suggests the trend is strong, while convergence may indicate it’s time to take profits or tighten stops.
3. Anticipating Reversals
Compression signals (yellow triangles) highlight periods of low volatility, often preceding significant price moves. Combine these with price action (e.g., breakouts or reversals) or other indicators (e.g., RSI or volume) for confirmation.
Example: If a compression signal appears near a key support level and the price breaks upward, it could signal the start of a new bullish swing.
4. Best Practices
Timeframes: The indicator works well on daily or 4-hour charts for swing trading, but you can adjust the EMA periods for shorter (e.g., 1-hour) or longer (e.g., weekly) timeframes.
Confirmation: Combine the GMMA with other tools like support/resistance levels, candlestick patterns, or oscillators (e.g., MACD) to reduce false signals.
Risk Management: Always use proper position sizing and stop-losses, as EMAs are lagging indicators and may produce delayed signals in choppy markets.

Shade Between 9 EMA and 20 EMAThis indicator shades the area between the 9 EMA and the 20 EMA.
The wider the area of shade, the stronger the trend and momentum. If the shaded area is more narrow, that tells you to possibly take caution as there is no clear trend yet.

Key Levels SpacemanBTC IDWMThe Key Level Indicator for TradingView is a powerful tool designed to automatically identify and display critical price levels where significant market reactions have historically occurred. These levels include previous highs and lows, session opens, closes, midpoints, and custom support/resistance zones based on user-defined criteria. The indicator helps traders pinpoint areas of potential liquidity, breakout zones, and high-probability reversal or continuation setups. With customizable styling, real-time updates, and multi-timeframe support, this indicator is ideal for scalpers, day traders, and swing traders looking to enhance their technical analysis with clearly marked, actionable price levels.

Yosef26 - Weighted Decision Model//@version=5
indicator("Yosef26 - Weighted Decision Model", overlay=true)
// === Moving Averages ===
ema20 = ta.ema(close, 20)
ema50 = ta.ema(close, 50)
ema100 = ta.ema(close, 100)
// === Candle Components ===
priceRange = high - low
body = math.abs(close - open)
upperWick = high - math.max(close, open)
lowerWick = math.min(close, open) - low
volSMA = ta.sma(volume, 20)
// === Volume Momentum (3-day uptrend) ===
volUp3 = (volume > volume ) and (volume > volume )
// === Candlestick Pattern Detection ===
bullishEngulfing = (close < open ) and (close > open) and (close > open ) and (open < close )
bearishEngulfing = (close > open ) and (close < open) and (close < open ) and (open > close )
doji = body < (priceRange * 0.1)
hammer = (lowerWick > body * 2) and (upperWick < body) and (close > open)
shootingStar = (upperWick > body * 2) and (lowerWick < body) and (close < open)
// === Support/Resistance Zones ===
atSupport = low <= ta.lowest(low, 5)
atResistance = high >= ta.highest(high, 5)
// === Scoring System for Entry ===
entryScore = 0
entryScore := entryScore + (bullishEngulfing ? 3 : 0)
entryScore := entryScore + (hammer ? 2 : 0)
entryScore := entryScore + (volUp3 ? 1 : 0)
entryScore := entryScore + ((volume > volSMA) ? 2 : 0)
entryScore := entryScore + ((close > ema20 or close > ema50) ? 1 : 0)
entryScore := entryScore + (atSupport ? 2 : 0)
entryScore := entryScore + ((close > close ) ? 1 : 0)
// === Scoring System for Exit ===
exitScore = 0
exitScore := exitScore + (bearishEngulfing ? 3 : 0)
exitScore := exitScore + (shootingStar ? 2 : 0)
exitScore := exitScore + (doji ? 1 : 0)
exitScore := exitScore + ((volume < volSMA * 1.1) ? 1 : 0)
exitScore := exitScore + ((close < ema50) ? 1 : 0)
exitScore := exitScore + (atResistance ? 2 : 0)
exitScore := exitScore + ((close < close ) ? 1 : 0)
// === Decision Thresholds ===
entryCond = (entryScore >= 7)
exitCond = (exitScore >= 6)
// === Position Tracking ===
var bool inPosition = false
var int barsInPosition = 0
var label entryLabel = na
var label exitLabel = na
if entryCond and not inPosition
inPosition := true
barsInPosition := 0
entryLabel := label.new(bar_index, close, "Entry @" + str.tostring(close), style=label.style_label_up, color=color.green, textcolor=color.white)
if inPosition
barsInPosition += 1
if exitCond
inPosition := false
barsInPosition := 0
exitLabel := label.new(bar_index, close, "Exit @" + str.tostring(close), style=label.style_label_down, color=color.red, textcolor=color.white)
// === Alerts ===
alertcondition(entryCond, title="Entry Alert", message="Yosef26: Entry Signal (Scored Decision)")
alertcondition(exitCond, title="Exit Alert", message="Yosef26: Exit Signal (Scored Decision)")

Daily Range % with Conditional SPX DirectionThis indicator visualizes the short-term market sentiment by combining the trend of the S&P 500 index (SPX) with daily price volatility (DP%).
Key Features:
Calculates a 5-period Exponential Moving Average (EMA) of SPX to detect trend direction:
Rising EMA → Uptrend
Falling EMA → Downtrend
Calculates a 5-period Simple Moving Average (SMA) of Daily Price Range % (DP%) to assess volatility trend:
Rising DP% → Increasing volatility
Falling DP% → Decreasing volatility
Background Colors:
Green: SPX trend up & volatility down → Bullish
Yellow:
SPX trend up & volatility up, or
SPX trend down & volatility down → Neutral
Red: SPX trend down & volatility up → Bearish
On-screen Labels:
Displays SPX trend direction (⬆️ / ⬇️)
Displays volatility direction (⬆️ / ⬇️)
Displays overall market sentiment: Bullish / Neutral / Bearish
This tool is designed to help traders quickly assess the relationship between trend and volatility, aiding in market environment analysis and discretionary trading decisions.


CB Composite Index LineThis indicator was defined by Constance Brown in her book, "TECHNICAL ANALYSIS FOR THE TRADING PROFESSIONAL", Second Edition, 2011, Published by McGraw Hill Publishing.

Burr 5 Minute SHASHA candles to show trend and also provide buy sell signals with volume spike 1.5%. Adjustable settings


Burr 5 MIN SHASmooth Heiken Ashi candles with Volume Spike setting to give accurate Buy and Sell Signals.
