AAPL Multi-Strategy (5 Strategies Beta)✅ Momentum Reversal
✅ Moving Average Crossover
✅ Heikin-Ashi Reversal
✅ Swing Day Trading
✅ Candlestick Patterns
Color Shape Signal Type Meaning
🟡 Yellow Circle Momentum Reversal Dot Stochastic overbought (>80) or oversold (<20) → possible trend reversal area
🟢 Green Triangle Up Moving Average Crossover → BUY EMA20 crossed above EMA50 AND price above EMA200 → bullish crossover confirmation
🔴 Red Triangle Down Moving Average Crossover → SELL EMA20 crossed below EMA50 AND price below EMA200 → bearish crossover confirmation
🟩 Lime Circle Heikin-Ashi Bull Heikin-Ashi candle closed bullish (HA close > HA open)
🟫 Maroon Circle Heikin-Ashi Bear Heikin-Ashi candle closed bearish (HA close < HA open)
🔵 Blue Flag Swing Day Trading BUY Price crosses above EMA20 from below → pullback BUY signal
🟠 Orange Flag Swing Day Trading SELL Price crosses below EMA20 from above → pullback SELL signal
🟢 Green Label Up Bullish Engulfing Pattern Classic bullish engulfing candlestick pattern detected → possible trend reversal up
🔴 Red Label Down Bearish Engulfing Pattern Classic bearish engulfing candlestick pattern detected → possible trend reversal down
Chart patterns

AAPL Multi-Strategy (5 Strategies Beta)AAPL Multi-Strategy (5 Strategies Beta)
✅ Momentum Reversal
✅ Moving Average Crossover
✅ Heikin-Ashi Reversal
✅ Swing Day Trading
✅ Candlestick Pattern

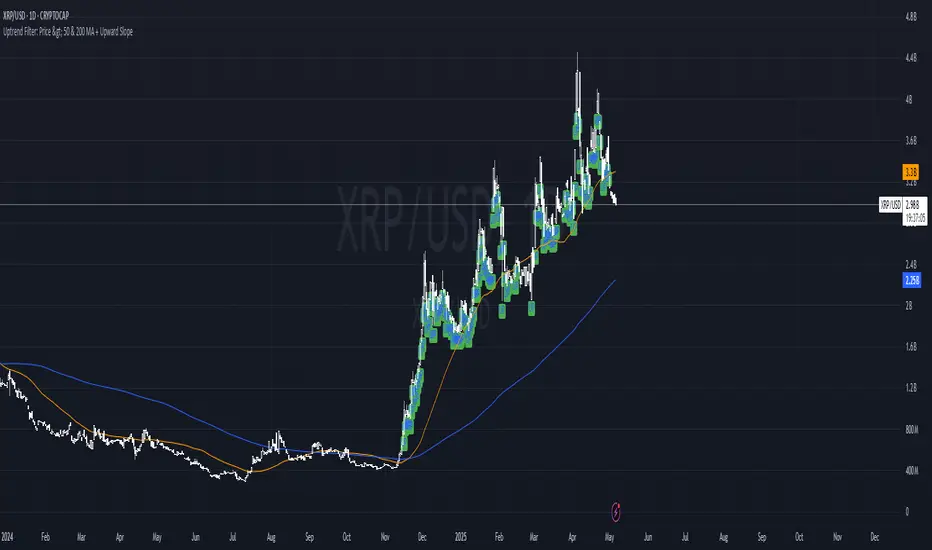
Uptrend Filter: Price > 50 & 200 MA + Upward SlopeThis indicator is designed to help traders instantly identify strong uptrend conditions based on two simple yet powerful criteria:
Price is above both the 50-day and 200-day moving averages
Both moving averages are sloping upward (positive momentum)
When both conditions are met, the indicator plots a green “UP” label below the candle, signaling a valid uptrend setup. This filter is ideal for asset selection in strategy-building, portfolio rotation, or trend-following systems.
🧠 Why it works:
The 50-day MA reflects medium-term momentum.
The 200-day MA represents the long-term trend.
When both are aligned and sloping upward, it confirms strong market structure and trend health.
🧰 Best used for:
Token screening (e.g., filtering altcoins)
Momentum-based entries
Trend confirmation
Risk filtering in strategy backtesting
EMA+RSI Strong Confirmed Signals//@version=5
indicator("EMA+RSI Strong Confirmed Signals", overlay=true)
// --- Индикаторы
ema100 = ta.ema(close, 100)
ema200 = ta.ema(close, 200)
rsi = ta.rsi(close, 14)
vol = ta.sma(volume, 20) // средний объём
// --- Фильтры тренда
isUptrend = ema100 > ema200
isDowntrend = ema100 < ema200
// --- Усиленные условия входа
longCondition = isUptrend and ta.crossover(close, ema100) and rsi < 28 and volume > vol * 1.5
shortCondition = isDowntrend and ta.crossunder(close, ema100) and rsi > 72 and volume > vol * 1.5
// --- Take Profit и Stop Loss уровни
tpLong = close * 1.03
slLong = close * 0.975
tpShort = close * 0.97
slShort = close * 1.025
// --- Отображение на графике
plot(ema100, color=color.orange, title="EMA 100")
plot(ema200, color=color.red, title="EMA 200")
plot(longCondition ? tpLong : na, title="TP LONG", color=color.green)
plot(longCondition ? slLong : na, title="SL LONG", color=color.red)
plot(shortCondition ? tpShort : na, title="TP SHORT", color=color.green)
plot(shortCondition ? slShort : na, title="SL SHORT", color=color.red)
plotshape(longCondition, location=location.belowbar, color=color.lime, style=shape.labelup, text="STRONG LONG")
plotshape(shortCondition, location=location.abovebar, color=color.red, style=shape.labeldown, text="STRONG SHORT")
// --- Alertconditions для webhook
alertcondition(longCondition, title="STRONG LONG Signal", message='{"chat_id": "@exgosignal", "text": "{{ticker}} STRONG LONG сигнал по цене {{close}} (TP 3%, SL -2.5%)"}')
alertcondition(shortCondition, title="STRONG SHORT Signal", message='{"chat_id": "@exgosignal", "text": "{{ticker}} STRONG SHORT сигнал по цене {{close}} (TP 3%, SL -2.5%)"}')

Model+ - Trendlines Only// === Model+ Trendlines (Support/Resistance) ===
//@version=5
indicator("Model+ - Trendlines Only", overlay=true)
// Input parameters
pivotLookback = input.int(10, title="Pivot Lookback", minval=1)
minTouches = input.int(2, title="Minimum Touches for Trendline", minval=2)
// === Identify Highs and Lows ===
ph = ta.pivothigh(high, pivotLookback, pivotLookback)
pl = ta.pivotlow(low, pivotLookback, pivotLookback)
// === Store trendline candidate points ===
var line supportLines = array.new_line()
var line resistanceLines = array.new_line()
// === Function: draw horizontal level if repeated ===
plotSupportLevel(_price, _color) =>
line.new(x1=bar_index - pivotLookback, y1=_price, x2=bar_index, y2=_price, extend=extend.right, color=_color, width=1)
// === Find repeating lows (support) ===
var float supportLevels = array.new_float()
if pl
level = low
count = 0
for i = 0 to array.size(supportLevels) - 1
if math.abs(level - array.get(supportLevels, i)) <= syminfo.mintick * 20
count := count + 1
if count == 0
array.push(supportLevels, level)
plotSupportLevel(level, color.green)
// === Find repeating highs (resistance) ===
var float resistanceLevels = array.new_float()
if ph
level = high
count = 0
for i = 0 to array.size(resistanceLevels) - 1
if math.abs(level - array.get(resistanceLevels, i)) <= syminfo.mintick * 20
count := count + 1
if count == 0
array.push(resistanceLevels, level)
plotSupportLevel(level, color.red)
// === Notes ===
// This code marks horizontal support and resistance levels based on pivot points.
// It adapts automatically to different timeframes, showing relevant levels for each.
// Next step: add diagonal trendlines (ascending/descending) and pattern recognition.

53 ToolkitTest
No functions
5-minute candlestick 3-tick rule: How to find a rebound point (short-term bottom) when a correction comes after an uptrend
The most stable way to make a profit when trading short-term is to accurately determine the point of rebound in the 'rise -> fall -> rebound' pattern.
Based on the premise that a decline is followed by a rebound, this is a formula created by analyzing the patterns of coins that frequently rebound.
Prevents being bitten at the high point by forcibly delaying the entry point according to market conditions. (HOW?)
Mostly 5-minute and 15-minute candles are used, but 30-minute candles can also be used depending on the situation.

BTC EMA+RSI Strong Signals//@version=5
indicator("BTC EMA+RSI Strong Signals", overlay=true)
ema100 = ta.ema(close, 100)
ema200 = ta.ema(close, 200)
rsi = ta.rsi(close, 14)
// Фильтры тренда
isUptrend = ema100 > ema200
isDowntrend = ema100 < ema200
// Условия входа
longCondition = isUptrend and ta.crossover(close, ema100) and rsi < 30
shortCondition = isDowntrend and ta.crossunder(close, ema100) and rsi > 70
// TP/SL
tpLong = close * 1.025
slLong = close * 0.985
tpShort = close * 0.975
slShort = close * 1.015
// Отображение
plot(ema100, color=color.orange, title="EMA 100")
plot(ema200, color=color.red, title="EMA 200")
plot(longCondition ? tpLong : na, title="TP LONG", color=color.green)
plot(longCondition ? slLong : na, title="SL LONG", color=color.red)
plot(shortCondition ? tpShort : na, title="TP SHORT", color=color.green)
plot(shortCondition ? slShort : na, title="SL SHORT", color=color.red)
// Метки сигнала
plotshape(longCondition, location=location.belowbar, color=color.green, style=shape.labelup, text="LONG")
plotshape(shortCondition, location=location.abovebar, color=color.red, style=shape.labeldown, text="SHORT")
// Alertconditions
alertcondition(longCondition, title="BTC LONG", message='BTC LONG сигнал по цене {{close}}')
alertcondition(shortCondition, title="BTC SHORT", message='BTC SHORT сигнал по цене {{close}}')
// Webhook Alerts
if longCondition
alert('{"chat_id": "@exgosignal", "text": "BTC LONG сигнал по цене ' + str.tostring(close) + ' (TP +2.5%, SL -1.5%)"}', alert.freq_once_per_bar_close)
if shortCondition
alert('{"chat_id": "@exgosignal", "text": "BTC SHORT сигнал по цене ' + str.tostring(close) + ' (TP +2.5%, SL -1.5%)"}', alert.freq_once_per_bar_close)
if close >= tpLong
alert('{"chat_id": "@exgosignal", "text": "BTC LONG: цель достигнута по цене ' + str.tostring(close) + '"}', alert.freq_once_per_bar_close)
if close <= slLong
alert('{"chat_id": "@exgosignal", "text": "BTC LONG: сработал стоп по цене ' + str.tostring(close) + '"}', alert.freq_once_per_bar_close)
if close <= tpShort
alert('{"chat_id": "@exgosignal", "text": "BTC SHORT: цель достигнута по цене ' + str.tostring(close) + '"}', alert.freq_once_per_bar_close)
if close >= slShort
alert('{"chat_id": "@exgosignal", "text": "BTC SHORT: сработал стоп по цене ' + str.tostring(close) + '"}', alert.freq_once_per_bar_close)

Yosef26 - איתותים לכניסה ויציאה// Yosef26 - מודל מלא ל-TradingView לזיהוי נקודות כניסה ויציאה
// כולל: פתילים, ממוצעים נעים, ווליום, איתותים יציבים לגרף, והתראות
//@version=5
indicator("Yosef26 - איתותים לכניסה ויציאה", overlay=true)
// === חישובי ממוצעים ===
ema20 = ta.ema(close, 20)
ema50 = ta.ema(close, 50)
ema100 = ta.ema(close, 100)
ema200 = ta.ema(close, 200)
// === חישובי מבנה נר ===
priceRange = high - low
body = math.abs(close - open)
upperWick = high - math.max(close, open)
lowerWick = math.min(close, open) - low
vol = volume
volSMA = ta.sma(vol, 20)
// === תנאים לנר היפוך חיובי (כניסה) ===
entryCond = (lowerWick > priceRange * 0.4) and (close > open) and (body < priceRange * 0.35) and (close > ema100 * 0.97 and close < ema200 * 1.03) and (vol > volSMA) and (close > ema20 and close > ema50)
// === תנאים לנר היפוך שלילי (יציאה) ===
exitCond = (upperWick > priceRange * 0.4) and (close < open) and (body < priceRange * 0.35) and (close < ema50) and (vol < volSMA)
// === הצגת סימני כניסה/יציאה צמודים לנרות (עמידים לכל שינוי גרף) ===
plotshape(entryCond, title="כניסה", location=location.belowbar, style=shape.triangleup, color=color.green, size=size.normal, text="Long")
plotshape(exitCond, title="יציאה", location=location.abovebar, style=shape.triangledown, color=color.red, size=size.normal, text="Sell")
// === התראות ===
alertcondition(entryCond, title="Alert Entry", message="📥 אות כניסה לפי מודל Yosef26")
alertcondition(exitCond, title="Alert Exit", message="📤 אות יציאה לפי מודל Yosef26")

Dual ATR TargetsATR Distance Markers with Percentage Display
This powerful indicator visually displays dynamic support/resistance levels based on the ATR Trailing Stop, while providing clear percentage-based distance measurements to help traders assess risk/reward ratios at a glance.
Key Features:
🔹 Dual Distance Markers - Track two customizable distance multiples (default: 1.0x and 0.35x ATR)
🔹 Percentage-First Display - Shows percentage distances first (more intuitive for multi-timeframe analysis) with exact price differences in parentheses
🔹 Current + Previous Candle Data - Compare current levels with previous candle's values for trend confirmation
🔹 Clean Visual Presentation - Grey info box with white text for optimal readability
🔹 Customizable Settings - Adjust ATR period, multiplier, colors, and visibility
How Traders Use It:
✅ Identify potential profit targets based on volatility-adjusted distances
✅ Gauge stop-loss placement with percentage-based risk assessment
✅ Compare current vs. previous candle distances for momentum shifts
✅ Maintain consistent risk parameters across different instruments
Input Parameters:
ATR Period (default 14)
ATR Multiplier (default 1.1)
Two fully configurable distance markers
Custom colors for each marker
Perfect For:
• Swing traders looking for volatility-based targets
• Position traders managing risk across timeframes
• Anyone who prefers percentage-based analysis over fixed price distances
The indicator plots circular markers (blue) and cross markers (red) at your specified distances from the ATR trailing stop, while the info box keeps all critical data organized in one corner of your chart.
Pro Tip: Combine with trend analysis tools - the distances become more reliable when trading in the direction of the prevailing trend. The percentage display helps maintain consistent position sizing across different priced instruments.

Whale Zones (Accumulation & Distribution)Zone d'accumulation - Défendue / Zone de Distribution - Zone d'achat impulsive

Time-Based Fair Value Gaps (FVG) with Inversions (iFVG)Overview
The Time-Based Fair Value Gaps (FVG) with Inversions (iFVG) (ICT/SMT) indicator is a specialized tool designed for traders using Inner Circle Trader (ICT) methodologies. Inspired by LuxAlgo's Fair Value Gap indicator, this script introduces significant enhancements by integrating ICT principles, focusing on precise time-based FVG detection, inversion tracking, and retest signals tailored for institutional trading strategies. Unlike LuxAlgo’s general FVG approach, this indicator filters FVGs within customizable 10-minute windows aligned with ICT’s macro timeframes and incorporates ICT-specific concepts like mitigation, liquidity grabs, and session-based gap prioritization.
This tool is optimized for 1–5 minute charts, though probably best for 1 minute charts, identifying bullish and bearish FVGs, tracking their mitigation into inverted FVGs (iFVGs) as key support/resistance zones, and generating retest signals with customizable “Close” or “Wick” confirmation. Features like ATR-based filtering, optional FVG labels, mitigation removal, and session-specific FVG detection (e.g., first FVG in AM/PM sessions) make it a powerful tool for ICT traders.
Originality and Improvements
While inspired by LuxAlgo’s FVG indicator (credit to LuxAlgo for their foundational work), this script significantly extends the original concept by:
1. Time-Based FVG Detection: Unlike LuxAlgo’s continuous FVG identification, this script filters FVGs within user-defined 10-minute windows each hour (:00–:10, :10–:20, etc.), aligning with ICT’s emphasis on specific periods of institutional activity, such as hourly opens/closes or kill zones (e.g., New York 7:00–11:00 AM EST). This ensures FVGs are relevant to high-probability ICT setups.
2. Session-Specific First FVG Option: A unique feature allows traders to display only the first FVG in ICT-defined AM (9:30–10:00 AM EST) or PM (1:30–2:00 PM EST) sessions, reflecting ICT’s focus on initial market imbalances during key liquidity events.
3. ICT-Driven Mitigation and Inversion Logic: The script tracks FVG mitigation (when price closes through a gap) and converts mitigated FVGs into iFVGs, which serve as ICT-style support/resistance zones. This aligns with ICT’s view that mitigated gaps become critical reversal points, unlike LuxAlgo’s simpler gap display.
4. Customizable Retest Signals: Retest signals for iFVGs are configurable for “Close” (conservative, requiring candle body confirmation) or “Wick” (faster, using highs/lows), catering to ICT traders’ need for precise entry timing during liquidity grabs or Judas swings.
5. ATR Filtering and Mitigation Removal: An optional ATR filter ensures only significant FVGs are displayed, reducing noise, while mitigation removal declutters the chart by removing filled gaps, aligning with ICT’s principle that mitigated gaps lose relevance unless inverted.
6. Timezone and Timeframe Safeguards: A timezone offset setting aligns FVG detection with EST for ICT’s New York-centric strategies, and a timeframe warning alerts users to avoid ≥1-hour charts, ensuring accuracy in time-based filtering.
These enhancements make the script a distinct tool that builds on LuxAlgo’s foundation while offering ICT traders a tailored, high-precision solution.
How It Works
FVG Detection
FVGs are identified when a candle’s low is higher than the high of two candles prior (bullish FVG) or a candle’s high is lower than the low of two candles prior (bearish FVG). Detection is restricted to:
• User-selected 10-minute windows (e.g., :00–:10, :50–:60) to capture ICT-relevant periods like hourly transitions.
• AM/PM session first FVGs (if enabled), focusing on 9:30–10:00 AM or 1:30–2:00 PM EST for key market opens.
An optional ATR filter (default: 0.25× ATR) ensures only gaps larger than the threshold are displayed, prioritizing significant imbalances.
Mitigation and Inversion
When price closes through an FVG (e.g., below a bullish FVG’s bottom), the FVG is mitigated and becomes an iFVG, plotted as a support/resistance zone. iFVGs are critical in ICT for identifying reversal points where institutional orders accumulate.
Retest Signals
The script generates signals when price retests an iFVG:
• Close: Triggers when the candle body confirms the retest (conservative, lower noise).
• Wick: Triggers when the candle’s high/low touches the iFVG (faster, higher sensitivity). Signals are visualized with triangular markers (▲ for bullish, ▼ for bearish) and can trigger alerts.
Visualization
• FVGs: Displayed as colored boxes (green for bullish, red for bearish) with optional “Bull FVG”/“Bear FVG” labels.
• iFVGs: Shown as extended boxes with dashed midlines, limited to the user-defined number of recent zones (default: 5).
• Mitigation Removal: Mitigated FVGs/iFVGs are removed (if enabled) to keep the chart clean.
How to Use
Recommended Settings
• Timeframe: Use 1–5 minute charts for precision, avoiding ≥1-hour timeframes (a warning label appears if misconfigured).
• Time Windows: Enable :00–:10 and :50–:60 for hourly open/close FVGs, or use the “Show only 1st presented FVG” option for AM/PM session focus.
• ATR Filter: Keep enabled (multiplier 0.25–0.5) for significant gaps; disable on 1-minute charts for more FVGs during volatility.
• Signal Preference: Use “Close” for conservative entries, “Wick” for aggressive setups.
• Timezone Offset: Set to -5 for EST (or -4 for EDT) to align with ICT’s New York session.
Trading Strategy
1. Macro Timeframes: Focus on New York (7:00–11:00 AM EST) or London (2:00–5:00 AM EST) kill zones for high institutional activity.
2. FVG Entries: Trade bullish FVGs as support in uptrends or bearish FVGs as resistance in downtrends, especially in :00–:10 or :50–:60 windows.
3. iFVG Retests: Enter on retest signals (▲/▼) during liquidity grabs or Judas swings, using “Close” for confirmation or “Wick” for speed.
4. Session FVGs: Use the “Show only 1st presented FVG” option to target the first gap in AM/PM sessions, often tied to ICT’s market maker algorithms.
5. Risk Management: Combine with ICT concepts like order blocks or breaker blocks for confluence, and set stops beyond FVG/iFVG boundaries.
Alerts
Set alerts for:
• “Bullish FVG Detected”/“Bearish FVG Detected”: New FVGs in selected windows.
• “Bullish Signal”/“Bearish Signal”: iFVG retest confirmations.
Settings Description
• Show Last (1–100, default: 5): Number of recent iFVGs to display. Lower values reduce clutter.
• Show only 1st presented FVG : Limits FVGs to the first in 9:30–10:00 AM or 1:30–2:00 PM EST sessions (overrides time window checkboxes).
• Time Window Checkboxes: Enable/disable FVG detection in 10-minute windows (:00–:10, :10–:20, etc.). All enabled by default.
• Signal Preference: “Close” (default) or “Wick” for iFVG retest signals.
• Use ATR Filter: Enables ATR-based size filtering (default: true).
• ATR Multiplier (0–∞, default: 0.25): Sets FVG size threshold (higher values = larger gaps).
• Remove Mitigated FVGs: Removes filled FVGs/iFVGs (default: true).
• Show FVG Labels: Displays “Bull FVG”/“Bear FVG” labels (default: true).
• Timezone Offset (-12 to 12, default: -5): Aligns time windows with EST.
• Colors: Customize bullish (green), bearish (red), and midline (gray) colors.
Why Use This Indicator?
This indicator empowers ICT traders with a tool that goes beyond generic FVG detection, offering precise, time-filtered gaps and inversion tracking aligned with institutional trading principles. By focusing on ICT’s macro timeframes, session-specific imbalances, and customizable signal logic, it provides a clear edge for scalping, swing trading, or reversal setups in high-liquidity markets.

Pivot Candle PatternsPivot Candle Patterns Indicator
Overview
The PivotCandlePatterns indicator is a sophisticated trading tool that identifies high-probability candlestick patterns at market pivot points. By combining Williams fractals pivot detection with advanced candlestick pattern recognition, this indicator targets the specific patterns that statistically show the highest likelihood of signaling reversals at market tops and bottoms.
Scientific Foundation
The indicator is built on extensive statistical analysis of historical price data using a 42-period Williams fractal lookback period. Our research analyzed which candlestick patterns most frequently appear at genuine market reversal points, quantifying their occurrence rates and subsequent success in predicting reversals.
Key Research Findings:
At Market Tops (Pivot Highs):
- Three White Soldiers: 28.3% occurrence rate
- Spinning Tops: 13.9% occurrence rate
- Inverted Hammers: 11.7% occurrence rate
At Market Bottoms (Pivot Lows):
- Three Black Crows: 28.4% occurrence rate
- Hammers: 13.3% occurrence rate
- Spinning Tops: 13.1% occurrence rate
How It Works
1. Pivot Point Detection
The indicator uses a non-repainting implementation of Williams fractals to identify potential market turning points:
- A pivot high is confirmed when the middle candle's high is higher than surrounding candles within the lookback period
- A pivot low is confirmed when the middle candle's low is lower than surrounding candles within the lookback period
- The default lookback period is 2 candles (user adjustable from 1-10)
2. Candlestick Pattern Recognition
At identified pivot points, the indicator analyzes candle properties using these parameters:
- Body percentage threshold for Spinning Tops: 40% (adjustable from 10-60%)
- Shadow percentage threshold for Hammer patterns: 60% (adjustable from 40-80%)
- Maximum upper shadow for Hammer: 10% (adjustable from 5-20%)
- Maximum lower shadow for Inverted Hammer: 10% (adjustable from 5-20%)
3. Pattern Definitions
The indicator recognizes these specific patterns:
Single-Candle Patterns:
- Spinning Top : Small body (< 40% of total range) with significant upper and lower shadows (> 25% each)
- Hammer : Small body (< 40%), very long lower shadow (> 60%), minimal upper shadow (< 10%), closing price above opening price
- Inverted Hammer : Small body (< 40%), very long upper shadow (> 60%), minimal lower shadow (< 10%)
Multi-Candle Patterns:
- Three White Soldiers : Three consecutive bullish candles, each closing higher than the previous, with each open within the previous candle's body
- Three Black Crows : Three consecutive bearish candles, each closing lower than the previous, with each open within the previous candle's body
4. Visual Representation
The indicator provides multiple visualization options:
- Highlighted candle backgrounds for pattern identification
- Text or dot labels showing pattern names and success rates
- Customizable colors for different pattern types
- Real-time alert functionality on pattern detection
- Information dashboard displaying pattern statistics
Why It Works
1. Statistical Edge
Unlike traditional candlestick pattern indicators that simply identify patterns regardless of context, PivotCandlePatterns focuses exclusively on patterns occurring at statistical pivot points, dramatically increasing signal quality.
2. Non-Repainting Design
The pivot detection algorithm only uses confirmed data, ensuring the indicator doesn't repaint or provide false signals that disappear on subsequent candles.
3. Complementary Pattern Selection
The selected patterns have both:
- Statistical significance (high frequency at pivots)
- Logical market psychology (reflecting institutional supply/demand changes)
For example, Three White Soldiers at a pivot high suggests excessive bullish sentiment reaching exhaustion, while Hammers at pivot lows indicate rejection of lower prices and potential buying pressure.
Practical Applications
1. Reversal Trading
The primary use is identifying potential market reversals with statistical probability metrics. Higher percentage patterns (like Three White Soldiers at 28.3%) warrant more attention than lower probability patterns.
2. Confirmation Tool
The indicator works well when combined with other technical analysis methods:
- Support/resistance levels
- Trend line breaks
- Divergences on oscillators
- Volume analysis
3. Risk Management
The built-in success rate metrics help traders properly size positions based on historical pattern reliability. The displayed percentages reflect the probability of the pattern successfully predicting a reversal.
Optimized Settings
Based on extensive testing, the default parameters (Body: 40%, Shadow: 60%, Shadow Maximums: 10%, Lookback: 2) provide the optimal balance between:
- Signal frequency
- False positive reduction
- Early entry opportunities
- Pattern clarity
Users can adjust these parameters based on their timeframe and trading style, but the defaults represent the statistically optimal configuration.
Complementary Research: Reclaim Analysis
Additional research on "reclaim" scenarios (where price briefly breaks a level before returning) showed:
- Fast reclaims (1-2 candles) have 70-90% success rates
- Reclaims with increasing volume have 53.1% success rate vs. decreasing volume at 22.6%
This complementary research reinforces the importance of candle patterns and timing at critical market levels.


Volatility Gaussian Bands [BigBeluga]The Volatility Gaussian Bands are a technical analysis tool used to assess market volatility and potential price movements. They are constructed by integrating Gaussian (normal) distribution principles with volatility measures to create dynamic bands around price data.
Key Features of Volatility Gaussian Bands:
Basis in Gaussian Distribution:
These bands assume that price returns follow a normal distribution, allowing for probabilistic modeling of expected price ranges.

Multi-Confluence Adv. Rejection ID - v5Combines Order Blocks, Single Candle Order Blocks, and Fair Value Gaps along with buy and sell signals. The premise is identifying zones where these things overlap, price reentering that zone, and rejecting with higher than average volume. Rejection is defined as entering zone being drawn based on the parameters of identifying the order block types, etc, price reentering either from above or below and then exiting with higher than average volume support

Aroon Buy & Sell with Customizable Candle Pattern FilterSure! Here's a description of how the script works without the code:
### Overview:
This trading strategy combines the **Aroon indicator** and **candlestick pattern recognition** to generate buy and sell signals. It allows for a more customizable approach by enabling you to filter signals based on the direction of a trend (identified by the Aroon indicator) and specific candlestick patterns that are often seen as indicators of potential reversals or continuation in the market.
### Key Components:
1. **Aroon Indicator**:
* **Aroon Up and Aroon Down** are calculated over a 14-period window. The Aroon Up shows how recently the highest high occurred, while Aroon Down shows how recently the lowest low occurred.
* A crossover between the Aroon Up and Aroon Down lines indicates a change in market trend. When the Aroon Up crosses above the Aroon Down, it's a signal of an uptrend, and when the Aroon Down crosses above the Aroon Up, it's a signal of a downtrend.
* The strategy uses **5-minute** Aroon data to track the overall trend and **1-minute** Aroon data to refine entry signals.
2. **Candlestick Pattern Filters**:
The script allows you to select and use various candlestick patterns to filter the signals:
* **Bullish Engulfing**: A pattern where a bullish candle completely engulfs the previous bearish candle.
* **Bearish Engulfing**: A pattern where a bearish candle completely engulfs the previous bullish candle.
* **Pin Bar**: A candlestick with a small body and a long tail, indicating potential reversal.
* **Doji**: A candlestick with a very small body, showing indecision in the market.
* You can toggle each of these patterns on or off based on your preference.
3. **Signal Generation**:
* **Buy Signal**: A buy signal is triggered when the market is in a bullish trend (as indicated by the Aroon Up crossing over the Aroon Down on the 5-minute chart), the Aroon Down on the 1-minute chart is at 100% (suggesting a low moment for entry), and a valid candlestick pattern (like Bullish Engulfing, Pin Bar, or Doji) occurs.
* **Sell Signal**: A sell signal is triggered when the market is in a bearish trend (as indicated by the Aroon Down crossing over the Aroon Up on the 5-minute chart), the Aroon Up on the 1-minute chart is at 100% (suggesting a potential reversal point), and a valid candlestick pattern (like Bearish Engulfing, Pin Bar, or Doji) occurs.
4. **Cooldown Period**:
* The strategy includes a **cooldown** mechanism to prevent multiple signals from being triggered in a very short period. This helps avoid false signals and ensures that only significant trends or pattern formations are considered for trades.
5. **Signal Plotting**:
* **Buy Signals** are displayed as green "BUY" labels below the price bars.
* **Sell Signals** are displayed as red "SELL" labels above the price bars.
6. **Alerts**:
* Alerts are set up to notify the user when a buy or sell signal is triggered. This can be useful for traders who prefer to be alerted when a valid setup is detected.
### Customization:
* The user can customize which candlestick patterns they want to use in the strategy by turning them on or off.
* The user can also adjust the Aroon settings and other parameters, allowing for flexibility in adapting the strategy to different market conditions and personal preferences.
### Summary:
This strategy blends trend-following (via Aroon) with reversal/continuation signals from candlestick patterns, providing traders with a way to fine-tune their entries and exits based on both trend strength and price action patterns. It aims to reduce noise and filter out weak signals by combining these elements.

ZHUZHUBLCKBKX MACDThis indicator is based on the standard Trading View MACD Indicator with added visual prompts to take the guess work out of buying and selling. Only use this indicator when you decide to get in or get out. Used in conjunction with "BLCKBOX Buying / Selling Sentiment" indicator.

PSP [Daye's Theory]//@version=5
indicator("PSP ", overlay=true)
// User input to choose 3 assets
asset1 = input.string("MNQ1!", title="Select Asset 1", options= )
asset2 = input.string("MES1!", title="Select Asset 2", options= )
asset3 = input.string("MYM1!", title="Select Asset 3", options= )
// Automatically select the timeframe from the first asset
asset1_timeframe = timeframe.isintraday ? timeframe.period : "D" // Use the chart's time frame, or fallback to daily for non-intraday
// Checkbox for enabling correlation check between NQ and ES
pairs_check = input.bool(false, title="Check PSP NQ & ES only")
// Declare highlight color globally
highlight_color = input.color(color.red, title="PSP Color")
// Fetch data for all assets (do it outside the conditionals)
asset1_open = request.security(asset1, asset1_timeframe, open)
asset1_close = request.security(asset1, asset1_timeframe, close)
asset2_open = request.security(asset2, asset1_timeframe, open)
asset2_close = request.security(asset2, asset1_timeframe, close)
asset3_open = request.security(asset3, asset1_timeframe, open)
asset3_close = request.security(asset3, asset1_timeframe, close)
// Define the candle color for each asset
asset1_color = asset1_close > asset1_open ? color.green : color.red
asset2_color = asset2_close > asset2_open ? color.green : color.red
asset3_color = asset3_close > asset3_open ? color.green : color.red
// Initialize candle_diff with var to persist its state
var bool candle_diff = false
if (pairs_check)
// Only check correlation between asset1 and asset2
candle_diff := (asset1_color != asset2_color)
else
// Check correlation among all three assets
candle_diff := (asset1_color != asset2_color) or (asset2_color != asset3_color) or (asset1_color != asset3_color)
// Apply the barcolor globally if the condition is met
barcolor(candle_diff ? highlight_color : na)

Aroon Buy & Sell (5m Trend, 100% Signal on 1m)Purpose of the Script:
This Pine Script creates a buy and sell signal system that:
Tracks trend direction on the 5-minute (5m) chart using Aroon indicators.
Generates buy and sell signals on the 1-minute (1m) chart based on the 5-minute trend and when Aroon Up/Down reaches 100%.
Components of the Script:
1. Aroon Calculation Function (f_aroon):
This function calculates the Aroon Up and Aroon Down values based on the high and low of the last 14 bars:
Aroon Up: Measures how recently the highest high occurred over the last 14 bars.
Aroon Down: Measures how recently the lowest low occurred over the last 14 bars.
Both values are expressed as a percentage:
Aroon Up is calculated by 100 * (14 - barssince(high == highest(high, 14))) / 14
Aroon Down is calculated by 100 * (14 - barssince(low == lowest(low, 14))) / 14
2. Getting Aroon Values for 5m and 1m:
aroonUp_5m, aroonDown_5m: These are the Aroon values calculated from the 5-minute chart (Aroon Up and Aroon Down).
aroonUp_1m, aroonDown_1m: These are the Aroon values calculated for the 1-minute chart, on which we will plot the signals.
3. Trend Detection (5-minute):
Bullish trend: When the Aroon Up crosses above the Aroon Down on the 5-minute chart, indicating a potential upward movement (uptrend).
Bearish trend: When the Aroon Down crosses above the Aroon Up on the 5-minute chart, indicating a potential downward movement (downtrend).
These are detected using ta.crossover() functions:
bullishCross_5m: Detects when Aroon Up crosses above Aroon Down.
bearishCross_5m: Detects when Aroon Down crosses above Aroon Up.
We then track these crossovers using two variables:
inBullishTrend_5m: This is set to true when we are in a bullish trend (Aroon Up crosses above Aroon Down on 5m).
inBearishTrend_5m: This is set to true when we are in a bearish trend (Aroon Down crosses above Aroon Up on 5m).
4. Cooldown Logic:
This prevents the signals from repeating too frequently:
buyCooldown: Ensures that a buy signal is only generated every 20 bars (approx. every 100 minutes).
sellCooldown: Ensures that a sell signal is only generated every 20 bars (approx. every 100 minutes).
We use:
buyCooldown := math.max(buyCooldown - 1, 0) and sellCooldown := math.max(sellCooldown - 1, 0) to decrease the cooldown over time.
5. Buy/Sell Signal Logic:
Buy signal: A buy signal is generated when:
The 5-minute trend is bullish (Aroon Up > Aroon Down on 5m).
Aroon Down on the 1-minute chart reaches 100% (indicating an extreme oversold condition in the context of the current bullish trend).
The signal is only generated if the cooldown (buyCooldown == 0) allows it.
Sell signal: A sell signal is generated when:
The 5-minute trend is bearish (Aroon Down > Aroon Up on 5m).
Aroon Up on the 1-minute chart reaches 100% (indicating an extreme overbought condition in the context of the current bearish trend).
The signal is only generated if the cooldown (sellCooldown == 0) allows it.
6. Plotting the Signals:
Plot Buy Signals: When a buy signal is triggered, a green "BUY" label is plotted below the bar.
Plot Sell Signals: When a sell signal is triggered, a red "SELL" label is plotted above the bar.
The signal conditions are drawn on the 1-minute chart but rely on the trend from the 5-minute chart.
7. Alert Conditions:
Alert for Buy signal: An alert is triggered when the buy signal condition is met.
Alert for Sell signal: An alert is triggered when the sell signal condition is met.
How It Works:
Trend Tracking (5m): The script looks for the trend on the 5-minute chart (bullish or bearish based on Aroon Up/Down crossover).
Signal Generation (1m): The script then checks the 1-minute chart for an Aroon value of 100% (for either Aroon Up or Aroon Down).
Signals: Based on the trend, if the conditions are met, the script plots buy/sell signals and sends an alert.
Key Points:
5-minute trend: The script determines the market trend on the 5-minute chart.
1-minute signal: Signals are plotted on the 1-minute chart based on Aroon values reaching 100%.
Cooldown: Prevents signals from repeating too frequently.

Market Structure: BoS & CHoCH (Math by Thomas)📌 Description:
Market Structure: BoS & CHoCH (Math by Thomas) is a clean and reliable market structure tool designed to visually mark Swing Highs, Swing Lows, and classify each one as HH (Higher High), LH (Lower High), LL (Lower Low), or HL (Higher Low) based on price action. It also detects and labels Break of Structure (BoS) and Change of Character (CHoCH) to help identify potential continuation or reversal in trend.
🛠️ How to Use:
Add the indicator to your chart (works on any timeframe and asset).
Adjust the "Swing Sensitivity" input to fine-tune how many bars the script uses to detect a swing high/low. A higher number smooths out noise.
The script will automatically:
Mark every confirmed swing high or low with a solid line.
Label the swing as HH, LH, HL, or LL depending on its relative position.
Show BoS (trend continuation) or CHoCH (trend reversal) labels with the current trend direction.
Toggle labels or lines on or off with the corresponding checkboxes in settings.
🔍 Tip:
Use this indicator alongside other tools like volume or RSI for more confident entries. A CHoCH followed by two BoS in the same direction often signals a strong trend reversal.

Estrategia Institucional EUR/USDIt only enters structural breakout zones if there is a confirmation candle.
Filter by the most liquid institutional sessions.
Manage risk with dynamic SL/TP based on structure.
Visually displays relevant zones (swing highs/lows).

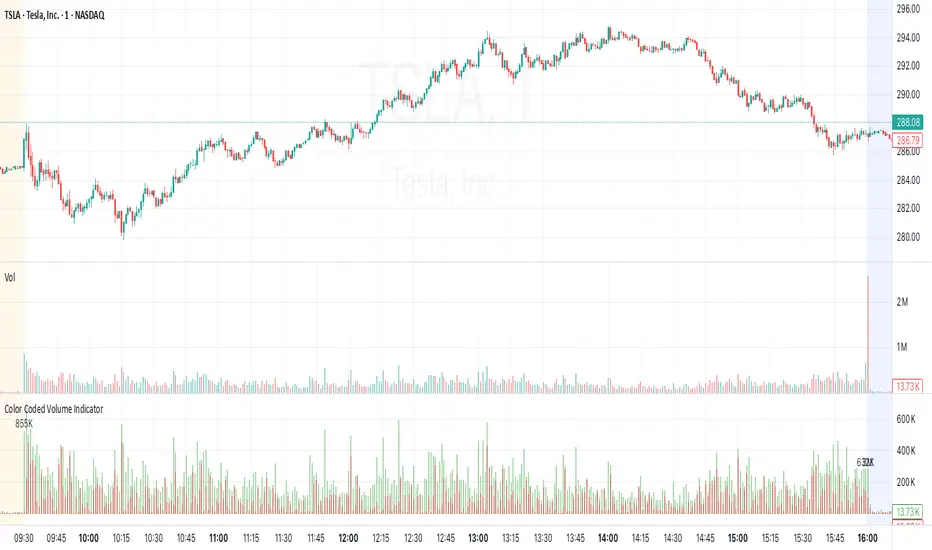
Color Coded Volume IndicatorColor Coded Volume Indicator
Overview
Splits each bar’s total volume into estimated buy-side vs. sell-side components and displays them as stacked two-tone columns (red = sell, green = buy). Axis labels and tooltips use “K”/“M” formatting.
Features
Stacked Two-Tone Columns
Red Base : estimated sell volume (50% opacity)
Green Top : remaining buy volume (50% opacity)
Automatic K/M Formatting via format=format.volume
Zero Baseline for clean reference at zero
Positive-Only Bars (no negatives)
How It Works
True-Range Guard
Skips bars where high == low to avoid divide-by-zero.
Volume Split
BuyVol = Volume × (Close − Low) / (High − Low)
SellVol = Volume × (High − Close) / (High − Low)
Both series clamped ≥ 0.
Layered Plot
Draw semi-transparent green at full height, then overlay red sell portion.
Usage
Open TradingView’s Pine Editor
Paste in the full script
Click “Save & Add to Chart”
In the Publish dialog, title it “Color Coded Volume Indicator” and paste this description.
Interpretation
Green-dominant bars → strong buying pressure
Red-dominant bars → strong selling pressure
Equal halves → balanced activity
Seekho roj kamao V6 StrategyThis strategy is based on the Chandelier Exit indicator, a volatility-based trailing stop developed by Chuck LeBeau. It uses the Average True Range (ATR) to dynamically determine stop levels for both long and short positions. The strategy aims to capture trends by entering trades when the Chandelier Exit signal changes direction.
📌 How It Works:
Long Entry: A buy signal is generated when price breaks above the Chandelier short stop, indicating a potential upward trend. The strategy enters a long position at this point.
Short Entry: A sell signal is generated when price falls below the Chandelier long stop, suggesting a downtrend. The strategy enters a short position here.
Exit Conditions:
Long positions are closed when a short signal appears.
Short positions are closed when a buy signal appears.
⚙️ Key Parameters:
ATR Period: Defines how many bars are used to calculate volatility.
ATR Multiplier: Adjusts the sensitivity of the stop levels.
Use Close for Extremes: Determines whether the highest/lowest close is used instead of highs/lows for calculating stops.
Bar Confirmation: Waits for the bar to close before confirming a signal.
This strategy works best in trending markets and may produce whipsaws in sideways or choppy conditions. It can be used standalone or in combination with other filters like volume, moving averages, or higher time frame confirmation.
