FVG Alerts (Vortus)Fair Value Gaps (FVGs) represent price inefficiencies where buying and selling volumes are imbalanced, creating gaps between the wicks of consecutive candles. These gaps often act as magnets for price, as markets tend to "fill" these gaps before resuming their trend.
FVGs can signal potential entry or exit points, making them a valuable tool for traders looking to exploit these price inefficiencies.
Chart patterns

BLCKBOX StochasticAnother dirty indicator that is based on the Trading View Stochtastic indicator with the addition of directional arrow indicators that show the anticipated price direction (up/down).
I have released several indicators that can be used in conjunction to hopefully improve your chances of making a ton of money!
BLCKBOX indicators include;
BLCKBOX Buying / Selling Sentiment
BLCKBOX MACD Indicator
BLCKBOX Relative Strength Index
BLCKBOX Crypto Bear Market Prediction
BLCKBOX Stochtastic
If you find this or any other indicator useful and wish to show your gratitude, you may!
Doge
DJwW7XazGk2R8nXjt8y5ydQfGKYSz3XV3h
Litecoin
ltc1qh8t4dmz8sugjcd5unn0g49985u0tz5gs6kf98y
Bitcoin
bc1q0deh9t9w9tm3qgd3npn7965rzel35qumez7m5v
Ethereum
0xa23a7bbde03ea31f5cce4b115c8ef1ea8bc9f467
Pepe
Pr7DZSXKwVGv7LYhRQ9oSuuWxUecc3Dvwq

Nifty Trend-Pullback Scalping// Nifty Trend-Pullback Scalping Strategy
//@version=5
strategy("Nifty Trend-Pullback Scalping", overlay=true, default_qty_type=strategy.percent_of_equity, default_qty_value=10)
// === INPUTS ===
emaFastLen = input.int(20, title="Fast EMA Length")
emaSlowLen = input.int(50, title="Slow EMA Length")
useRSI = input.bool(true, title="Use RSI Filter")
rsiPeriod = input.int(14, title="RSI Period")
minRSI = input.int(40, title="Min RSI for Long")
maxRSI = input.int(60, title="Max RSI for Short")
// === INDICATORS ===
emaFast = ta.ema(close, emaFastLen)
emaSlow = ta.ema(close, emaSlowLen)
rsi = ta.rsi(close, rsiPeriod)
plot(emaFast, color=color.orange, title="20 EMA")
plot(emaSlow, color=color.blue, title="50 EMA")
// === CONDITIONS ===
// Long Setup
longTrend = emaFast > emaSlow and close > emaFast and close > emaSlow
longPullback = close > emaFast and close < emaFast
longRSICond = not useRSI or (rsi > minRSI and rsi < 70)
longCandle = close > open and open <= emaFast
longEntry = longTrend and longPullback and longRSICond and longCandle
// Short Setup
shortTrend = emaFast < emaSlow and close < emaFast and close < emaSlow
shortPullback = close < emaFast and close > emaFast
shortRSICond = not useRSI or (rsi < maxRSI and rsi > 30)
shortCandle = close < open and open >= emaFast
shortEntry = shortTrend and shortPullback and shortRSICond and shortCandle
// === EXECUTION ===
if (longEntry)
strategy.entry("Long", strategy.long)
if (shortEntry)
strategy.entry("Short", strategy.short)
// === EXIT STRATEGY ===
takeProfitPerc = input.float(0.5, title="Take Profit %") / 100
stopLossPerc = input.float(0.25, title="Stop Loss %") / 100
strategy.exit("TP/SL Long", from_entry="Long", profit=takeProfitPerc * close, loss=stopLossPerc * close)
strategy.exit("TP/SL Short", from_entry="Short", profit=takeProfitPerc * close, loss=stopLossPerc * close)

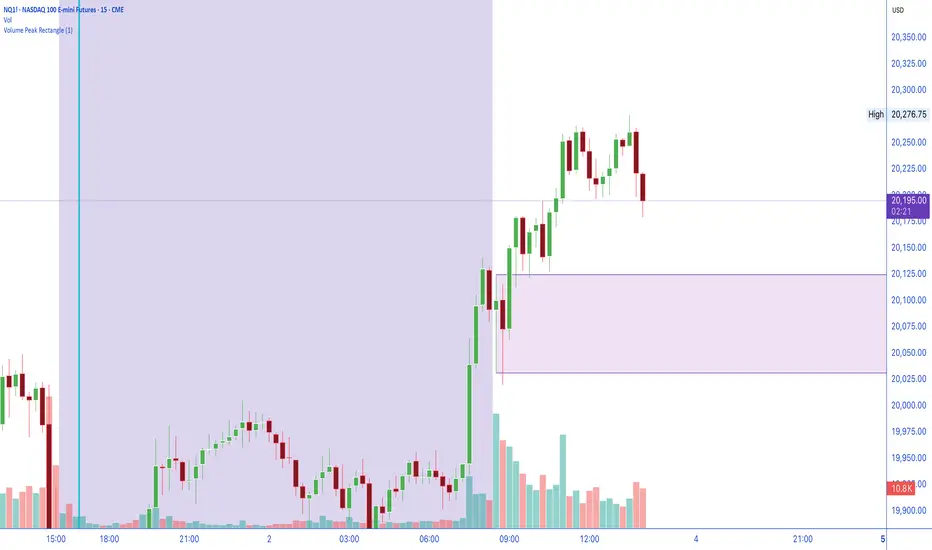
Volume Peak RectangleOutlines the 'Latest' Highest Volume Bar. Typically High Volume bars create very good support and resistance levels. This is a draw off the Opening Range Breakout theory, with the idea that high volume candles create very good upper and lower levels of liquidity zones.
Volume Sentiment Pro (NTY88)Volume Sentiment Edge: Smart Volume & RSI Trading System
Description:
Unlock the power of volume-driven market psychology combined with precision RSI analysis! This professional-grade indicator identifies high-probability trading opportunities through:
🔥 Key Features
1. Smart Volume Spike Detection
Auto-detects abnormal volume activity with adaptive threshold
Clear spike labels & multi-timeframe confirmation
RSI-Powered Sentiment Analysis
Real-time Bullish/Bearish signals based on RSI extremes
Combined volume-RSI scoring system (Strong Bull/Bear alerts)
2. Professional Dashboard
Instant sentiment status table (bottom-right)
Color-coded momentum strength visualization
Customizable themes for all chart styles
3. Institutional-Grade Tools
HTF (Daily/Weekly) volume confirmation
EMA trend-filtered momentum signals
Spike-to-Threshold ratio monitoring
4. Trade-Ready Alerts
Pre-configured "Bullish Setup" (Spike + Oversold RSI)
"Bearish Setup" (Spike + Overbought RSI)
Why Traders Love This:
✅ Real-Time Visual Alerts - SPIKE markers above bars + table updates
✅ Adaptive Thresholds - Self-adjusting to market volatility
✅ Multi-Timeframe Verification - Avoid false signals with HTF confirmation
✅ Customizable UI - 10+ color settings for perfect chart integration
Usage Scenarios:
Day Traders: Catch volume surges during key sessions
Swing Traders: Confirm reversals with RSI extremes
All Markets: Works equally well on stocks, forex & crypto
Confirmation Tool: Combine with your existing strategy
Sample Setup:
"Enter long when:
5. RED SPIKE label appears
Table shows 'Oversold RSI'
Momentum status turns 'Bullish'
Volume exceeds daily average (Confirmed)"
📈 Try Risk-Free Today!
Perfect for traders who want:
Clean, non-repainting signals
Institutional-level volume analysis
Professional visual feedback
Customizable trading rules
⚠️ Important: Works best on 15m-4h timeframes. Combine with price action for maximum effectiveness.
📜 Legal Disclaimer
By using this indicator, you agree to the following terms:
Not Financial Advice
This tool provides technical analysis only. It does NOT constitute investment advice, financial guidance, or solicitation to trade.
High Risk Warning
Trading financial instruments carries substantial risk. Past performance ≠ future results. Never risk capital you cannot afford to lose.
No Guarantees
Signals are based on historical data and mathematical models. Market conditions may change rapidly, rendering previous patterns ineffective.
User Responsibility
You alone bear 100% responsibility for trading decisions. We expressly disclaim liability for any profit/loss resulting from this tool's use.
Professional Consultation
Always consult a licensed financial advisor before taking positions. This tool should NEVER be used as sole decision-making criteria.
Educational Purpose
This indicator is provided "as is" for informational/educational use only. No representation is made about its accuracy or completeness.
Third-Party Data
We do not verify exchange data accuracy. Use signals at your own discretion after independent verification.

Precision Swing Point color (PSP) IndicatorPSP Quarterly Theory indicator - Anyone can see source code, if you make some improvements (true opens, ssmt.. etc) to it let me know. we are a community and should share knowledge. If i didnt believe we are all one, i wouldnt have put this script public. Credits to medic, daye, jacob
1. Blue dot: PSP in NQ
2. Red dot: PSP in ES
3. Green dot: PSP YM
4. Yellow dot: PSP more than one asset

Engulfing Bar Liquidity SweepIts an indicator that sweeps liquidity before going to the opposite direction.


EMA7 & EMA20 Cross + MACD Confirmation
indicator("EMA7 & EMA20 Cross + MACD Confirmation", overlay=true)
// === 输入参数
ema7_len = input.int(7, title="EMA7 Length")
ema20_len = input.int(20, title="EMA20 Length")
macd_fast = input.int(12, title="MACD Fast Length")
macd_slow = input.int(26, title="MACD Slow Length")
macd_signal = input.int(9, title="MACD Signal Length")

Pattern Entry with Toggles - CleanThis script detects various candlestick patterns on a chart and marks potential entry points when certain conditions are met.
Script Contents:
1. Trend Filter (EMA)
Calculates an exponential moving average (EMA) with an adjustable period (emaPeriod).
Determines whether the market is currently trending up (isUptrend) or down (isDowntrend).
2. Pattern Detection (variable activation)
There are settings to individually activate or deactivate patterns for long (buy) and short (sell) positions:
Long Patterns: Bullish Engulfing, Morning Star, Hammer, Doji
Short Patterns: Bearish Engulfing, Evening Star, Shooting Star, Doji
3. Pattern Detection:
Automatically defined conditions to detect the respective candlestick patterns, e.g.:
Bullish Engulfing: Small red candle followed by a large green candle that "envelops" the previous one.
Morning Star: Third pattern that signals an uptrend.
Doji: Very small candle that indicates uncertainty.
The same applies to the short pattern variants.
4. Signal Generation:
If a pattern is detected and the trend direction is correct, a potential entry price (entry price) is set.
The whole process is limited to at least 5 bars (minBars) to avoid signals that are too close together.
5. Visualization:
Draws a marker ("Entry") on the chart for each valid signal, with the color corresponding to long or short.
What can you adjust in the settings (on/off switch)?
You can individually specify the following in the inputs:
Pattern Function Default Value
Enable Bullish Engulfing Enable for long entries true
Enable Morning Star Enable for long entries true
Enable Hammer Enable for long entries true
Enable Doji Enable for long entries true
Enable Bearish Engulfing Enable for short entries true
Enable Evening Star Enable for short entries true
Enable Shooting Star Enable for short entries true
Enable Doji (Short) Enable for short entries true
If you set one of these options to false, this pattern will no longer be considered when generating signals, regardless of whether it is present or not.


First Day of Month HighlighterHello Folks
This is the indicator that highlights the first day of the month . You can use this for identifying the 1st calendar day of the month
Use it . Have fun

Akash Candle 1.0 %Hello Folks
This is the indicator that identifies the candle size having High - Low < 1%
Use it good and have fun in trading

Akash Candle 0.5%Hello Folks
This is the indicator for identifying the candle size having hihg - low <0.5%
Use it good

Multiple (12) Strong Buy/Sell Signals + Momentum
Indicator Manual: "Multiple (12) Strong Buy/Sell Signals + Momentum"
This indicator is designed to identify strong buy and sell signals based on 12 configurable conditions, which include a variety of technical analysis methods such as trend-following indicators, pattern recognition, volume analysis, and momentum oscillators. It allows for customizable alerts and visual cues on the chart. The indicator helps traders spot potential entry and exit points by displaying buy and sell signals based on the selected conditions.
Key Observations:
• The script integrates multiple indicators and pattern recognition methods to provide comprehensive buy/sell signals.
• Trend-based indicators like EMAs and MACD are combined with pattern recognition (flags, triangles) and momentum-based signals (RSI, ADX, and volume analysis).
• User customization is a core feature, allowing adjustments to the conditions and thresholds for more tailored signals.
• The script is designed to be responsive to market conditions, with multiple conditions filtering out noise to generate reliable signals.
________________________________________
Key Features:
1. 12 Combined Buy/Sell Signal Conditions: This indicator incorporates a diverse set of conditions based on trend analysis, momentum, and price patterns.
2. Minimum Conditions Input: You can adjust the threshold of conditions that need to be met for the buy/sell signals to appear.
3. Alert Customization: Set alert thresholds for both buy and sell signals.
4. Dynamic Visualization: Buy and sell signals are shown as triangles on the chart, with momentum signals highlighted as circles.
________________________________________
Detailed Description of the 12 Conditions:
1. Exponential Moving Averages (EMA):
o Conditions: The indicator uses EMAs with periods 3, 8, and 13 for quick trend-following signals.
o Bullish Signal: EMA3 > EMA8 > EMA13 (Bullish stack).
o Bearish Signal: EMA3 < EMA8 < EMA13 (Bearish stack).
o Reversal Signal: The crossing over or under of these EMAs can signify trend reversals.
2. MACD (Moving Average Convergence Divergence):
o Fast MACD (2, 7, 3) is used to confirm trends quickly.
o Bullish Signal: When the MACD line crosses above the signal line.
o Bearish Signal: When the MACD line crosses below the signal line.
3. Donchian Channel:
o Tracks the highest high and lowest low over a given period (default 20).
o Breakout Signal: Price breaking above the upper band is bullish; breaking below the lower band is bearish.
4. VWAP (Volume-Weighted Average Price):
o Above VWAP: Bullish condition (price above VWAP).
o Below VWAP: Bearish condition (price below VWAP).
5. EMA Stacking & Reversal:
o Tracks the order of EMAs (3, 8, 13) to confirm strong trends and reversals.
o Bullish Reversal: EMA3 < EMA8 < EMA13 followed by a crossing to bullish.
o Bearish Reversal: EMA3 > EMA8 > EMA13 followed by a crossing to bearish.
6. Bull/Bear Flags:
o Bull Flag: Characterized by a strong price movement (flagpole) followed by a pullback and breakout.
o Bear Flag: Similar to Bull Flag but in the opposite direction.
7. Triangle Patterns (Ascending and Descending):
o Detects ascending and descending triangles using pivot highs and lows.
o Ascending Triangle: Higher lows and flat resistance.
o Descending Triangle: Lower highs and flat support.
8. Volume Sensitivity:
o Identifies price moves with significant volume increases.
o High Volume: When current volume is significantly above the moving average volume (set to 1.2x of the average).
9. Momentum Indicators:
o RSI (Relative Strength Index): Confirms overbought and oversold levels with thresholds set at 65 (overbought) and 35 (oversold).
o ADX (Average Directional Index): Confirms strong trends when ADX > 28.
o Momentum Up: Momentum is upward with strong volume and bullish RSI/ADX conditions.
o Momentum Down: Momentum is downward with strong volume and bearish RSI/ADX conditions.
10. Bollinger & Keltner Squeeze:
o Squeeze Condition: A contraction in both Bollinger Bands and Keltner Channels indicates low volatility, signaling a potential breakout.
o Squeeze Breakout: Price breaking above or below the squeeze bands.
11. 3 Consecutive Candles Condition:
o Bullish: Price rises for three consecutive candles with higher highs and lows.
o Bearish: Price falls for three consecutive candles with lower highs and lows.
12. Williams %R and Stochastic RSI:
o Williams %R: A momentum oscillator with signals when the line crosses certain levels.
o Stochastic RSI: Provides overbought/oversold levels with smoother signals.
o Combined Signals: You can choose whether to require both WPR and StochRSI to signal a buy/sell.
________________________________________
User Inputs (Inputs Tab):
1. Minimum Conditions for Buy/Sell:
o min_conditions: Number of conditions required to trigger a buy/sell signal on the chart (1 to 12).
o Alert_min_conditions: User-defined alert threshold (how many conditions must be met before an alert is triggered).
2. Donchian Channel Settings:
o Show Donchian: Toggle visibility of the Donchian channel.
o Donchian Length: The length of the Donchian Channel (default 20).
3. Bull/Bear Flag Settings:
o Bull Flag Flagpole Strength: ATR multiplier to define the strength of the flagpole.
o Bull Flag Pullback Length: Length of pullback for the bull flag pattern.
o Bull Flag EMA Length: EMA length used to confirm trend during bull flag pattern.
Similar settings exist for Bear Flag patterns.
4. Momentum Indicators:
o RSI Length: Period for calculating the RSI (default 9).
o RSI Overbought: Overbought threshold for the RSI (default 65).
o RSI Oversold: Oversold threshold for the RSI (default 35).
5. Bollinger/Keltner Squeeze Settings:
o Squeeze Width Threshold: The maximum width of the Bollinger and Keltner Bands for squeeze conditions.
6. Stochastic RSI Settings:
o Stochastic RSI Length: The period for calculating the Stochastic RSI.
7. WPR Settings:
o WPR Length: Period for calculating Williams %R (default 14).
________________________________________
User Inputs (Style Tab):
1. Signal Plotting:
o Control the display and colors of the buy/sell signals, momentum indicators, and pattern signals on the chart.
o Buy/Sell Signals: Can be customized with different colors and shapes (triangle up for buys, triangle down for sells).
o Momentum Signals: Custom circle placement for momentum-up or momentum-down signals.
2. Donchian Channel:
o Show Donchian: Toggle visibility of the Donchian upper, lower, and middle bands.
o Band Colors: Choose the color for each band (upper, lower, middle).
________________________________________
How to Use the Indicator:
1. Adjust Minimum Conditions: Set the minimum number of conditions that must be met for a signal to appear. For example, set it to 5 if you want only stronger signals.
2. Set Alert Threshold: Define the number of conditions needed to trigger an alert. This can be different from the minimum conditions for visual signals.
3. Customize Appearance: Modify the colors and styles of the signals to match your preferences.
________________________________________
Conclusion:
This comprehensive trading indicator uses a combination of trend-following, pattern recognition, and momentum-based conditions to help you spot potential buy and sell opportunities. By adjusting the input settings, you can fine-tune it to match your specific trading strategy, making it a versatile tool for different market conditions.
Signal Reliability Based on Condition Count
The reliability of the buy/sell signals increases as more conditions are met. Here's a breakdown of the probabilities:
1. 1-3 Conditions Met: Lower Probability
o Signals that meet only 1-3 conditions tend to have lower reliability and are considered less probable. These signals may represent false positives or weaker market movements, and traders should approach them with caution.
2. 4 Conditions Met: More Reliable Signal
o When 4 conditions are met, the signal becomes more reliable. This indicates that multiple indicators or market patterns are aligning, increasing the likelihood of a valid buy/sell opportunity. While not foolproof, it's a stronger indication that the market may be moving in a particular direction.
3. 5-6 Conditions Met: Strong Signal
o A signal meeting 5-6 conditions is considered a strong signal. This indicates a well-confirmed move, with several technical indicators and market factors aligning to suggest a higher probability of success. These are the signals that traders often prioritize.
4. 7+ Conditions Met: Rare and High-Confidence Signal
o Signals that meet 7 or more conditions are rare and should be considered high-confidence signals. These represent a significant alignment of multiple factors, and while they are less frequent, they are highly reliable when they do occur. Traders can be more confident in acting on these signals, but they should still monitor market conditions for confirmation.
________________________________________
You can adjust the number of conditions as needed, but this breakdown should give a clear structure on how the signal strength correlates with the number of conditions met!


8:15 AM 15-min Candle Box on 5-min Chart with TP and SLThe “8:15 AM 15-min Candle Box on 5-min Chart with TP and SL” indicator is a custom-built Pine Script tool for breakout trading strategies, particularly tailored for assets like NASDAQ Futures (NAS100) during the U.S. market pre-open.
🔍 What It Does:
Tracks the 8:15–8:30 AM Central Time (CDT) Candle:
It marks the high and low of the 15-minute candle that starts at 8:15 AM (CDT).
The box visually outlines this price range.
Draws a Breakout Box:
At 8:30 AM, a box is drawn from the 8:15 candle’s high and low.
The box stretches forward 8 hours into the session, helping you visualize price interaction with that range.
Detects Breakouts:
If the price closes above the high, it signals a buy breakout.
If it closes below the low, it signals a sell breakout.
Automatically Calculates TP and SL:
Take Profit (TP): 50 pips from the breakout level in the direction of the trade.
Stop Loss (SL): 40 pips in the opposite direction.
Pips are calculated using the symbol’s minimum tick size.
Color Feedback:
Box turns green on a buy breakout, red on a sell breakout.
If TP is reached, the box turns black.
If SL is hit, the box turns purple.
🧠 Why Use This Indicator:
Perfect for pre-market breakout traders who want a visual confirmation of price action around the U.S. market open.
Provides a clear entry range, trade direction, and risk/reward visual cue.
No manual drawing — everything is automated daily based on reliable timing.
Would you like a version with alerts or plotted TP/SL lines as well?

BLCKBOX Buying / Selling SentimentThis indicator attempts to predict buying and selling sentiment. It may help?

BLCKBOX Crypto Bear Market PredicationMy First Indicator!
This indicator was developed in an attempt to predict a crypto bear market and global recession. It's a really simple plugin-in that reads GDP information from major countries, plots them in a chart and calculates the lowest values month on month. When a -1 is detected in the chart a red indicator is displayed on the indicator at the bottom of the window warning of a potential future downward trend for crypto markets.
Let me know how you get on. The indicator doesn't work with normal stock markets but there does seem to be a correlation with crypto markets.

AlphaTrend++AlphaTrend++
Overview
The AlphaTrend++ is an advanced Pine Script indicator designed to help traders identify buy and sell opportunities in trending and volatile markets. Building on trend-following principles, it uses a modified Average True Range (ATR) calculation combined with volume or momentum data to plot a dynamic trend line. The indicator overlays on the price chart, displaying a colored trend line, a filled trend zone, buy/sell signals, and optional stop-loss tick labels, making it ideal for day trading or swing trading, particularly in markets like futures (e.g., MES).
What It Does
This indicator generates buy and sell signals based on the direction and momentum of a custom trend line, filtered by optional time restrictions and signal frequency logic. The trend line adapts to price action and volatility, with a filled zone highlighting trend strength. Buy/sell signals are plotted as labels, and stop-loss distances are displayed in ticks (customizable for instruments like MES). The indicator supports standard chart types for realistic signal generation.
How It Works
The indicator employs the following components:
Trend Line Calculation: A dynamic trend line is calculated using ATR adjusted by a user-defined multiplier, combined with either Money Flow Index (MFI) or Relative Strength Index (RSI) depending on volume availability. The line tracks price movements, adjusting upward or downward based on trend direction and volatility.
Trend Zone: The area between the current trend line and its value two bars prior is filled, colored green for bullish trends (upward movement) or red for bearish trends (downward movement), providing a visual cue of trend strength.
Signal Generation: Buy signals occur when the trend line crosses above its value two bars ago, and sell signals occur when it crosses below, with optional filtering to reduce signal noise (based on bar timing logic). Signals can be restricted to a 9:00–15:00 UTC trading window.
Stop-Loss Ticks: For each signal, the indicator calculates the distance to the trend line (acting as a stop-loss level) in ticks, using a user-defined tick size (default 0.25 for MES). These are displayed as labels below/above the signal.
Time Filter: An optional filter limits signals to 9:00–15:00 UTC, aligning with active trading sessions like the US market open.
The indicator ensures compatibility with standard chart types (e.g., candlestick or bar charts) to avoid unrealistic results associated with non-standard types like Heikin Ashi or Renko.
How to Use It
Add to Chart: Apply the indicator to a candlestick or bar chart on TradingView.
Configure Settings:
Multiplier: Adjust the ATR multiplier (default 1.0) to control trend line sensitivity. Higher values widen the stop-loss distance.
Common Period: Set the ATR and MFI/RSI period (default 14) for trend calculations.
No Volume Data: Enable if volume data is unavailable (e.g., for certain forex pairs), switching from MFI to RSI.
Tick Size: Set the tick size for stop-loss calculations (default 0.25 for MES futures).
Show Buy/Sell Signals: Toggle signal labels (default enabled).
Show Stop Loss Ticks: Toggle stop-loss tick labels (default enabled).
Use Time Filter: Restrict signals to 9:00–15:00 UTC (default disabled).
Use Filtered Signals: Enable to reduce signal frequency using bar timing logic (default enabled).
Interpret Signals:
Buy Signal: A blue “BUY” label below the bar indicates a potential long entry (trend line crossover, passing filters).
Sell Signal: A red “SELL” label above the bar indicates a potential short entry (trend line crossunder, passing filters).
Trend Zone: Green fill suggests bullish momentum; red fill suggests bearish momentum.
Stop-Loss Ticks: Gray labels show the stop-loss distance in ticks, helping with risk management.
Monitor Context: Use the trend line and filled zone to confirm the market’s direction before acting on signals.
Unique Features
Adaptive Trend Line: Combines ATR with MFI or RSI to create a responsive trend line that adjusts to volatility and market conditions.
Tick-Based Stop-Loss: Displays stop-loss distances in ticks, customizable for specific instruments, aiding precise risk management.
Signal Filtering: Optional bar timing logic reduces false signals, improving reliability in choppy markets.
Trend Zone Visualization: The filled zone between trend line values enhances trend clarity, making it easier to assess momentum.
Time-Restricted Trading: Optional 9:00–15:00 UTC filter aligns signals with high-liquidity sessions.
Notes
Use on standard candlestick or bar charts to ensure accurate signals.
Test the indicator on a demo account to optimize settings for your market and timeframe.
Combine with other analysis (e.g., support/resistance, volume spikes) for better decision-making.
The indicator is not a standalone system; use it as part of a broader trading strategy.
Limitations
Signals may lag in highly volatile or low-liquidity markets due to ATR-based calculations.
The 9:00–15:00 UTC time filter may not suit all markets; disable it for 24-hour assets like forex or crypto.
Stop-loss tick calculations assume consistent tick sizes; verify compatibility with your instrument.
This indicator is designed for traders seeking a robust, trend-following tool with customizable risk management and signal filtering, optimized for active trading sessions.

Simple Spread Viewer (con texto)Indica spread con numeros, en tiempo real. Ademas lo marca tambien con un grafico
