Daily Breakout + Daily Shadow By RouroThis script is a Pine v5 strategy designed to detect daily candle body breakouts and execute them on any intraday timeframe, while also providing:
Daily Data Retrieval
Using request.security(..., "D", ...) it fetches the OHLC and timestamp of the daily candle, regardless of the chart’s current timeframe.
Calculation of Yesterday’s and Day-Before-Yesterday’s Bodies
b1High and b1Low → the high/low of yesterday’s daily candle body
b2High and b2Low → the high/low of the previous day’s body
Detection of the First Intraday Bar After a New Day
By using ta.change(time("D")), it marks the start of each new trading day.
Drawing the Previous Day’s “Shadow” on the Chart
It overlays a box (box.new) and two wick lines (line.new) with configurable colors and transparency, so you can clearly see the full range of yesterday’s candle on any intraday chart.
Automatic End-of-Day Position Closure
It will automatically close any open position at the start of the next day to avoid unintended rollovers.
Entry Signals
On the very first intraday bar after the daily close:
Long if yesterday’s close broke above the body of the day before yesterday
Short if yesterday’s close broke below the body of the day before yesterday
…which triggers a strategy.entry at the intraday open.
Fully Customizable Stop-Loss and Take-Profit
SL options:
Opposite end of yesterday’s body
Fixed pips from entry
A risk-reward ratio on yesterday’s wick
Optional “safety SL” in fixed pips that overrides the above
TP options:
Fixed pips
Yesterday’s wick extreme (high/low)
Partial exit on the wick (TP1), then second exit (TP2) either:
At a multiplied RR
Or at the daily close (“Close of Day”)
You can also choose to move SL to breakeven after TP1 is hit.
Live Metrics Table
In the upper-right corner it displays in real time:
Start of backtest (date of first trade)
Number of ✅ Winning trades and ❌ Losing trades
Total number of trades
Win rate (%)
Profit Factor
All within a fixed table layout so it never runs out of rows or columns.
Chart patterns

Breakout Buy Alertupdate 3 in progress where we are trying to get current market price instead of close and open

XAUUSD Strategy with Visual DivergenceThis strategy is designed to capture high-probability trend-continuation trades on XAUUSD (Gold/US Dollar) by combining trend-following logic with momentum-based divergence detection. It uses the 200-period Exponential Moving Average (EMA) to filter for the prevailing trend and the Relative Strength Index (RSI) to identify bullish and bearish divergences as early entry signals. The strategy incorporates a risk-reward profile of 2:1, making it suitable for both swing and intra-day traders.

Ultimate Crossover Indicator (Tablolu & Bar Hizalı)Komut dosyası tüm geçerli indikatörleri orta ve kısa vade için toplu olarak grafik üzerinde gösteriyor. tablo üzerinde çizgi açıklamaları var. İnceleyip kullanabilirsiniz. :)
Ultimate Crossover Indicator (EMA, MACD, RSI, QQE, ATR)
📌 This indicator analyzes trend direction and momentum crossovers to generate the most reliable buy and sell signals.
✅ A live indicator panel is displayed at the top center of the chart showing real-time EMA, MACD, RSI, QQE, and ATR values.
✅ Indicators are aligned with price levels for better readability and accuracy.
✅ MACD and QQE crossovers confirm trend reversals with greater precision.
✅ RSI identifies overbought and oversold conditions to filter out false signals.
✅ ATR measures volatility, helping set safer stop-loss levels.
💡 Optimized for minute and hourly charts! This is a perfect tool for traders looking to enhance their market analysis on TradingView.
🚀 Use this indicator on TradingView to identify buy and sell opportunities more clearly! 📊
✅ This description is ready for publishing! Let me know if you need any refinements. 🚀😃

Likidite Avı + Dönüş Stratejisi (TP/SL + Zaman Bazlı)Checks if the previous top/bottom is pinned.
Then it generates a signal as soon as a sharp and opposite candle comes.
It looks for a reactionary reversal, not a pullback.
It gives fewer but more meaningful signals.
✅ Previous top/bottom pin (liquidity hunt)
✅ Immediately followed by a strong reversal candle
✅ And there is a signal system that gives these conditions instantly, together with the candle closing.

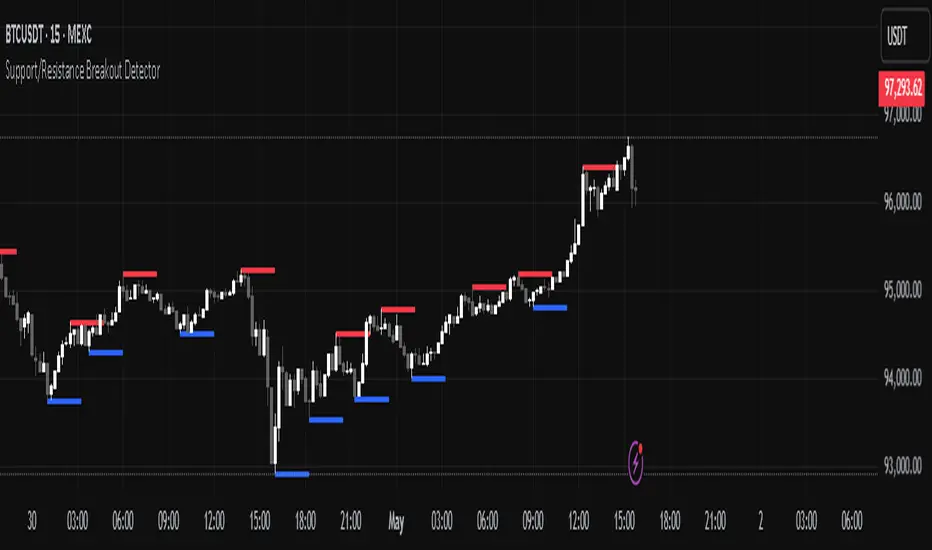
Support/Resistance Breakout DetectorThis indicator automatically detects and plots dynamic support and resistance levels using pivot highs and lows.
✅ It draws red resistance lines and blue support lines,
✅ The lines extend forward but automatically stop when the price touches them,
✅ It monitors for breakouts with strong volume,
✅ When a breakout happens, it shows labels like “B” or “Bull Wick” / “Bear Wick” on the chart,
✅ It also triggers alerts when support or resistance breaks with high volume.
Main settings:
Pivot lookback period
Show/hide breakout labels
Minimum volume for breakout
Maximum extension length for lines
This tool helps traders easily spot key price levels and watch for meaningful breakouts.
MAK Entry Zoneindicator("MAK Entry Zone", overlay=true)
// Detect MAK Reversal again
bearReversal = high > high and close < open
bullReversal = low < low and close > open
bearConfirm = bearReversal and close < close
bullConfirm = bullReversal and close > close
// Draw zone (line) at reversal candle's high/low
var line buyZoneLine = na
var line sellZoneLine = na
if (bullConfirm)
buyZoneLine := line.new(bar_index, low , bar_index + 20, low , color=color.green, style=line.style_dashed)
if (bearConfirm)
sellZoneLine := line.new(bar_index, high , bar_index + 20, high , color=color.red, style=line.style_dashed)

Origin + Surge Zone (v2 fixed)test inventory surge
Searches for 2 or more consecutive doji candles → marks this as "origin" (grey box).
Waits for 2 strong candles (bullish or bearish) → surge → records its high as TP.

Strict Origin Zone Detectorinventory theory indicator test
Searches for 2 or more consecutive doji candles → marks this as "origin" (grey box).
Waits for 2 strong candles (bullish or bearish) → surge → records its high as TP.

Major Trading SessionsThis script displays the trading sessions of the 3 markets that are relevant in crypto. US, UK, and Tokyo.

ICT Killzones & Pivots [TFO]shorten the date name
adjust to fit in JST time zone (fit for Japan based traders like me, who is early bird and can't trade at 10PM JST = NY open)


Multi-Symbol Trend DashboardMulti-Symbol Trend Dashboard - MA Cross Trend Monitor
Short Description
A customizable dashboard that displays trend direction across multiple symbols and timeframes using moving average crossovers.
Full Description
Overview
This Multi-Symbol Trend Dashboard allows you to monitor trend direction across 7 different symbols and 5 timeframes simultaneously in a single view. The dashboard uses moving average crossovers to determine trend direction, displaying bullish trends in green and bearish trends in red.
Key Features
Multi-Symbol Monitoring : Track up to 7 different trading instruments at once
Multi-Timeframe Analysis: View 5 different timeframes simultaneously for each instrument
Customizable Moving Averages: Choose between SMA, EMA, or WMA with adjustable periods
Visual Clarity: Color-coded cells provide immediate trend identification
Flexible Positioning: Place the dashboard anywhere on your chart
Customizable Appearance: Adjust sizes, colors, and text formatting
How It Works
The dashboard calculates a fast MA and slow MA for each symbol-timeframe combination. When the fast MA is above the slow MA, the cell shows green (bullish). When the fast MA is below the slow MA, the cell shows red (bearish).
Use Cases
Get a bird's-eye view of market trends across multiple instruments
Identify potential trading opportunities where multiple timeframes align
Monitor your watchlist without switching between charts
Spot divergences between related instruments
Track market breadth across sectors or related instruments
Notes and Limitations
Limited to 7 symbols and 5 timeframes due to TradingView's security request limits
Uses simple MA crossover as trend determination method
Dashboard is most effective when displayed on a dedicated chart
Performance may vary on lower-end devices due to multiple security requests
Settings Explanation
MA Settings: Configure the periods and types of moving averages
Display Settings: Adjust dashboard positioning and visual elements
Trading Instruments: Select which symbols to monitor (defaults to major forex pairs)
Timeframes: Choose which timeframes to display (default: M15, H1, H4, D1, W1)
Colors: Customize the color scheme for bullish/bearish indications and headers
This dashboard provides a straightforward way to maintain situational awareness across multiple markets and timeframes, helping traders identify potential setups and market conditions at a glance.

Session Levels + Boxes with LabelsDraws horizontal lines for the open and close of:
Asia Session
London Session
New York Session
Previous Day's New York Session
Auto-adjusts per daily session
Works on intraday timeframes (15m or lower preferred)

ES/MES 70% Confluence Strategy (9-Factor)✅ Included Features:
Entry signal only when 7 out of 9 indicators confirm (70%+ confluence)
15-minute Opening Range box from 9:30–9:45am ET, drawn clearly
VWAP + EMA 8/21/55 plotted for context
Risk/Reward box (5-point risk, 1:1 reward)
Stepwise trailing stop that moves every 5 points of profit
Buy/Sell alerts and debug labels to help you fine-tune
🧠 9 Indicators Used in Signal Score:
✅ EMA trend stack: 8 > 21 > 55
✅ Price above/below VWAP
✅ MACD Histogram momentum
✅ Stochastic RSI reversal
✅ Candle body > 60% of total range
✅ Volume > 20-bar average
✅ ATR rising
✅ Rejection of OR high/low
✅ Pullback near EMA 21 or VWAP (within 1 point)

ES/MES Hybrid VWAP + Confluence Strategy📋 Confluence Conditions (8 total):
Price above/below VWAP
EMA 21 > EMA 55 (or inverse)
MACD histogram momentum
Stoch RSI bounce/drop
Price near VWAP bounce (from your original logic)
Opening Range rejection
Candle strength (body % > 60%)
Volume spike
➡️ A signal triggers if 5 or more are true on the same bar.

ES/MES 65% Confluence Strategy📈 Designed for ES/MES intraday futures trading on 1–5 minute charts
✅ Signals a trade only when 65%+ of 8 confluence conditions are met
🔍 Confluence conditions include: trend alignment, momentum, price structure, VWAP proximity, volume, volatility, and candle strength
🕒 Uses the 15-minute Opening Range for breakout/reversal structure
🎯 Fixed 5-point stop loss and 5-point target with optional trailing stop every 5 points of profit
📦 Automatically displays risk/reward zones and dynamic trailing stop for each signal
⚠️ Includes alerts for Buy and Sell signal triggers
🧠 Suitable for traders who want structured entries based on multiple confirmation layers

2 Red + 1 Green Buy / 2 Green + 1 Red Sell Signalits give buy and sell signal special in gold usd which work well in houlry and 2 houlry chart not less then hourly also we see suptertrde and 50 sma for entry and exit ..
signal also genrate when only less then 15 point stoploss candle form

Aggregated Open Interest [Alpha Extract]The Aggregated Open Interest indicator provides a comprehensive view of open interest across multiple cryptocurrency exchanges, allowing traders to monitor institutional positioning and market sentiment. By aggregating data from major exchanges like Binance, BitMEX, and Kraken, this indicator offers valuable insights into potential price movements and market shifts.
🔶 CALCULATION
The indicator processes open interest data through multiple analytical methods:
Exchange Aggregation: Collects and normalizes open interest data from multiple exchanges (Binance, BitMEX, Kraken) with proper currency normalization.
Multi-Mode Analysis: Calculates various metrics including raw open interest values, OI change, OI delta, volume-weighted delta, and OI RSI.
Divergence Detection: Uses pivot point analysis to identify divergences between price action and open interest movements.
Activity Assessment: Tracks bullish and bearish activity patterns by correlating open interest changes with price movements.
Formula:
Aggregate OI = Sum of normalized open interest from selected exchanges
OI Change = Current OI - Previous OI
OI Delta = Net change in open interest across timeframes
OI Delta × Volume = OI Delta weighted by relative volume
OI RSI = Relative Strength Index applied to open interest values
OI Heatmap = Multi-timeframe visualization of OI changes across 7 distinct periods
🔶 DETAILS
Visual Features:
Open Interest: Candlestick representation of aggregated open interest
OI Change: Histogram showing period-to-period changes
OI Delta: Histogram displaying net OI movements
OI Delta × Volume: Volume-weighted OI delta for enhanced signals
OI RSI: Oscillator showing overbought/oversold OI conditions
OI Heatmap: Multi-timeframe visualization showing OI changes across 7 periods (3, 5, 8, 13, 21, 34, and 55 days)
Divergence Detection: Color-coded markers (teal for bullish, red for bearish) highlighting significant divergences between price and open interest
Analysis Table: Real-time summary of key metrics including aggregate OI, recent changes, and bullish/bearish activity.
Interpretation:
Increasing Open Interest + Rising Price: Strong bullish trend confirmation
Increasing Open Interest + Falling Price: Strong bearish trend confirmation
Decreasing Open Interest + Rising Price: Weak bullish trend (potential reversal)
Decreasing Open Interest + Falling Price: Weak bearish trend (potential reversal)
Divergences: Signal potential trend exhaustion and reversals when price moves in one direction while open interest moves in the opposite direction
Heatmap: Provides at-a-glance insight into open interest trends across multiple timeframes, with green bars indicating rising OI and red bars indicating falling OI
🔶 EXAMPLES
Trend Confirmation: Rising open interest accompanying a price increase confirms strong bullish momentum with institutional backing.
Example: During January-February 2025, rising OI during price advances confirms institutional participation in the uptrend.
Bearish Divergence: Price makes a higher high while open interest makes a lower high, signaling potential trend reversal.
Example: Red markers appear at market tops where price continues higher but open interest fails to confirm, preceding significant corrections.
Bullish Divergence : Price makes a lower low while open interest makes a higher low, indicating potential bottoming.
Example: Teal markers appear at market bottoms where price continues lower but open interest fails to confirm, preceding significant rallies.
OI Heatmap Analysis : Multiple timeframes showing consistent red signals across short to long-term periods indicate strong institutional selling pressure.
Example: When all 7 periods (3-55 days) show red during a price uptrend, this signals institutional selling into retail strength, often preceding major corrections.
🔶 SETTINGS
Customization Options:
Data Sources: Toggle different exchanges (Binance USDT/USD/BUSD, BitMEX USD/USDT, Kraken USD)
Display Mode: Choose between Open Interest, OI Change, OI Delta, OI Delta × Volume, OI RSI, and OI Heatmap
Currency Units: Display in USD or base cryptocurrency (COIN)
Analysis Tools: Moving Average (length and color), RSI (length and color)
Divergence Detection: Enable/disable signals, adjust lookback period and threshold percentage, customize bullish/bearish divergence colors
OI Heatmap Colors: Customize bullish (green) and bearish (red) signal colors for the multi-timeframe heatmap visualization
The Aggregated Open Interest indicator provides traders with comprehensive insights into institutional positioning across major exchanges, helping identify potential trend continuations, reversals, and key market turning points driven by smart money movements. The addition of the OI Heatmap feature enables traders to quickly visualize open interest trends across multiple timeframes, providing valuable context for institutional positioning over different market cycles.

15m ATR Target (Long-Only)15m ATR Target (Long-Only) Indicator
Overview
This custom indicator combines two powerful intraday tools into one clean overlay:
10-Minute Opening Range Breakout (ORB) – Yellow dashed lines marking the high and low of the first 10 minutes after your chosen session start.
15-Minute ATR Target – A green dotted line set at (15-min block close + ATR), recalculated and redrawn every 15 minutes.
Together, they give you both a classic ORB framework and a volatility-based price target for long entries.
How It Works
1. Define Your Session Start
You choose the clock time (e.g. 9:30 AM). From that moment:
For the next 10 minutes, the indicator records the highest high and lowest low.
2. Draw the 10-Minute ORB Lines
As soon as those 10 minutes pass, two yellow dashed horizontal lines appear at the OR high and low, extending right across your chart. These mark your key breakout levels.
3. Split the Day into 15-Minute Blocks
Independently, the day is also broken into fixed 15-minute intervals (e.g. 9:00–9:15, 9:15–9:30, etc.).
4. Measure ATR in Each Block
For each 15-min window, the script calculates the Average True Range over that block’s bars—a gauge of how much price typically moves within 15 minutes.
5. Capture Each Block’s Close
When the clock ticks past each 15-min boundary, the script notes that block’s closing price.
6. Plot the ATR-Based Target
Immediately after each 15-min block, a green dotted line is drawn at (block close + ATR). This line extends forward a set number of bars, giving you a dynamic upper-target level for long trades.
7. Auto-Refresh & Alerts
Both the ORB lines and ATR target update automatically:
8. The ORB lines appear once at the 10-min mark and persist all day.
The ATR target line deletes and redraws every 15 minutes, so you’re always seeing the latest volatility-adjusted target. You can also enable an alert to ping you the moment price crosses above the ATR target.
Why Use It?
Opening Range Clarity: The 10-min ORB is a widely used breakout setup; these yellow lines give you clear entry and stop levels.
Volatility-Adaptive Targets: The ATR-based green line adjusts to current market chop or calm, so your profit targets stay relevant.
Long-Only Focus: Everything is designed around catching upside breakouts—ideal for bulls and momentum traders.
Fully Automated: No manual drawing or recalculation—just add it and trade its levels.
Ideal For:
Intraday traders looking for volatility-based, long-only entry targets incorporating an ORB strategy.
Anyone who wants an objective way to gauge whether price has moved “beyond normal” and is ready to run further.
Volatility-Adaptive Targets: The ATR-based green line adjusts to current market chop or calm, so your profit targets stay relevant.
Long-Only Focus: Everything is designed around catching upside breakouts—ideal for bulls and momentum traders.
Fully Automated: No manual drawing or recalculation—just add it and trade its levels.
Add the 15m ATR Target to your chart today and start spotting volatility-backed, long-only opportunities with confidence!


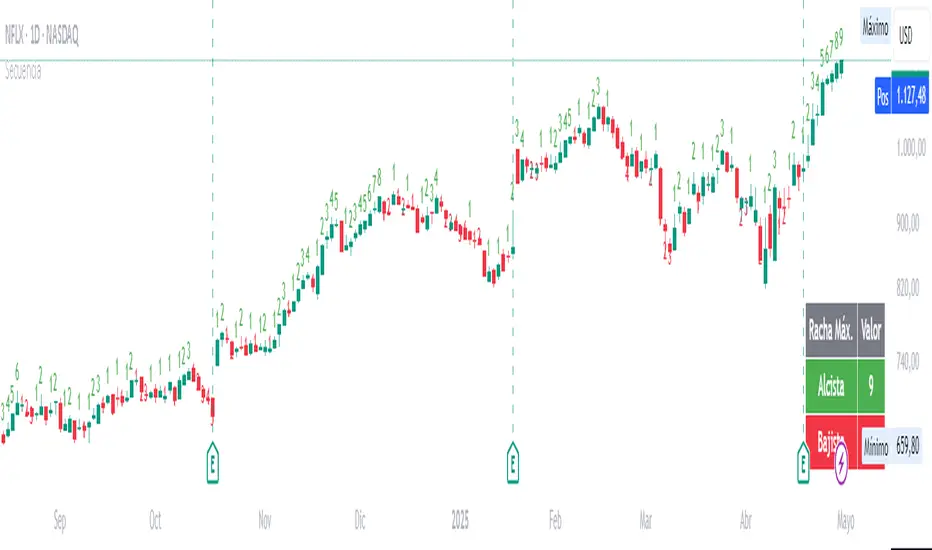
Candle SequenceLooking to easily identify moments of strong market conviction? "Racha Velas" (or your chosen English name like "Consecutive Candles Streak") allows you to visualize clearly and directly sequences of consecutive bullish and bearish candles.
**Key Features:**
* **Real-time Counting:** Displays the number of consecutive candles directly on the chart.
* **Visual Customization:** Adjust the text size and color for optimal visualization.
* **Vertical Offset:** Control the position of the counter to avoid obstructions.
* **Maximum Streaks Table (Optional):** Visualize the largest bullish and bearish streaks found in the chart's history, useful for understanding volatility and price behavior.
* **Easy to Use:** Simply add the indicator to your chart and start analyzing.
This indicator is a valuable tool for traders looking to confirm trends, identify potential exhaustion points, or simply understand price dynamics at a glance. Give it a try and discover the market's streaks!
*****************************************************************************************************
¿Buscas identificar momentos de fuerte convicción del mercado? "Racha Velas" te permite visualizar de forma clara y directa las secuencias de velas consecutivas alcistas y bajistas.
**Características principales:**
* **Conteo en Tiempo Real:** Muestra el número de velas consecutivas directamente en el gráfico.
* **Personalización Visual:** Ajusta el tamaño y color del texto para una visualización óptima.
* **Offset Vertical:** Controla la posición del contador para evitar obstrucciones.
* **Tabla de Rachas Máximas (Opcional):** Visualiza las mayores rachas alcistas y bajistas encontradas en el historial del gráfico, útil para entender la volatilidad y el comportamiento del precio.
* **Fácil de Usar:** Simplemente añade el indicador a tu gráfico y comienza a analizar.
Este indicador es una herramienta valiosa para traders que buscan confirmar tendencias, identificar posibles agotamientos o simplemente entender la dinámica del precio en un vistazo. ¡Pruébalo y descubre las rachas del mercado!
SuperFib Enhanced (Array Only)Key Changes:
Removed MAX_LINES and defined const int MAX_STORAGE_CAPACITY = 200 (You can adjust 200 higher or lower, but be mindful of the total drawings limit).
Removed all individual inputs (show1-show10, price1-price10, text1-text10) and their corresponding groups. The array input is now the only way to define levels.
Removed the useArrayInput boolean input, as it's no longer needed.
Initialized var hLines and var lineLabels arrays with MAX_STORAGE_CAPACITY.
Modified the array parsing loop to respect MAX_STORAGE_CAPACITY when adding parsed levels.
Modified the main drawing loop (if barstate.islast) to iterate from 0 up to
MAX_STORAGE_CAPACITY - 1. Inside the loop, it checks if i < parsedLevelsCount to determine if a line should exist at that index.
Modified the real-time update loop (if barstate.isrealtime) to also iterate up to MAX_STORAGE_CAPACITY - 1 to handle any potential drawing index within the indicator's capacity.
Updated the tooltips for the array inputs to reflect that this is the primary method and mention the (increased) capacity limit.
This version is more flexible for users who rely heavily on array input, allowing them to define up to 200 levels. Remember that while the indicator itself can manage 200, the total drawings on your chart from all sources still cannot exceed Pine Script's platform-wide limit.
