ATR-BHEEM-NOCHANGE-CANDLESCandles remain normal — removed barcolor(barCol)
ATR trailing stop line still shows trend direction (green/red)
Optional buy/sell labels added only when trend flips
Clean and ready for intraday 1-min charts
Chart patterns

ATR Trailing Stop Without tradepanel Open✅ Only plots ATR trailing stop line
✅ Only colors candles
✅ No trades / entries
✅ No “Strategy Tester” panel
✅ No arrows, markers, or trade lists

Forecast PriceTime Oracle [CHE] Forecast PriceTime Oracle — Prioritizes quality over quantity by using Power Pivots via RSI %B metric to forecast future pivot highs/lows in price and time
Summary
This indicator identifies potential pivot highs and lows based on out-of-bounds conditions in a modified RSI %B metric, then projects future occurrences by estimating time intervals and price changes from historical medians. It provides visual forecasts via diagonal and horizontal lines, tracks achievement with color changes and symbols, and displays a dashboard for statistical overview including hit rates. Signals are robust due to median-based aggregation, which reduces outlier influence, and optional tolerance settings for near-misses, making it suitable for anticipating reversals in ranging or trending markets.
Motivation: Why this design?
Standard pivot detection often lags or generates false signals in volatile conditions, missing the timing of true extrema. This design leverages out-of-bounds excursions in RSI %B to capture "Power Pivots" early—focusing on quality over quantity by prioritizing significant extrema rather than every minor swing—then uses historical deltas in time and price to forecast the next ones, addressing the need for proactive rather than reactive analysis. It assumes that pivot spacing follows statistical patterns, allowing users to prepare entries or exits ahead of confirmation.
What’s different vs. standard approaches?
- Reference baseline: Diverges from traditional ta.pivothigh/low, which require fixed left/right lengths and confirm only after bars close, often too late for dynamic markets.
- Architecture differences:
- Detects extrema during OOB runs rather than post-bar symmetry.
- Aggregates deltas via medians (or alternatives) over a user-defined history, capping arrays to manage resources.
- Applies tolerance thresholds for hit detection, with options for percentage, absolute, or volatility-adjusted (ATR) flexibility.
- Freezes achieved forecasts with visual states to avoid clutter.
- Practical effect: Charts show proactive dashed projections instead of retrospective dots; the dashboard reveals evolving hit rates, helping users gauge reliability over time without manual calculation.
How it works (technical)
The indicator first computes a smoothed RSI over a specified length, then applies Bollinger Bands to derive %B, flagging out-of-bounds below zero or above one hundred as potential run starts. During these runs, it tracks the extreme high or low price and bar index. Upon exit from the OOB state, it confirms the Power Pivot at that extreme and records the time delta (bars since prior) and price change percentage to rolling arrays.
For forecasts, it calculates the median (or selected statistic) of recent deltas, subtracts the confirmation delay (bars from apex to exit), and projects ahead by that adjusted amount. Price targets use the median change applied to the origin pivot value. Lines are drawn from the apex to the target bar and price, with a short horizontal at the endpoint. Arrays store up to five active forecasts, pruning oldest on overflow.
Tolerance adjusts hit checks: for highs, if the high reaches or exceeds the target (adjusted by tolerance); for lows, if the low drops to or below. Once hit, the forecast freezes, changing colors and symbols, and extends the horizontal to the hit bar. Persistent variables maintain last pivot states across bars; arrays initialize empty and grow until capped at history length.
Parameter Guide
Source: Specifies the data input for the RSI computation, influencing how price action is captured. Default is close. For conservative signals in noisy environments, switch to high; using low boosts responsiveness but may increase false positives.
RSI Length: Sets the smoothing period for the RSI calculation, with longer values helping to filter out whipsaws. Default is 32. Opt for shorter lengths like 14 to 21 on faster timeframes for quicker reactions, or extend to 50 or more in strong trends to enhance stability at the cost of some lag.
BB Length: Defines the period for the Bollinger Bands applied to %B, directly affecting how often out-of-bounds conditions are triggered. Default is 20. Align it with the RSI length: shorter periods detect more potential runs but risk added noise, while longer ones provide better filtering yet might overlook emerging extrema.
BB StdDev: Controls the multiplier for the standard deviation in the bands, where wider settings reduce false out-of-bounds alerts. Default is 2.0. Narrow it to 1.5 for highly volatile assets to catch more signals, or broaden to 2.5 or higher to emphasize only major movements.
Show Price Forecast: Enables or disables the display of diagonal and target lines along with their updates. Default is true. Turn it off for simpler chart views, or keep it on to aid in trade planning.
History Length: Determines the number of recent pivot samples used for median-based statistics, where more history leads to smoother but potentially less current estimates. Default is 50. Start with a minimum of 5 to build data; limit to 100 to 200 to prevent outdated regimes from skewing results.
Max Lookahead: Limits the number of bars projected forward to avoid overly extended lines. Default is 500. Reduce to 100 to 200 for intraday focus, or increase for longer swing horizons.
Stat Method: Selects the aggregation technique for time and price deltas: Median for robustness against outliers, Trimmed Mean (20%) for a balanced trim of extremes, or 75th Percentile for a conservative upward tilt. Default is Median. Use Median for even distributions; switch to Percentile when emphasizing potential upside in trending conditions.
Tolerance Type: Chooses the approach for flexible hit detection: None for exact matches, Percentage for relative adjustments, Absolute for fixed point offsets, or ATR for scaling with volatility. Default is None. Begin with Percentage at 0.5 percent for currency pairs, or ATR for adapting to cryptocurrency swings.
Tolerance %: Provides the relative buffer when using Percentage mode, forgiving small deviations. Default is 0.5. Set between 0.2 and 1.0 percent; higher values accommodate gaps but can overstate hit counts.
Tolerance Points: Establishes a fixed offset in price units for Absolute mode. Default is 0.0010. Tailor to the asset, such as 0.0001 for forex pairs, and validate against past wick behavior.
ATR Length: Specifies the period for the Average True Range in dynamic tolerance calculations. Default is 14. This is the standard setting; shorten to 10 to reflect more recent volatility.
ATR Multiplier: Adjusts the ATR scale for tolerance width in ATR mode. Default is 0.5. Range from 0.3 for tighter precision to 0.8 for greater leniency.
Dashboard Location: Positions the summary table on the chart. Default is Bottom Right. Consider Top Left for better visibility on mobile devices.
Dashboard Size: Controls the text scaling for dashboard readability. Default is Normal. Choose Tiny for dense overlays or Large for detailed review sessions.
Text/Frame Color: Sets the color scheme for dashboard text and borders. Default is gray. Align with your chart theme, opting for lighter shades on dark backgrounds.
Reading & Interpretation
Forecast lines appear as dashed diagonals from confirmed pivots to projected targets, with solid horizontals at endpoints marking price levels. Open targets show a target symbol (🎯); achieved ones switch to a trophy symbol (🏆) in gray, with lines fading to gray. The dashboard summarizes median time/price deltas, sample counts, and hit rates—rising rates indicate improving forecast alignment. Colors differentiate highs (red) from lows (lime); frozen states signal validated projections.
Practical Workflows & Combinations
- Trend following: Enter long on low forecast hits during uptrends (higher highs/lower lows structure); filter with EMA crossovers to ignore counter-trend signals.
- Reversal setups: Short above high projections in overextended rallies; use volume spikes as confirmation to reduce false breaks.
- Exits/Stops: Trail stops to prior pivot lows; conservative on low hit rates (below 50%), aggressive above 70% with tight tolerance.
- Multi-TF: Apply on 1H for entries, 4H for time projections; combine with Ichimoku clouds for confluence on targets.
- Risk management: Position size inversely to delta uncertainty (wider history = smaller bets); avoid low-liquidity sessions.
Behavior, Constraints & Performance
Confirmation occurs on OOB exit, so live-bar pivots may adjust until close, but projections update only on events to minimize repaint. No security or HTF calls, so no external lookahead issues. Arrays cap at history length with shifts; forecasts limited to five active, pruning FIFO. Loops iterate over small fixed sizes (e.g., up to 50 for stats), efficient on most hardware. Max lines/labels at 500 prevent overflow.
Known limits: Sensitive to OOB parameter tuning—too tight misses runs; assumes stationary pivot stats, which may shift in regime changes like low vol. Gaps or holidays distort time deltas.
Sensible Defaults & Quick Tuning
Defaults suit forex/crypto on 1H–4H: RSI 32/BB 20 for balanced detection, Median stats over 50 samples, None tolerance for exactness.
- Too many false runs: Increase BB StdDev to 2.5 or RSI Length to 50 for filtering.
- Lagging forecasts: Shorten History Length to 20; switch to 75th Percentile for forward bias.
- Missed near-hits: Enable Percentage tolerance at 0.3% to capture wicks without overcounting.
- Cluttered charts: Reduce Max Lookahead to 200; disable dashboard on lower TFs.
What this indicator is—and isn’t
This is a forecasting visualization layer for pivot-based analysis, highlighting statistical projections from historical patterns. It is not a standalone system—pair with price action, volume, and risk rules. Not predictive of all turns; focuses on OOB-derived extrema, ignoring volume or news impacts.
Disclaimer
The content provided, including all code and materials, is strictly for educational and informational purposes only. It is not intended as, and should not be interpreted as, financial advice, a recommendation to buy or sell any financial instrument, or an offer of any financial product or service. All strategies, tools, and examples discussed are provided for illustrative purposes to demonstrate coding techniques and the functionality of Pine Script within a trading context.
Any results from strategies or tools provided are hypothetical, and past performance is not indicative of future results. Trading and investing involve high risk, including the potential loss of principal, and may not be suitable for all individuals. Before making any trading decisions, please consult with a qualified financial professional to understand the risks involved.
By using this script, you acknowledge and agree that any trading decisions are made solely at your discretion and risk.
Do not use this indicator on Heikin-Ashi, Renko, Kagi, Point-and-Figure, or Range charts, as these chart types can produce unrealistic results for signal markers and alerts.
Best regards and happy trading
Chervolino

HELAL TRICKS FOREX NY TimeThe indicator marks the New York session opening candle at 9:30 AM (New York time), drawing horizontal lines at its high and low. These levels remain visible until 7:00 PM, helping traders identify key breakout and reversal zones during the most volatile session of the day. Developed by Helal – Tricks Forex, this tool simplifies New York session analysis for smarter intraday trading decisions.

Herd Flow Oscillator — Volume Distribution Herd Flow Oscillator — Scientific Volume Distribution (herd-accurate rev)
A composite order-flow oscillator designed to surface true herding behavior — not just random bursts of buying or selling.
It’s built to detect when market participants start acting together, showing persistent, one-sided activity that statistically breaks away from normal market randomness.
Unlike traditional volume or momentum indicators, this tool doesn’t just look for “who’s buying” or “who’s selling.”
It tries to quantify crowd behavior by blending multiple statistical tests that describe how collective sentiment and coordination unfold in price and volume dynamics.
What it shows
The Herd Flow Oscillator works as a multi-layer detector of crowd-driven flow in the market. It examines how signed volume (buy vs. sell pressure) evolves, how persistent it is, and whether those actions are unusually coordinated compared to random expectations.
HerdFlow Composite (z) — the main signal line, showing how statistically extreme the current herding pressure is.
When this crosses above or below your set thresholds, it suggests a high probability of collective buying or selling.
You can optionally reveal component panels for deeper insight into why herding is detected:
DVI (Directional Volume Imbalance): Measures the ratio of bullish vs. bearish volume.
If it’s strongly positive, more volume is hitting the ask (buying); if negative, more is hitting the bid (selling).
LSV-style Herd Index : Inspired by academic finance measures of “herding.”
It compares how often volume is buying vs. selling versus what would happen by random chance.
If the result is significantly above chance, it means traders are collectively biased in one direction.
O rder-Flow Persistence (ρ 1..K): Averages autocorrelation of signed volume over several lags.
In simpler terms: checks if buying/selling pressure tends to continue in the same direction across bars.
Positive persistence = ongoing coordination, not just isolated trades.
Runs-Test Herding (−Z) : Statistical test that checks how often trade direction flips.
When there are fewer direction changes than expected, it means trades are clustering — a hallmark of herd behavior.
Skew (signed volume): Measures whether signed volume is heavily tilted to one side.
A positive skew means more aggressive buying bursts; a negative skew means more intense selling bursts.
CVD Slope (z): Looks at the slope of the Cumulative Volume Delta — essentially how quickly buy/sell pressure is accelerating.
It’s a short-term flow acceleration measure.
Shapes & background
▲ “BH” at the bottom = Bull Herding; ▼ “BH-” at the top = Bear Herding.
These markers appear when all conditions align to confirm a herding regime.
Persistence and clustering both confirm coordinated downside flow.
Core Windows
Primary Window (N) — the main sample length for herding calculations.
It’s like the "memory span" for detecting coordinated behavior. A longer N means smoother, more reliable signals.
Short Window (Nshort) — used for short-term measurements like imbalance and slope.
Smaller values react faster but can be noisy; larger values are steadier but slower.
Long Window (Nlong) — used for z-score normalization (statistical scaling).
This helps the indicator understand what’s “normal” behavior over a longer horizon, so it can spot when things deviate too far.
Autocorr lags (acLags) — how many steps to check when measuring persistence.
Higher values (e.g., 3–5) look further back to see if trends are truly continuing.
Calculation Options
Price Proxy for Tick Rule — defines how to decide if a trade is “buy” or “sell.”
hlc3 (average of high, low, and close) works as a neutral, smooth price proxy.
Use ATR for scaling — keeps signals comparable across assets and timeframes by dividing by volatility (ATR).
Prevents high-volatility periods from dominating the signal.
Median Filter (bars) — smooths out erratic data spikes without heavily lagging the response.
Odd values like 3 or 5 work best.
Signal Thresholds
Composite z-threshold — determines how extreme behavior must be before it counts as “herding.”
Higher values = fewer, more confident signals.
Imbalance threshold — the minimum directional volume imbalance to trigger interest.
Plotting
Show component panels — useful for analysts and developers who want to inspect the math behind signals.
Fill strong herding zones — purely visual aid to highlight key periods of coordinated trading.
How to use it (practical tips)
Understand the purpose: This is not just a “buy/sell” tool.
It’s a behavioral detector that identifies when traders or algorithms start acting in the same direction.
Timeframe flexibility:
15m–1h: reveals short-term crowd shifts.
4h–1D: better for swing-trade context and institutional positioning.
Combine with structure or trend:
When HerdFlow confirms a bullish regime during a breakout or retest, it adds confidence.
Conversely, a bearish cluster at resistance may hint at a crowd-driven rejection.
Threshold tuning:
To make it more selective, increase zThr and imbThr.
To make it more sensitive, lower those thresholds but expand your primary window N for smoother results.
Cross-market consistency:
Keep “Use ATR for scaling” enabled to maintain consistency across different instruments or timeframes.
Denoising:
A small median filter (3–5 bars) removes flicker from volume spikes but still preserves the essential crowd patterns.
Reading the components (why signals fire)
Each sub-metric describes a unique “dimension” of crowd behavior:
DVI: how imbalanced buying vs selling is.
Herd Index: how biased that imbalance is compared to random expectation.
Persistence (ρ): how continuous those flows are.
Runs-Test: how clumped together trades are — clustering means the crowd’s acting in sync.
Skew: how lopsided the volume distribution is — sudden surges of one-sided aggression.
CVD Slope: how strongly accelerating the current directional flow is.
When all of these line up, you’re seeing evidence that market participants are collectively moving in the same direction — i.e., true herding.
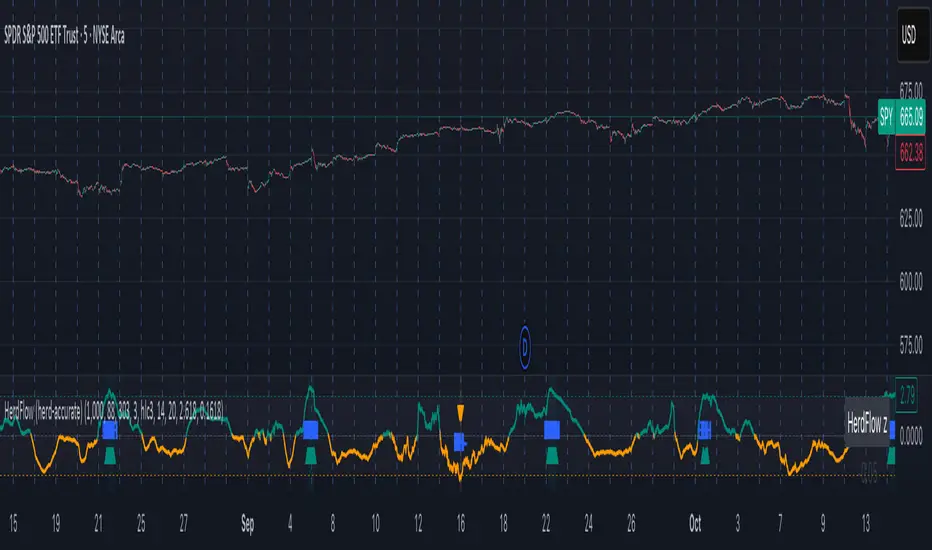

Image Plotter [theUltimator5]Image Plotter is a visual alerting tool that drops fun, high-contrast ASCII (braille) art (e.g., Rocket, Cat “hang in there”, Babe Ruth, etc.) directly on your price chart when a technical trigger fires. It’s designed for quick, glanceable callouts without cluttering your chart with lines or sub-indicators.
If there are any specific images you would like to be able to add to your plot, please comment with the image you want to see and if it is reasonable, I will add it.
How it works
On each bar close, the script evaluates your selected Trigger Source. When the condition is true, it places a label that contains the selected ASCII art at a configurable offset above or below the candle.
You can choose to only keep the most recent art on the chart, or accumulate every trigger as a historical breadcrumb trail.
Positioning uses either the bar’s high (for above-candle placements) or low (for below-candle placements), then applies your vertical % offset and horizontal bar shift.
Inputs & Controls
Trigger Source
Select which condition will fire the ASCII placement:
RSI Oversold / Overbought — Triggers on cross through the threshold (under/over).
MACD Bullish Cross / Bearish Cross — MACD line crossing the Signal line.
BB Lower Touch / BB Upper Touch — Price crossing below the lower band / above the upper band.
Stochastic Oversold / Overbought — %K crossing through your thresholds.
Volume Spike — Current volume > (Volume MA × Spike Multiplier).
Price Cross MA — Close crossing above the chosen moving average (bullish only).
Custom Condition — Optional user condition (see “Custom Condition” below).
Plot Mode
Latest Only — The indicator deletes the previous label and keeps only the newest trigger on chart.
Every Trigger — Leaves all triggered labels on the chart (historical markers).
Note: TradingView caps the number of labels per script; this indicator sets max_labels_count=500. Heavy triggering can still hit limits.
Practical usage tips
Choose “Latest Only” for cleanliness if your trigger is frequent. Use “Every Trigger” when you want a visual audit trail.
Tune vertical offset by symbol — low-priced tickers may need a smaller %; volatile names may need more spacing.
Quick start
Add the indicator to any chart (any timeframe).
Pick a Trigger Source (e.g., RSI Oversold) and set thresholds/lengths.
Choose ASCII Image, Position Above/Below, Offsets, and Plot Mode.
(Optional) Enable Custom Condition and select your Custom Plot Source.
Create an Alert on “ASCII Trigger Alert” using Once Per Bar Close.
Have a variant you’d like (e.g., bearish MA cross, multi-alert pack by trigger, or time-window filters)? Tell me what workflow you want and I’ll tailor the script/description to match.

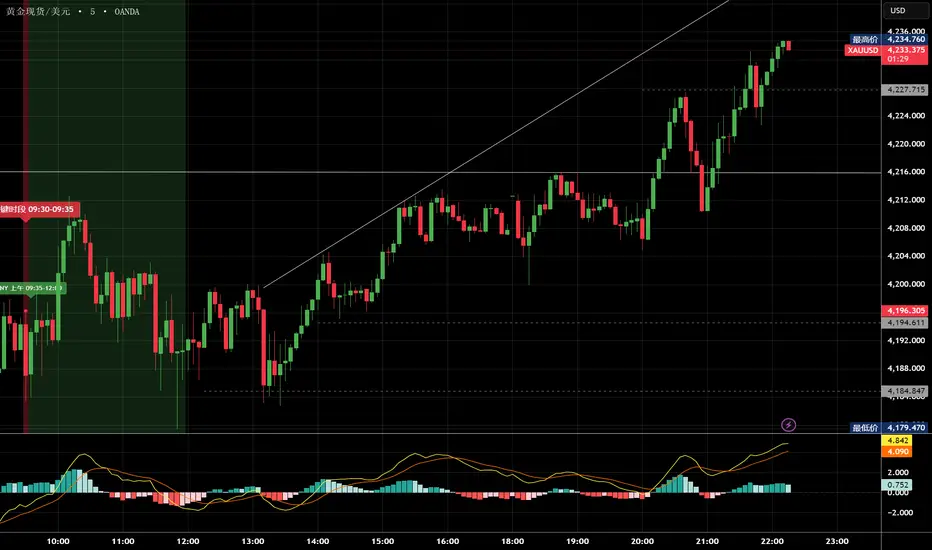
Mark the New York trading session hours(纽约交易时间段标注)Apply background shading for New York time.
(纽约时间背景着色)
04:00 ~ 09:00
09:00 ~ 09:30
09:30 ~ 12:00
No shading needed after 12 AM as I'll be asleep.
(12点我睡觉了就不着色了。)
REMS Synergy OverlayThis 3rd generation REMS indicator builds upon the foundations assessing the relationships between RSI, EMAs, MACDs, and Stochastic RSI across multiple timeframes. Designed to help traders identify less frequent, but high probability entries across 2 time frames. Uses 3 levels of confluence indicators for both long and short moves.
Confluence Level 1 (Highest Conviction):
Evaluates selected criteria across both timeframes. All selected criteria must be in confluence to trigger signal.
Confluence Level 2 (Moderate Conviction):
Selected criteria can be selected by each timeframe individually. All selected criteria must be in confluence to trigger signal.
Confluence Level 3 (Lower/supportive confluence):
Of the selected criteria, this level can evaluate a set number of conditions that must be met. Number of conditions is user-defined.
Includes VWAP and 4 EMAs as optional visual representations.
Includes 'Enhanced Candles' than can colour code candlesticks for better visual identification. (off by default)
Originally designed with 5 minute and 2 minute timeframes in mind, and pairs well with REMS First Strike and/or REMS Snap Shot indicators.
Values coded below:
RSI
-Primary: Length = 14, Smoothing = 20 (via SMA)
-Secondary: Length = 7, Smoothing = 20 (via SMA)
Stochastic RSI
Primary:
-RSI Length = 14
-Stochastic Length = 8
-%K = 3, %D = 3
Secondary:
-RSI Length = 7
-Stochastic Length = 7
-%K = 3, %D = 2
MACD - applied to both timeframes
-Fast = 12, Slow = 26, Signal = 9

Friday & Monday HighlighterFriday & Monday Institutional Range Marker — Know Where Big Firms Set the Trap!
🧠 Description
This indicator automatically highlights Friday and Monday sessions on your chart — days when institutional players and algorithmic firms (like Citadel, Jane Street, or Tower Research) quietly shape the upcoming week’s price structure.
🔍 Why Friday & Monday matter
Friday : Large institutions often book profits or hedge into the weekend. Their final-hour moves reveal the next week’s bias.
Monday : Big players rebuild positions, absorbing liquidity left behind by retail traders.
Together, these two days define the range traps and breakout zones that often control price action until midweek.
> In short, the Friday–Monday high and low often act as invisible walls — guiding scalpers, option sellers, and swing traders alike.
🧩 What this tool does
✅ Highlights Friday (red) and Monday (green) sessions
✅ Adds optional day labels above bars
✅ Works across all timeframes (best on 15min to 1hr charts)
✅ Helps you visually identify where institutions likely built their positions
Use it to quickly spot:
* Range boundaries that trap traders
* Gap zones likely to get filled
* High–low sweeps before reversals
⚙️ Recommended Use
1. Mark Friday’s high–low → Watch for liquidity sweeps on Monday.
2. When Monday holds above Friday’s high , breakout continuation is likely.
3. When Monday fails below Friday’s low , expect a reversal or trap.
4. Combine this with OI shifts, IV crush, and FII–DII flow data for confirmation.
⚠️ Disclaimer
This indicator is for **educational and analytical purposes only**.
It does **not constitute financial advice** or a trading signal.
Markets are dynamic — always perform your own research before trading or investing.

3D Candles (Zeiierman)█ Overview
3D Candles (Zeiierman) is a unique 3D take on classic candlesticks, offering a fresh, high-clarity way to visualize price action directly on your chart. Visualizing price in alternative ways can help traders interpret the same data differently and potentially gain a new perspective.
█ How It Works
⚪ 3D Body Construction
For each bar, the script computes the candle body (open/close bounds), then projects a top face offset by a depth amount. The depth is proportional to that candle’s high–low range, so it looks consistent across symbols with different prices/precisions.
rng = math.max(1e-10, high - low ) // candle range
depthMag = rng * depthPct * factorMag // % of range, shaped by tilt amount
depth = depthMag * factorSign // direction from dev (up/down)
depthPct → how “thick” the 3D effect is, as a % of each candle’s own range.
factorMag → scales the effect based on your tilt input (dev), with a smooth curve so small tilts still show.
factorSign → applies the direction of the tilt (up or down).
⚪ Tilt & Perspective
Tilt is controlled by dev and translated into a gentle perspective factor:
slope = (4.0 * math.abs(dev)) / width
factorMag = math.pow(math.min(1.0, slope), 0.5) // sqrt softens response
factorSign = dev == 0 ? 0.0 : math.sign(dev) // direction (up/down)
Larger dev → stronger 3D presence (up to a cap).
The square-root curve makes small dev values noticeable without overdoing it.
█ How to Use
Traders can use 3D Candles just like regular candlesticks. The difference is the 3D visualization, which can broaden your view and help you notice price behavior from a fresh perspective.
⚪ Quick setup (dual-view):
Split your TradingView layout into two synchronized charts.
Right pane: keep your standard candlestick or bar chart for live execution.
Left pane: add 3D Candles (Zeiierman) to compare the same symbol/timeframe.
Observe differences: the 3D rendering can make expansion/contraction and body emphasis easier to spot at a glance.
█ Go Full 3D
Take the experience further by pairing 3D Candles (Zeiierman) with Volume Profile 3D (Zeiierman) , a perfect complement that shows where activity is concentrated, while your 3D candles show how the price unfolded.
█ Settings
Candles — How many 3D candles to draw. Higher values draw more shapes and may impact performance on slower machines.
Block Width (bars) — Visual thickness of each 3D candle along the x-axis. Larger values look chunkier but can overlap more.
Up/Down — Controls the tilt and strength of the 3D top face.
3D depth (% of range) — Thickness of the 3D effect as a percentage of each candle’s own high–low range. Larger values exaggerate the depth.
-----------------
Disclaimer
The content provided in my scripts, indicators, ideas, algorithms, and systems is for educational and informational purposes only. It does not constitute financial advice, investment recommendations, or a solicitation to buy or sell any financial instruments. I will not accept liability for any loss or damage, including without limitation any loss of profit, which may arise directly or indirectly from the use of or reliance on such information.
All investments involve risk, and the past performance of a security, industry, sector, market, financial product, trading strategy, backtest, or individual's trading does not guarantee future results or returns. Investors are fully responsible for any investment decisions they make. Such decisions should be based solely on an evaluation of their financial circumstances, investment objectives, risk tolerance, and liquidity needs.

Seasonality Heatmap [QuantAlgo]🟢 Overview
The Seasonality Heatmap analyzes years of historical data to reveal which months and weekdays have consistently produced gains or losses, displaying results through color-coded tables with statistical metrics like consistency scores (1-10 rating) and positive occurrence rates. By calculating average returns for each calendar month and day-of-week combination, it identifies recognizable seasonal patterns (such as which months or weekdays tend to rally versus decline) and synthesizes this into actionable buy low/sell high timing possibilities for strategic entries and exits. This helps traders and investors spot high-probability seasonal windows where assets have historically shown strength or weakness, enabling them to align positions with recurring bull and bear market patterns.
🟢 How It Works
1. Monthly Heatmap
How % Return is Calculated:
The indicator fetches monthly closing prices (or Open/High/Low based on user selection) and calculates the percentage change from the previous month:
(Current Month Price - Previous Month Price) / Previous Month Price × 100
Each cell in the heatmap represents one month's return in a specific year, creating a multi-year historical view
Colors indicate performance intensity: greener/brighter shades for higher positive returns, redder/brighter shades for larger negative returns
What Averages Mean:
The "Avg %" row displays the arithmetic mean of all historical returns for each calendar month (e.g., averaging all Januaries together, all Februaries together, etc.)
This metric identifies historically recurring patterns by showing which months have tended to rise or fall on average
Positive averages indicate months that have typically trended upward; negative averages indicate historically weaker months
Example: If April shows +18.56% average, it means April has averaged a 18.56% gain across all years analyzed
What Months Up % Mean:
Shows the percentage of historical occurrences where that month had a positive return (closed higher than the previous month)
Calculated as:
(Number of Months with Positive Returns / Total Months) × 100
Values above 50% indicate the month has been positive more often than negative; below 50% indicates more frequent negative months
Example: If October shows "64%", then 64% of all historical Octobers had positive returns
What Consistency Score Means:
A 1-10 rating that measures how predictable and stable a month's returns have been
Calculated using the coefficient of variation (standard deviation / mean) - lower variation = higher consistency
High scores (8-10, green): The month has shown relatively stable behavior with similar outcomes year-to-year
Medium scores (5-7, gray): Moderate consistency with some variability
Low scores (1-4, red): High variability with unpredictable behavior across different years
Example: A consistency score of 8/10 indicates the month has exhibited recognizable patterns with relatively low deviation
What Best Means:
Shows the highest percentage return achieved for that specific month, along with the year it occurred
Reveals the maximum observed upside and identifies outlier years with exceptional performance
Useful for understanding the range of possible outcomes beyond the average
Example: "Best: 2016: +131.90%" means the strongest January in the dataset was in 2016 with an 131.90% gain
What Worst Means:
Shows the most negative percentage return for that specific month, along with the year it occurred
Reveals maximum observed downside and helps understand the range of historical outcomes
Important for risk assessment even in months with positive averages
Example: "Worst: 2022: -26.86%" means the weakest January in the dataset was in 2022 with a 26.86% loss
2. Day-of-Week Heatmap
How % Return is Calculated:
Calculates the percentage change from the previous day's close to the current day's price (based on user's price source selection)
Returns are aggregated by day of the week within each calendar month (e.g., all Mondays in January, all Tuesdays in January, etc.)
Each cell shows the average performance for that specific day-month combination across all historical data
Formula:
(Current Day Price - Previous Day Close) / Previous Day Close × 100
What Averages Mean:
The "Avg %" row at the bottom aggregates all months together to show the overall average return for each weekday
Identifies broad weekly patterns across the entire dataset
Calculated by summing all daily returns for that weekday across all months and dividing by total observations
Example: If Monday shows +0.04%, Mondays have averaged a 0.04% change across all months in the dataset
What Days Up % Mean:
Shows the percentage of historical occurrences where that weekday had a positive return
Calculated as:
(Number of Positive Days / Total Days Observed) × 100
Values above 50% indicate the day has been positive more often than negative; below 50% indicates more frequent negative days
Example: If Fridays show "54%", then 54% of all Fridays in the dataset had positive returns
What Consistency Score Means:
A 1-10 rating measuring how stable that weekday's performance has been across different months
Based on the coefficient of variation of daily returns for that weekday across all 12 months
High scores (8-10, green): The weekday has shown relatively consistent behavior month-to-month
Medium scores (5-7, gray): Moderate consistency with some month-to-month variation
Low scores (1-4, red): High variability across months, with behavior differing significantly by calendar month
Example: A consistency score of 7/10 for Wednesdays means they have performed with moderate consistency throughout the year
What Best Means:
Shows which calendar month had the strongest average performance for that specific weekday
Identifies favorable day-month combinations based on historical data
Format shows the month abbreviation and the average return achieved
Example: "Best: Oct: +0.20%" means Mondays averaged +0.20% during October months in the dataset
What Worst Means:
Shows which calendar month had the weakest average performance for that specific weekday
Identifies historically challenging day-month combinations
Useful for understanding which month-weekday pairings have shown weaker performance
Example: "Worst: Sep: -0.35%" means Tuesdays averaged -0.35% during September months in the dataset
3. Optimal Timing Table/Summary Table
→ Best Month to BUY: Identifies the month with the lowest average return (most negative or least positive historically), representing periods where prices have historically been relatively lower
Based on the observation that buying during historically weaker months may position for subsequent recovery
Shows the month name, its average return, and color-coded performance
Example: If May shows -0.86% as "Best Month to BUY", it means May has historically averaged -0.86% in the analyzed period
→ Best Month to SELL: Identifies the month with the highest average return (most positive historically), representing periods where prices have historically been relatively higher
Based on historical strength patterns in that month
Example: If July shows +1.42% as "Best Month to SELL", it means July has historically averaged +1.42% gains
→ 2nd Best Month to BUY: The second-lowest performing month based on average returns
Provides an alternative timing option based on historical patterns
Offers flexibility for staged entries or when the primary month doesn't align with strategy
Example: Identifies the next-most favorable historical buying period
→ 2nd Best Month to SELL: The second-highest performing month based on average returns
Provides an alternative exit timing based on historical data
Useful for staged profit-taking or multiple exit opportunities
Identifies the secondary historical strength period
Note: The same logic applies to "Best Day to BUY/SELL" and "2nd Best Day to BUY/SELL" rows, which identify weekdays based on average daily performance across all months. Days with lowest averages are marked as buying opportunities (historically weaker days), while days with highest averages are marked for selling (historically stronger days).
🟢 Examples
Example 1: NVIDIA NASDAQ:NVDA - Strong May Pattern with High Consistency
Analyzing NVIDIA from 2015 onwards, the Monthly Heatmap reveals May averaging +15.84% with 82% of months being positive and a consistency score of 8/10 (green). December shows -1.69% average with only 40% of months positive and a low 1/10 consistency score (red). The Optimal Timing table identifies December as "Best Month to BUY" and May as "Best Month to SELL." A trader recognizes this high-probability May strength pattern and considers entering positions in late December when prices have historically been weaker, then taking profits in May when the seasonal tailwind typically peaks. The high consistency score in May (8/10) provides additional confidence that this pattern has been relatively stable year-over-year.
Example 2: Crypto Market Cap CRYPTOCAP:TOTALES - October Rally Pattern
An investor examining total crypto market capitalization notices September averaging -2.42% with 45% of months positive and 5/10 consistency, while October shows a dramatic shift with +16.69% average, 90% of months positive, and an exceptional 9/10 consistency score (blue). The Day-of-Week heatmap reveals Mondays averaging +0.40% with 54% positive days and 9/10 consistency (blue), while Thursdays show only +0.08% with 1/10 consistency (yellow). The investor uses this multi-layered analysis to develop a strategy: enter crypto positions on Thursdays during late September (combining the historically weak month with the less consistent weekday), then hold through October's historically strong period, considering exits on Mondays when intraweek strength has been most consistent.
Example 3: Solana BINANCE:SOLUSDT - Extreme January Seasonality
A cryptocurrency trader analyzing Solana observes an extraordinary January pattern: +59.57% average return with 60% of months positive and 8/10 consistency (teal), while May shows -9.75% average with only 33% of months positive and 6/10 consistency. August also displays strength at +59.50% average with 7/10 consistency. The Optimal Timing table confirms May as "Best Month to BUY" and January as "Best Month to SELL." The Day-of-Week data shows Sundays averaging +0.77% with 8/10 consistency (teal). The trader develops a seasonal rotation strategy: accumulate SOL positions during May weakness, hold through the historically strong January period (which has shown this extreme pattern with reasonable consistency), and specifically target Sunday exits when the weekday data shows the most recognizable strength pattern.

ICT Anchored Market Structures with Validation [LuxAlgo]The ICT Anchored Market Structures with Validation indicator is an advanced iteration of the original Pure-Price-Action-Structures tool, designed for price action traders.
It systematically tracks and validates key price action structures, distinguishing between true structural shifts/breaks and short-term sweeps to enhance trend and reversal analysis. The indicator automatically highlights structural points, confirms breakouts, identifies sweeps, and provides clear visual cues for short-term, intermediate-term, and long-term market structures.
A distinctive feature of this indicator is its exclusive reliance on price patterns. It does not depend on any user-defined input, ensuring that its analysis remains robust, objective, and uninfluenced by user bias, making it an effective tool for understanding market dynamics.
🔶 USAGE
Market structure is a cornerstone of price action analysis. This script automatically detects real-time market structures across short-term, intermediate-term, and long-term levels, simplifying trend analysis for traders. It assists in identifying both trend reversals and continuations with greater clarity.
Market structure shifts and breaks help traders identify changes in trend direction. A shift signals a potential reversal, often occurring when a swing high or low is breached, suggesting a transition in trend. A break, on the other hand, confirms the continuation of an established trend, reinforcing the current direction. Recognizing these shifts and breaks allows traders to anticipate price movement with greater accuracy.
It’s important to note that while a CHoCH may signal a potential trend reversal and a BoS suggests a continuation of the prevailing trend, neither guarantees a complete reversal or continuation. In some cases, CHoCH and BoS levels may act as liquidity zones or areas of consolidation rather than indicating a clear shift or continuation in market direction. The indicator’s validation component helps confirm whether the detected CHoCH and BoS are true breakouts or merely liquidity sweeps.
🔶 DETAILS
🔹 Market Structures
Market structures are derived from price action analysis, focusing on identifying key levels and patterns in the market. Swing point detection, a fundamental concept in ICT trading methodologies and teachings, plays a central role in this approach.
Swing points are automatically identified based exclusively on market movements, without requiring any user-defined input.
🔹 Utilizing Swing Points
Swing points are not identified in real-time as they form. Short-term swing points may appear with a delay of up to one bar, while the identification of intermediate and long-term swing points is entirely dependent on subsequent market movements. Importantly, this detection process is not influenced by any user-defined input, relying solely on pure price action. As a result, swing points are generally not intended for real-time trading scenarios.
Instead, traders often analyze historical swing points to understand market trends and identify potential entry and exit opportunities. By examining swing highs and lows, traders can:
Recognize Trends: Swing highs and lows provide insight into trend direction. Higher swing highs and higher swing lows signify an uptrend, while lower swing highs and lower swing lows indicate a downtrend.
Identify Support and Resistance Levels: Swing highs often act as resistance levels, referred to as Buyside Liquidity Levels in ICT terminology, while swing lows function as support levels, also known as Sellside Liquidity Levels. Traders can leverage these levels to plan their trade entries and exits.
Spot Reversal Patterns: Swing points can form key reversal patterns, such as double tops or bottoms, head and shoulders, and triangles. Recognizing these patterns can indicate potential trend reversals, enabling traders to adjust their strategies effectively.
Set Stop Loss and Take Profit Levels: In ICT teachings, swing levels represent price points with expected clusters of buy or sell orders. Traders can target these liquidity levels/pools for position accumulation or distribution, using swing points to define stop loss and take profit levels in their trades.
Overall, swing points provide valuable information about market dynamics and can assist traders in making more informed trading decisions.
🔹 Logic of Validation
The validation process in this script determines whether a detected market structure shift or break represents a confirmed breakout or a sweep.
The breakout is confirmed when the close price is significantly outside the deviation range of the last detected structural price. This deviation range is defined by the 17-period Average True Range (ATR), which creates a buffer around the detected market structure shift or break.
A sweep occurs when the price breaches the structural level within the deviation range but does not confirm a breakout. In this case, the label is updated to 'SWEEP.'
A visual box is created to represent the price range where the breakout or sweep occurs. If the validation process continues, the box is updated. This box visually highlights the price range involved in a sweep, helping traders identify liquidity events on the chart.
🔶 SETTINGS
The settings for Short-Term, Intermediate-Term, and Long-Term Structures are organized into groups, allowing users to customize swing points, market structures, and visual styles for each.
🔹 Structures
Swings and Size: Enables or disables the display of swing highs and lows, assigns icons to represent the structures, and adjusts the size of the icons.
Market Structures: Toggles the visibility of market structure lines.
Market Structure Validation: Enable or disable validation to distinguish true breakouts from liquidity sweeps.
Market Structure Labels: Displays or hides labels indicating the type of market structure.
Line Style and Width: Allows customization of the style and width of the lines representing market structures.
Swing and Line Colors: Provides options to adjust the colors of swing icons, market structure lines, and labels for better visualization.
🔶 RELATED SCRIPTS
Pure-Price-Action-Structures.
Market-Structures-(Intrabar).

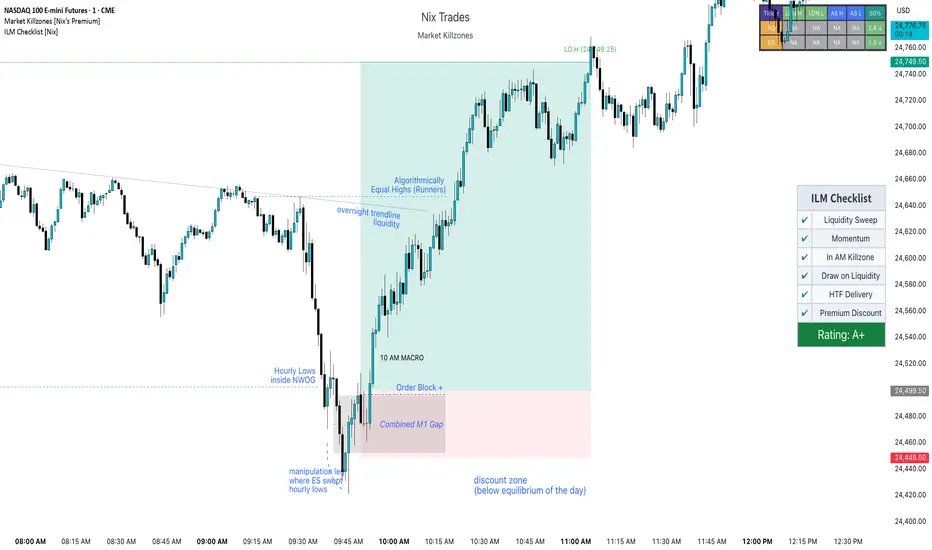
ILM Checklist [Nix]ILM Checklist and Ratings Indicator!
This is a checklist type guide for those that trade the ILM model and are having trouble rating setups on their own.
You can double click on the checklist to open its settings where you can select all the confluences you see on the chart while a setup is forming.
Then the checklist will give you a mechanical estimate of what rating would Nix give it.
Obviously discretion is important as an A+ mechanical setup if still an F setup if you are executing it during a news event.
I have also added a dark / light mode theme toggle to suit your chart.
LEGEND IsoPulse Fusion Universal Volume Trend Buy Sell RadarLEGEND IsoPulse Fusion • Universal Volume Trend Buy Sell Radar
One line summary
LEGEND IsoPulse Fusion reads intent from price and volume together, learns which features matter most on your symbol, blends them into a single signed Fusion line in a stable unit range, and emits clear Buy Sell Close events with a structure gate and a liquidity safety gate so you act only when the tape is favorable.
What this script is and why it exists
Many traders keep separate windows for trend, volume, volatility, and regime filters. The result can feel fragmented. This script merges two complementary engines into one consistent view that is easy to read and simple to act on.
LEGEND Tensor estimates directional quality from five causally computed features that are normalized for stationarity. The features are Flow, Tail Pressure with Volume Mix, Path Curvature, Streak Persistence, and Entropy Order.
IsoPulse transforms raw volume into two decaying reservoirs for buy effort and sell effort using body location and wick geometry, then measures price travel per unit volume for efficiency, and detects volume bursts with a recency memory.
Both engines are mapped into the same unit range and fused by a regime aware mixer. When the tape is orderly the mixer leans toward trend features. When the tape is messy but a true push appears in volume efficiency with bursts the mixer allows IsoPulse to speak louder. The outcome is a single Fusion line that lives in a familiar range with calm behavior in quiet periods and expressive pushes when energy concentrates.
What makes it original and useful
Two reservoir volume split . The script assigns a portion of the bar volume to up effort and down effort using body location and wick geometry together. Effort decays through time using a forgetting factor so memory is present without becoming sticky.
Efficiency of move . Price travel per unit volume is often more informative than raw volume or raw range. The script normalizes both sides and centers the efficiency so it becomes signed fuel when multiplied by flow skew.
Burst detection with recency memory . Percent rank of volume highlights bursts. An exponential memory of how recently bursts clustered converts isolated blips into useful context.
Causal adaptive weighting . The LEGEND features do not receive static weights. The script learns, causally, which features have correlated with future returns on your symbol over a rolling window. Only positive contributions are allowed and weights are normalized for interpretability.
Regime aware fusion . Entropy based order and persistence create a mixer that blends IsoPulse with LEGEND. You see a single line rather than two competing panels, which reduces decision conflict.
How to read the screen in seconds
Fusion area . The pane fills above and below zero with a soft gradient. Deeper fill means stronger conviction. The white Fusion line sits on top for precise crossings.
Entry guides and exit guides . Two entry guides draw symmetrically at the active fused entry level. Two exit guides sit inside at a fraction of the entry. Think of them as an adaptive envelope.
Letters . B prints once when the script flips from flat to long. S prints once when the script flips from flat to short. C prints when a held position ends on the appropriate side. T prints when the structure gate first opens. A prints when the liquidity safety flag first appears.
Price bar paint . Bars tint green while long and red while short on the chart to mirror your virtual position.
HUD . A compact dashboard in the corner shows Fusion, IsoPulse, LEGEND, active entry and exit levels, regime status, current virtual position, and the vacuum z value with its avoid threshold.
What signals actually mean
Buy . A Buy prints when the Fusion line crosses above the active entry level while gates are open and the previous state was flat.
Sell . A Sell prints when the Fusion line crosses below the negative entry level while gates are open and the previous state was flat.
Close . A Close prints when Fusion cools back inside the exit envelope or when an opposite cross would occur or when a gate forces a stop, and the previous state was a hold.
Gates . The Trend gate requires sufficient entropy order or significant persistence. The Avoid gate uses a liquidity vacuum z score. Gates exist to protect you from weak tape and poor liquidity.
Inputs and practical tuning
Every input has a tooltip in the script. This section provides a concise reference that you can keep in mind while you work.
Setup
Core window . Controls statistics across features. Scalping often prefers the thirties or low fifties. Intraday often prefers the fifties to eighties. Swing often prefers the eighties to low hundreds. Smaller responds faster with more noise. Larger is calmer.
Smoothing . Short EMA on noisy features. A small value catches micro shifts. A larger value reduces whipsaw.
Fusion and thresholds
Weight lookback . Sample size for weight learning. Use at least five times the horizon. Larger is slower and more confident. Smaller is nimble and more reactive.
Weight horizon . How far ahead return is measured to assess feature value. Smaller favors quick reversion impulses. Larger favors continuation.
Adaptive thresholds . Entry and exit levels from rolling percentiles of the absolute LEGEND score. This self scales across assets and timeframes.
Entry percentile . Eighty selects the top quintile of pushes. Lower to seventy five for more signals. Raise for cleanliness.
Exit percentile . Mid fifties keeps trades honest without overstaying. Sixty holds longer with wider give back.
Order threshold . Minimum structure to trade. Zero point fifteen is a reasonable start. Lower to trade more. Raise to filter chop.
Avoid if Vac z . Liquidity safety level. One point two five is a good default on liquid markets. Thin markets may prefer a slightly higher setting to avoid permanent avoid mode.
IsoPulse
Iso forgetting per bar . Memory for the two reservoirs. Values near zero point nine eight to zero point nine nine five work across many symbols.
Wick weight in effort split . Balance between body location and wick geometry. Values near zero point three to zero point six capture useful behavior.
Efficiency window . Travel per volume window. Lower for snappy symbols. Higher for stability.
Burst percent rank window . Window for percent rank of volume. Around one hundred to three hundred covers most use cases.
Burst recency half life . How long burst clusters matter. Lower for quick fades. Higher for cluster memory.
IsoPulse gain . Pre compression gain before the atan mapping. Tune until the Fusion line lives inside a calm band most of the time with expressive spikes on true pushes.
Continuation and Reversal guides . Visual rails for IsoPulse that help you sense continuation or exhaustion zones. They do not force events.
Entry sensitivity and exit fraction
Entry sensitivity . Loose multiplies the fused entry level by a smaller factor which prints more trades. Strict multiplies by a larger factor which selects fewer and cleaner trades. Balanced is neutral.
Exit fraction . Exit level relative to the entry level in fused unit space. Values around one half to two thirds fit most symbols.
Visuals and UX
Columns and line . Use both to see context and precise crossings. If you present a very clean chart you can turn columns off and keep the line.
HUD . Keep it on while you learn the script. It teaches you how the gates and thresholds respond to your market.
Letters . B S C T A are informative and compact. For screenshots you can toggle them off.
Debug triggers . Show raw crosses even when gates block entries. This is useful when you tune the gates. Turn them off for normal use.
Quick start recipes
Scalping one to five minutes
Core window in the thirties to low fifties.
Horizon around five to eight.
Entry percentile around seventy five.
Exit fraction around zero point five five.
Order threshold around zero point one zero.
Avoid level around one point three zero.
Tune IsoPulse gain until normal Fusion sits inside a calm band and true squeezes push outside.
Intraday five to thirty minutes
Core window around fifty to eighty.
Horizon around ten to twelve.
Entry percentile around eighty.
Exit fraction around zero point five five to zero point six zero.
Order threshold around zero point one five.
Avoid level around one point two five.
Swing one hour to daily
Core window around eighty to one hundred twenty.
Horizon around twelve to twenty.
Entry percentile around eighty to eighty five.
Exit fraction around zero point six zero to zero point seven zero.
Order threshold around zero point two zero.
Avoid level around one point two zero.
How to connect signals to your risk plan
This is an indicator. You remain in control of orders and risk.
Stops . A simple choice is an ATR multiple measured on your chart timeframe. Intraday often prefers one point two five to one point five ATR. Swing often prefers one point five to two ATR. Adjust to symbol behavior and personal risk tolerance.
Exits . The script already prints a Close when Fusion cools inside the exit envelope. If you prefer targets you can mirror the entry envelope distance and convert that to points or percent in your own plan.
Position size . Fixed fractional or fixed risk per trade remains a sound baseline. One percent or less per trade is a common starting point for testing.
Sessions and news . Even with self scaling, some traders prefer to skip the first minutes after an open or scheduled news. Gate with your own session logic if needed.
Limitations and honest notes
No look ahead . The script is causal. The adaptive learner uses a shifted correlation, crosses are evaluated without peeking into the future, and no lookahead security calls are used. If you enable intrabar calculations a letter may appear then disappear before the close if the condition fails. This is normal for any cross based logic in real time.
No performance promises . Markets change. This is a decision aid, not a prediction machine. It will not win every sequence and it cannot guarantee statistical outcomes.
No dependence on other indicators . The chart should remain clean. You can add personal tools in private use but publications should keep the example chart readable.
Standard candles only for public signals . Non standard chart types can change event timing and produce unrealistic sequences. Use regular candles for demonstrations and publications.
Internal logic walkthrough
LEGEND feature block
Flow . Current return normalized by ATR then smoothed by a short EMA. This gives directional intent scaled to recent volatility.
Tail pressure with volume mix . The relative sizes of upper and lower wicks inside the high to low range produce a tail asymmetry. A volume based mix can emphasize wick information when volume is meaningful.
Path curvature . Second difference of close normalized by ATR and smoothed. This captures changes in impulse shape that can precede pushes or fades.
Streak persistence . Up and down close streaks are counted and netted. The result is normalized for the window length to keep behavior stable across symbols.
Entropy order . Shannon entropy of the probability of an up close. Lower entropy means more order. The value is oriented by Flow to preserve sign.
Causal weights . Each feature becomes a z score. A shifted correlation against future returns over the horizon produces a positive weight per feature. Weights are normalized so they sum to one for clarity. The result is angle mapped into a compact unit.
IsoPulse block
Effort split . The script estimates up effort and down effort per bar using both body location and wick geometry. Effort is integrated through time into two reservoirs using a forgetting factor.
Skew . The reservoir difference over the sum yields a stable skew in a known range. A short EMA smooths it.
Efficiency . Move size divided by average volume produces travel per unit volume. Normalization and centering around zero produce a symmetric measure.
Bursts and recency . Percent rank of volume highlights bursts. An exponential function of bars since last burst adds the notion of cluster memory.
IsoPulse unit . Skew multiplied by centered efficiency then scaled by the burst factor produces the raw IsoPulse that is angle mapped into the unit range.
Fusion and events
Regime factor . Entropy order and streak persistence form a mixer. Low structure favors IsoPulse. Higher structure favors LEGEND. The blend is convex so it remains interpretable.
Blended guides . Entry and exit guides are blended in the same way as the line so they stay consistent when regimes change. The envelope does not jump unexpectedly.
Virtual position . The script maintains state. Buy and Sell require a cross while flat and gates open. Close requires an exit or force condition while holding. Letters print once at the state change.
Disclosures
This script and description are educational. They do not constitute investment advice. Markets involve risk. You are responsible for your own decisions and for compliance with local rules. The logic is causal and does not look ahead. Signals on non standard chart types can be misleading and are not recommended for publication. When you test a strategy wrapper, use realistic commission and slippage, moderate risk per trade, and enough trades to form a meaningful sample, then document those assumptions if you share results.
Closing thoughts
Clarity builds confidence. The Fusion line gives a single view of intent. The letters communicate action without clutter. The HUD confirms context at a glance. The gates protect you from weak tape and poor liquidity. Tune it to your instrument, observe it across regimes, and use it as a consistent lens rather than a prediction oracle. The goal is not to trade every wiggle. The goal is to pick your spots with a calm process and to stand aside when the tape is not inviting.

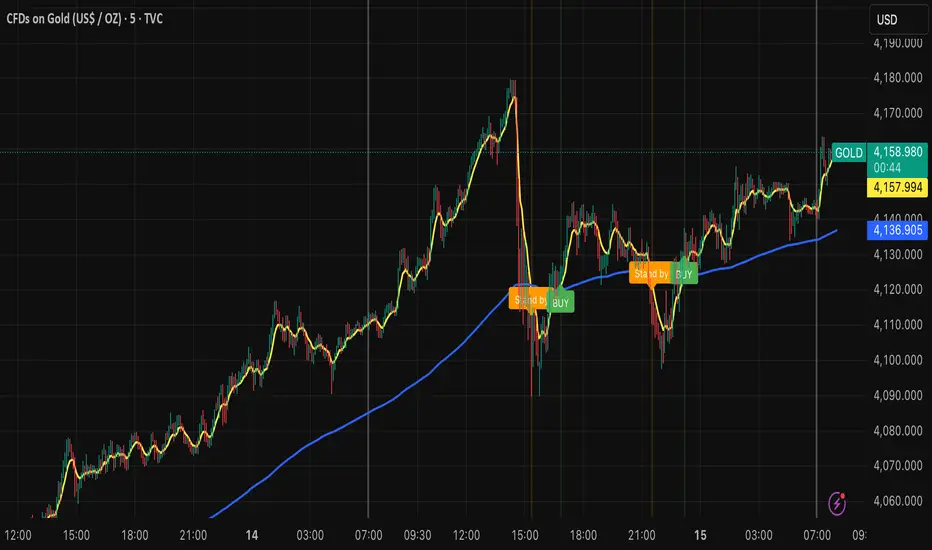
Billionaire Gold ClubBillionaire Gold Club — Long-Term Gold Trend Follower
Overview
The Billionaire Gold Club indicator is designed for traders who follow the long-term bullish bias of Gold (XAU/USD).
It focuses only on BUY opportunities and encourages patience during market pullbacks.
The goal is to trade with the main trend, not against it.
Instructions
1. The script automatically plots 7MA (fast) and 200MA (slow).
2. When 7MA crosses above 200MA, a BUY signal appears.
3. When 7MA crosses below 200MA, a Standby signal appears — do not sell, just wait for the next BUY.
Usage Rules
• Recommended timeframe: 15-minute or higher.
• If used below 15 minutes, treat it as day trading — close trades within the same day.
• Focus on long-term holding and small lot sizes to protect your capital.
Signal Guide
🟢 BUY → Enter the trend direction.
🟠 Standby → Pause new entries and wait patiently.
Alerts
Set alerts to "Once per bar close":
• BUY Signal → Golden Cross confirmed.
• Standby Signal → Death Cross confirmed.
Philosophy
"Obey the rules, and your probability of success increases."
This system rewards patience, discipline, and long-term trend following.
Follow me for more TradingView scripts and updates.
Billionaire Gold Clubは、ゴールド(XAU/USD)の長期上昇トレンドに沿って取引するためのインジケーターです。
基本的にBUYのみを狙い、デッドクロス時はStandby(待機)状態として次のBUYを待ちます。
推奨時間軸:15分足以上。
15分未満で使用する場合はデイトレードとして同日中にクローズすることを推奨します。
ロットを小さく保ち、長期保有で安定した運用を目指してください。
Tweezer & Kangaroo Zones [WavesUnchained]Tweezer & Kangaroo Zones
Pattern Recognition with Supply/Demand Zones
Indicator that detects tweezer and kangaroo tail (pin bar) reversal patterns and creates supply and demand zones. Includes volume validation, trend context, and confluence scoring.
What You See on Your Chart
Pattern Labels:
"T" (Red) - Tweezer Top detected above price → Bearish reversal signal
"T" (Green) - Tweezer Bottom detected below price → Bullish reversal signal
"K" (Red) - Kangaroo Bear (Pin Bar rejection from top) → Bearish signal
"K" (Green) - Kangaroo Bull (Pin Bar rejection from bottom) → Bullish signal
Label Colors Indicate Pattern Strength:
Dark Green/Red - Strong pattern (score ≥8.0)
Medium Green/Red - Good pattern (score ≥6.0)
Light Green/Red - Valid pattern (score <6.0)
Zone Boxes:
Red Boxes - Supply Zones (resistance, potential short areas)
Green Boxes - Demand Zones (support, potential long areas)
White Border - Active zone (fresh, not tested yet)
Gray Border - Inactive zone (expired or invalidated)
Pattern Detection
Tweezer Patterns (Classic Double-Top/Bottom):
Flexible Lookback - Detects patterns up to 3 bars apart (not just consecutive)
Precision Matching - 0.2% level tolerance for high-quality signals
Wick Similarity Check - Both candles must show similar rejection wicks
Volume Validation - Second candle requires elevated volume (0.8x average)
Pattern Strength Score - 0-1 quality rating based on level match + wick similarity
Optional Trend Context - Can require trend alignment (default: OFF for more signals)
Kangaroo Tail / Pin Bar Patterns:
No Pivot Delay - Instant detection without waiting for pivot confirmation
Body Position Check - Body must be at candle extremes (30% tolerance)
Volume Spike - Rejection must occur with volume (0.9x average)
Rejection Strength - Scores based on wick length (0.5-0.9 of range)
Optional Trend Context - Bearish in uptrends, Bullish in downtrends (default: OFF)
Zone Management
Auto-Created Zones - Every valid pattern creates a supply/demand zone
Overlap Prevention - Zones too close together (50% overlap) are not duplicated
Lifetime Control - Zones expire after 400 bars (configurable)
Smart Invalidation - Zones invalidate when price closes through them
Styling Options - Choose between Solid, Dashed, or Dotted borders
Border Width - 2px width for better visibility
Confluence Scoring System
Multi-factor confluence scoring (0-10 scale) with configurable weights:
Regime (EMA+HTF) - Trend alignment across timeframes (Weight: 2.0)
HTF Stack - Multi-timeframe trend confluence (Weight: 3.0)
Structure - Higher lows / Lower highs confirmation (Weight: 1.0)
Relative Volume - Volume surge validation (Weight: 1.0)
Chop Advantage - Favorable market conditions (Weight: 1.0)
Zone Thinness - Tight zones = better R/R (Weight: 1.0)
Supertrend - Trend indicator alignment (Weight: 1.0)
MOST - Moving Stop alignment (Weight: 1.0)
Pattern Strength - Quality of detected pattern (Weight: 1.5)
Zone Retest Signals
Signals generated when zones are retested:
BUY Signal - Price retests demand zone from above (score ≥4.5)
SELL Signal - Price retests supply zone from below (score ≥5.5)
Normalized Score - Displayed as 0-10 for easy interpretation
Optional Trend Gate - Require trend alignment for signals (default: OFF)
Alert Ready - Built-in alertconditions for automation
Additional Features
Auto-Threshold Tuning - Adapts to ATR and Choppiness automatically
Session Profiles - Different settings for RTH vs ETH sessions
Organized Settings - 15+ input groups for easy configuration
Optional Panels - HTF Stack overview and performance metrics (default: OFF)
Data Exports - Hidden plots for strategy/library integration
RTA Health Monitoring - Built-in performance tracking
Setup & Configuration
Quick Start:
1. Apply indicator to any timeframe
2. Patterns and zones appear automatically
3. Adjust pattern detection sensitivity if needed
4. Configure zone styling (Solid/Dashed/Dotted)
5. Set up alerts for zone retests
Key Settings to Adjust:
Pattern Detection:
• Min RelVolume: Lower = more signals (0.8 Tweezer, 0.9 Kangaroo)
• Require trend context: Enable for stricter, higher-quality patterns
• Check wick similarity: Ensures proper rejection structure
Zone Management:
• Zone lifetime: How long zones remain active (default: 400 bars)
• Invalidate on close-through: Remove zones when price breaks through
• Max overlap: Prevent duplicate zones (default: 50%)
Scoring:
• Min Score BUY/SELL: Higher = fewer but better signals (default: 4.5/5.5)
• Component weights: Customize what factors matter most
• Signals require trend gate: OFF = more signals, ON = higher quality
Visual Customization
Zone Colors - Light red/green with 85% transparency (non-intrusive)
Border Styles - Solid, Dashed, or Dotted
Label Intensity - Darker greens for better readability
Clean Charts - All panels OFF by default
Understanding the Zones
Supply Zones (Red):
Created from bearish patterns (Tweezer Tops, Kangaroo Bears). Price made a high attempt to push higher, but was rejected. These become resistance areas where sellers may step in again.
Demand Zones (Green):
Created from bullish patterns (Tweezer Bottoms, Kangaroo Bulls). Price made a low with strong rejection. These become support areas where buyers may step in again.
Zone Quality Indicators:
• White border = Fresh zone, not tested yet
• Gray border = Zone expired or invalidated
• Thin zones (tight range) = Better risk/reward ratio
• Thick zones = Less precise, wider stop required
Trading Applications
Reversal Trading - Enter at pattern detection with tight stops
Zone Retest Trading - Wait for retests of established zones
Trend Confluence - Trade only when patterns align with trend
Risk Management - Use zone boundaries for stop placement
Target Setting - Opposite zones become profit targets
Pro Tips
Best signals occur when pattern + zone retest + trend all align
Lower timeframes = more signals but more noise
Higher timeframes = fewer but more reliable signals
Start with default settings, adjust based on your market
Combine with other analysis (structure, key levels, etc.)
Use alerts to avoid staring at charts all day
Important Notes
Not all patterns will lead to successful trades
Use proper risk management and position sizing
Patterns work best in trending or range-bound markets
Very choppy conditions may produce lower-quality signals
Always confirm with your own analysis before trading
Technical Specifications
• Pine Script v6
• RTA-Core integration
• RTA Core Library integration
• Maximum 200 boxes, 500 labels
• Auto-tuning based on ATR and Choppiness
• Session-aware threshold adjustments
• Memory-optimized zone management
What's Included
Tweezer Top/Bottom detection
Kangaroo Tail / Pin Bar detection
Automatic supply/demand zone creation
Volume validation system
Pattern strength scoring
Zone retest signals
Multi-factor confluence scoring
Optional HTF Stack panel
Optional performance metrics
Session profile support
Auto-threshold tuning
Alert conditions
Data exports for strategies
Author Waves Unchained
Version 1.0
Status Public Indicator
Summary
Reversal pattern detection with zone management, volume validation, and confluence scoring for tweezer and kangaroo tail patterns.
---
Disclaimer: This indicator is for educational and informational purposes only. Trading involves risk. Past performance does not guarantee future results. Always practice proper risk management.

Session High/LowWhat it does:
Plots the High and Low of three sessions—Asia (19:00–02:00), London (02:00–08:00), New York (09:30–16:00)—all in UTC-4. After a session closes, it draws a horizontal line starting at the bar where the level first formed, extends it live to the current bar, and shows a label at the line’s end. If price sweeps the level (by wick or close, configurable), the line stops at that bar.
Settings: show/hide sessions, sweep on close toggle, how many past sessions to keep, line style/width, colors per session, and custom label text.
Works on any timeframe. Note: session times are fixed to UTC-4 (adjust if your market uses DST).
Pump-Smart Shorting StrategyThis strategy is built to keep your portfolio hedged as much as possible while maximizing profitability. Shorts are opened after pumps cool off and on new highs (when safe), and closed quickly during strong upward moves or if stop loss/profit targets are hit. It uses visual overlays to clearly show when hedging is on, off, or blocked due to momentum, ensuring you’re protected in most market conditions but never short against the pump. Fast re-entry keeps the hedge active with minimal downtime.
Pump Detection:
RSI (Relative Strength Index): Calculated over a custom period (default 14 bars). If RSI rises above a threshold (default 70), the strategy considers the market to be in a pump (strong upward momentum).
Volume Spike: The current volume is compared to a 20-bar simple moving average of volume. If it exceeds the average by 1.5× and price increases at least 5% in one bar, pump conditions are triggered.
Price Jump: Measured by (close - close ) / close . A single-bar change > 5% helps confirm rapid momentum.
Pump Zone (No Short): If any of these conditions is true, an orange or red background is shown and shorts are blocked.
Cooldown and Re-Entry:
Cooldown Detection: After the pump ends, RSI must fall below a set value (default ≤ 60), and either volume returns towards average or price momentum is less than half the original spike (oneBarUp <= pctUp/2).
barsWait Parameter: You can specify a waiting period after cooldown before a short is allowed.
Short Entry After Pump/Cooldown: When these cooldown conditions are met, and no short is active, a blue background is shown and a short position is opened at the next signal.
New High Entry:
Lookback New High: If the current high is greater than the highest high in the last N bars (default 20), and pump is NOT active, a short can be opened.
Take Profit (TP) & Stop Loss (SL):
Take Profit: Short is closed if price falls to a threshold below the entry (minProfitPerc, default 2%).
Stop Loss: Short is closed if price rises to a threshold above the entry (stopLossPerc, default 6%).
Preemptive Exit:
Any time a pump is detected while a short position is open, the strategy closes the short immediately to avoid losses.
Visual Feedback:
Orange Background: Market is pumping, do not short.
Red Background: Other conditions block shorts (cooldown or waiting).
Blue Background: Shorts allowed.
Triangles/Circles: Mark entries, pump start/end, for clear trading signals.

ICT Killzones & MacrosICT Killzones & Macros (v1.1.5) — configurable ICT session windows + refined “macro” windows with live High/Low levels, optional extensions, next-window previews, and lightweight opening-price lines. Built to be clock-robust, timezone-aware, and performant on intraday charts.
Tip: All times are interpreted in your chosen IANA timezone (default: America/New_York) and auto-handle DST. You can rename, recolor, enable/disable, and retime every window.
What it plots
- Killzones (5) : Asia (19:00–02:00), London (02:00–05:00), NY AM (07:00–09:30), London Close (10:00–12:00), NY PM (13:30–16:00) — full-height boxes with optional header.
- Macros (8) (defaults tailored for common ICT “refined” windows): Asia-1 (18:00–21:00), Asia-2 (21:00–00:00), London-1 (01:00–04:00), AM-1 (09:45–10:15), AM-2 (10:45–11:15), Lunch (12:00–13:00), PM-1 (13:30–14:30), Power Hour (15:10–16:00).
- Live High/Low lines for the current Macro/Killzone window.
- Optional HL extension to the right until price crosses or the trading day rolls (style selectable).
- “Next” previews : earliest upcoming Macro and Killzone header; optional next-window background band.
- Opening Prices (3 lightweight time lines) : defaults 00:00, 08:30, 09:30 with right-edge labels, scoped to a session you choose (auto-cleans at session end).
- Key inputs & styling
- General : Timezone (IANA), “Sessions to show” (per window) to keep only the last N completed windows.
- Header : height (ticks), gap (ticks), fill opacity, border width/style, text size/color, toggle “Next Macro/Killzone” headers.
- Boxes : global fill opacity, global border width/style (used by both Macros & Killzones).
- High/Low : show HL, HL line style, extend on/off + extension style, optional extension labels.
- Opening Prices : enable Time 1/2/3, set HH:MM for each, session window, per-line colors, style (dotted/dashed/solid), width.
- Per-window controls : each Macro/Killzone has Enable, Session (HHMM-HHMM), Label, Fill color.
How to use (quick start)
- Set Timezone to your preference (default America/New_York).
- Toggle on the Macros and Killzones you trade. Adjust session times if needed.
- (Optional) Turn on Extend High/Low to project levels until crossed/day-roll.
- (Optional) Enable Next… headers to see the next upcoming window at a glance.
- (Optional) Configure Opening Prices (00:00 / 08:30 / 09:30 by default) and the session over which they appear.
Behavior & notes
- Time windows are computed by clock, not by guessing bar timestamps, making them robust across brokers and timeframes.
- With HL extension on, the current window’s levels extend until crossed or the end of the trading day (in your timezone). With it off, completed windows keep static HL markers (limited by “Sessions to show”).
- “Sessions to show” applies per Macro/Killzone to automatically prune older windows and keep charts snappy.
- Opening-price lines exist only within the chosen “Opening Prices Session” and are removed when it ends (keeps charts clean).
Defaults (color cues)
Killzones: Asia (blue), London (purple), NY AM (green), London Close (yellow), NY PM (orange).
Macros: neutral greys with Lunch and PM accents out of the box (all customizable).
Performance tips
- Reduce “Sessions to show” if you scroll far back in history.
- Disable “Next…” previews and/or extension labels on very slow machines.
- Narrow the “Opening Prices Session” window to exactly when you need those lines.
Changelog highlights
- v1.1.5 : Internal refinements and stability.
- v1.1.3 : Live High/Low lines for current windows + optional extension.
- v1.1.2 : Added “next Killzone” preview (to match “next Macro”).
- v1.1.0 : Defaults updated (5 KZ, 8 Macros). Removed “snap-to-killzone” behavior.
- v1.0.0 : Independent Macro vs. Killzone rendering; cleaner header logic.
- Known limitations
If your chart warns about drawings, trim “Sessions to show”.
If your broker session times differ from NY hours, adjust the sessions or change the indicator timezone.
Credits & intent
Inspired by ICT timing concepts; provided for education/mark-up, not financial advice.
Built to be flexible so you can mirror your personal playbook and journaling workflow.

HTF Cross Breakout [CHE] HTF Cross Breakout — Detects higher timeframe close crossovers for breakout signals, anchors VWAP for trend validation, and flags continuations or traps with visual extensions for delta percent and stop levels.
Summary
This indicator spots moments when the current chart's close price crosses a higher timeframe close, marking potential breakouts only when the current bar shows directional strength. It anchors a volume-weighted average price line from the breakout point to track trend health, updating labels to show if the move continues or reverses into a trap. Extensions add a dotted line linking the breakout level to the current close with percent change display, plus a stop-loss marker at the VWAP end. Signals gain robustness from higher timeframe confirmation and anti-repainting options, reducing noise in live bars compared to simple crossover tools.
Motivation: Why this design?
Traders often face false breakouts from intrabar wiggles on lower timeframes, especially without higher timeframe alignment, leading to whipsaws in volatile sessions. This design uses higher timeframe close as a stable reference for crossover detection, combined with anchored volume weighting to gauge sustained momentum. It addresses these by enforcing bar confirmation and directional filters, providing clearer entry validation and risk points without overcomplicating the chart.
What’s different vs. standard approaches?
Reference baseline
Standard crossover indicators like moving average crosses operate solely on the chart timeframe, ignoring higher timeframe context and lacking volume anchoring.
Architecture differences
- Higher timeframe data pulls via security calls with optional repainting control for stability.
- Anchored VWAP resets at each signal, accumulating from the breakout bar only.
- Label dynamics update in real-time for continuation checks, with extensions for visual delta and stop computation.
- Event-driven line finalization prunes old elements after a set bar extension.
Practical effect
Charts show persistent lines and labels that extend live but finalize cleanly on new events, avoiding clutter. This matters for spotting trap reversals early via label color shifts, and extensions provide quick risk visuals without manual calculations, improving decision speed in trend trades.
How it works (technical)
The indicator first determines a higher timeframe based on user selection, pulling its close price securely. It checks for crossovers or crossunders of the current close against this higher close, but only triggers on confirmed bars with matching directional opens and closes. On a valid event, a horizontal line and label mark the higher close level, while a dashed VWAP line starts accumulating typical price times volume from that bar onward. During the active phase, the breakout line extends to the current bar, the label repositions and updates text based on whether the current close holds above or below the level for bulls or bears. A background tint warns if the close deviates adversely from the current VWAP. Extensions draw a vertical dotted line at the last bar between the breakout level and close, placing a midpoint label with percent difference; separately, a label at the VWAP end shows a computed stop price. Persistent variables track the active state and accumulators, resetting on new events after briefly extending old elements. Repaint risk from security calls is mitigated by confirmed bar gating or user opt-in.
Parameter Guide
Plateau Length (reserved for future, currently unused): Sets a length for potential plateau detection in extensions; default 3, minimum 1. Higher values would increase stability but are not active yet—leave at default to avoid tuning.
Line Width: Controls thickness of breakout, VWAP, and extension lines; default 2, range 1 to 5. Thicker lines improve visibility on busy charts but may obscure price action—use 1 for clean views, 3 or more for emphasis.
+Bars after next HTF event (finalize old, then delete): Extends old lines and labels by this many bars before deletion on new signals; default 20, minimum 0. Shorter extensions keep charts tidy but risk cutting visuals prematurely; longer aids review but builds clutter over time.
Evaluate label only on HTF close (prevents gray traps intrabar): When true, label updates wait for higher timeframe confirmation; default true. Enabling reduces intrabar flips for stabler signals, though it may delay feedback—disable for faster live trading at repaint cost.
Allow Repainting: Permits real-time security data without confirmation offset; default false. False ensures historical accuracy but lags live bars; true speeds updates but can repaint on HTF closes.
Timeframe Type: Chooses HTF method—Auto Timeframe (dynamic steps up), Multiplier (chart multiple), or Manual (fixed string); default Auto Timeframe. Auto adapts to chart scale for convenience; Multiplier suits custom scaling like 5 times current; Manual for precise like 1D on any chart.
Multiplier for Alternate Resolution: Scales chart timeframe when Multiplier type selected; default 5, minimum 1. Values near 1 mimic current resolution for subtle shifts; higher like 10 jumps to broader context, increasing signal rarity.
Manual Resolution: Direct timeframe string like 60 for 1H when Manual type; default 60. Match to trading horizon—shorter for swing, longer for positional—to balance frequency and reliability.
Show Extension 1: Toggles dotted line and delta percent label between breakout level and current close; default true. Disable to simplify for basic use, enable for precise momentum tracking.
Dotted Line Width: Thickness for Extension 1 line; default 2, range 1 to 5. Align with main Line Width for consistency.
Text Size: Size for delta percent label; options tiny, small, normal, large; default normal. Smaller reduces overlap on dense charts; larger aids glance reads.
Decimals for Δ%: Precision in percent change display; default 2, range 0 to 6. Fewer decimals speed reading; more suit low-volatility assets.
Positive Δ Color: Hue for upward percent changes; default lime. Choose contrasting for visibility.
Negative Δ Color: Hue for downward percent changes; default red. Pair with positive for quick polarity scan.
Dotted Line Color: Color for Extension 1 line; default gray. Neutral tones blend well; brighter for emphasis.
Background Transparency (0..100): Opacity for delta label background; default 90. Higher values fade for subtlety; lower solidifies for readability.
Show Extension 2: Toggles stop-loss label at VWAP end; default true. Turn off for entry focus only.
Stop Method: Percent from VWAP end or fixed ticks; options Percent, Ticks; default Percent. Percent scales with price levels; Ticks suits tick-based instruments.
Stop %: Distance as fraction of VWAP for Percent method; default 1.0, step 0.05, minimum 0.0. Tighter like 0.5 reduces risk but increases stops; wider like 2.0 allows breathing room.
Stop Ticks: Tick count offset for Ticks method; default 20, minimum 0. Adjust per asset volatility—fewer for tight control.
Price Decimals: Rounding for stop price text; default 4, range 0 to 10. Match syminfo.precision for clean display.
Text Size: Size for stop label; options tiny, small, normal, large; default normal. Scale to chart zoom.
Text Color: Foreground for stop text; default white. Ensure contrast with background.
Inherit VWAP Color (BG tint): Bases stop label background on VWAP hue; default true. True maintains theme; false allows custom black base.
BG Transparency (0..100): Opacity for stop label background; default 0. Zero for no tint; up to 100 for full fade.
Reading & Interpretation
Breakout lines appear green for bullish crosses or red for bearish, extending live until a new event finalizes them briefly then deletes. Labels start blank, updating to Bull Cont. or Bear Cont. in matching colors if holding the level, or gray Bull Trap/Bear Trap on reversal. VWAP dashes yellow for bulls, orange for bears, sloping with accumulated volume weight—deviations trigger faint red background warnings. Extension 1's dotted vertical shows at the last bar, with midpoint label green/red for positive/negative percent from breakout to close. Extension 2 places a left-aligned label at VWAP end with stop price and method note, tinted to VWAP for context.
Practical Workflows & Combinations
For trend following, enter long on green Bull Cont. labels above VWAP with higher highs confirmation, filtering via rising structure; short on red Bear Cont. below. Pair with volume surges or RSI above 50 for bulls to avoid traps. For exits, trail stops using the Extension 2 level, tightening on warnings or gray labels—aggressive on continuations, conservative post-trap. In multi-timeframe setups, use default Auto on 15m charts for 1H signals, scaling multiplier to 4 for daily context on hourly; test on forex/stocks where volume is reliable, avoiding low-liquidity assets.
Behavior, Constraints & Performance
Signals confirm on bar close with HTF gating when strict mode active, but live bars may update if repainting enabled—opt false for backtest fidelity, true for intraday speed. Security calls risk minor repaints on HTF closes, mitigated by confirmation offsets. Resources cap at 1000 bars back, 50 lines/labels total, with event prunes to stay under budgets—no loops, minimal arrays. Limits include VWAP lag in low-volume periods and dependency on accurate HTF data; gaps or holidays may skew anchors.
Sensible Defaults & Quick Tuning
Defaults suit 5m-1H charts on liquid assets: Auto HTF, no repaint, 1% stops. For choppy markets with excess signals, enable strict eval and bump multiplier to 10 for rarer triggers. If sluggish in trends, shorten extend bars to 10 and allow repainting for quicker visuals. On high-vol like crypto, widen stop % to 2.0 and use Ticks method; for stables like indices, tighten to 0.5% and keep Percent.
What this indicator is—and isn’t
This is a signal visualization layer for breakout confirmation and basic risk marking, best as a filter in discretionary setups. It isn’t a standalone system or predictive oracle—combine with price structure, news awareness, and sizing rules for real edges.
Disclaimer
The content provided, including all code and materials, is strictly for educational and informational purposes only. It is not intended as, and should not be interpreted as, financial advice, a recommendation to buy or sell any financial instrument, or an offer of any financial product or service. All strategies, tools, and examples discussed are provided for illustrative purposes to demonstrate coding techniques and the functionality of Pine Script within a trading context.
Any results from strategies or tools provided are hypothetical, and past performance is not indicative of future results. Trading and investing involve high risk, including the potential loss of principal, and may not be suitable for all individuals. Before making any trading decisions, please consult with a qualified financial professional to understand the risks involved.
By using this script, you acknowledge and agree that any trading decisions are made solely at your discretion and risk.
Do not use this indicator on Heikin-Ashi, Renko, Kagi, Point-and-Figure, or Range charts, as these chart types can produce unrealistic results for signal markers and alerts.
Best regards and happy trading
Chervolino

Zark CRT Line/Marker Color & Style Meaning
Previous Candle CRT Green (bullish) / Red (bearish) solid line Sweep confirmed on the previous candle
Current Candle CRT Green (bullish) / Red (bearish) dashed line Sweep currently happening on the current candle
Higher Timeframe CRT Orange dotted line Sweep from higher timeframe shown on lower timeframe chart
Target Line Blue dashed line Opposite side of liquidity for potential price target
Breaker Confirmed Aqua solid line (over previous/current CRT) Sweep confirmed with a break of a small swing
CRT Invalidated Gray line Sweep no longer valid (price closed beyond sweep level)
Full-Height HTF Divider Yellow vertical line Marks each higher timeframe bar for visual separation
Labels White text on colored background Shows type (Prev/Curr/HTF) and exact price
