BLCKBOX Moving Average RibbonThe BLCKBOX Moving Average Ribbon is a simple moving average ribbon overlayed on the chart with the following timeframes;
7, 21, 42, 90, 180, 365
I hope you find this indicator useful. I have released several indicators that can be used in conjunction to hopefully improve your chances of making a ton of money!
BLCKBOX indicators include;
BLCKBOX Buying / Selling Sentiment
BLCKBOX MACD Indicator
BLCKBOX Relative Strength Index
BLCKBOX Crypto Bear Market Prediction
BLCKBOX Stochtastic
BLCKBOX EMA Cross Study
BLCKBOX Moving Average Ribbon
If you find this or any other indicator useful and wish to show your gratitude, you may!
Doge
DJwW7XazGk2R8nXjt8y5ydQfGKYSz3XV3h
Litecoin
ltc1qh8t4dmz8sugjcd5unn0g49985u0tz5gs6kf98y
Bitcoin
bc1q0deh9t9w9tm3qgd3npn7965rzel35qumez7m5v
Ethereum
0xa23a7bbde03ea31f5cce4b115c8ef1ea8bc9f467
Pepe
Pr7DZSXKwVGv7LYhRQ9oSuuWxUecc3Dvwq
Cycles

BLCKBOX EMA Cross StudyThe BLCKBOX EMA Cross Study is a simple EMA ribbon overlayed on the chart with the following timeframes;
7, 14, 21, 42, 90, 180
I hope you find this indicator useful. I have released several indicators that can be used in conjunction to hopefully improve your chances of making a ton of money!
BLCKBOX indicators include;
BLCKBOX Buying / Selling Sentiment
BLCKBOX MACD Indicator
BLCKBOX Relative Strength Index
BLCKBOX Crypto Bear Market Prediction
BLCKBOX Stochtastic
BLCKBOX EMA Cross Study
If you find this or any other indicator useful and wish to show your gratitude, you may!
Doge
DJwW7XazGk2R8nXjt8y5ydQfGKYSz3XV3h
Litecoin
ltc1qh8t4dmz8sugjcd5unn0g49985u0tz5gs6kf98y
Bitcoin
bc1q0deh9t9w9tm3qgd3npn7965rzel35qumez7m5v
Ethereum
0xa23a7bbde03ea31f5cce4b115c8ef1ea8bc9f467
Pepe
Pr7DZSXKwVGv7LYhRQ9oSuuWxUecc3Dvwq

BLCKBOX StochasticAnother dirty indicator that is based on the Trading View Stochtastic indicator with the addition of directional arrow indicators that show the anticipated price direction (up/down).
I have released several indicators that can be used in conjunction to hopefully improve your chances of making a ton of money!
BLCKBOX indicators include;
BLCKBOX Buying / Selling Sentiment
BLCKBOX MACD Indicator
BLCKBOX Relative Strength Index
BLCKBOX Crypto Bear Market Prediction
BLCKBOX Stochtastic
If you find this or any other indicator useful and wish to show your gratitude, you may!
Doge
DJwW7XazGk2R8nXjt8y5ydQfGKYSz3XV3h
Litecoin
ltc1qh8t4dmz8sugjcd5unn0g49985u0tz5gs6kf98y
Bitcoin
bc1q0deh9t9w9tm3qgd3npn7965rzel35qumez7m5v
Ethereum
0xa23a7bbde03ea31f5cce4b115c8ef1ea8bc9f467
Pepe
Pr7DZSXKwVGv7LYhRQ9oSuuWxUecc3Dvwq

Central Bank Assets YoY % with StdDev BandsCentral Bank Assets YoY % with StdDev Bands - Indicator Documentation
Overview
This indicator tracks the year-over-year (YoY) percentage change in combined central bank assets using a custom formula. It displays the annual growth rate along with statistical bands showing when the growth is significantly above or below historical norms.
Formula Components
The indicator is based on a custom symbol combining multiple central bank balance sheets:
Federal Reserve balance sheet (FRED)
Bank of Japan assets converted to USD (FX_IDC*FRED)
European Central Bank assets converted to USD (FX_IDC*FRED)
Subtracting Fed reverse repo operations (FRED)
Subtracting Treasury General Account (FRED)
Calculations
Year-over-Year Percentage Change: Calculates the percentage change between the current value and the value from exactly one year ago (252 trading days).
Formula: ((current - year_ago) / year_ago) * 100
Statistical Measures:
Mean (Average): The 252-day simple moving average of the YoY percentage changes
Standard Deviation: The 252-day standard deviation of YoY percentage changes
Display Components
The indicator displays:
Main Line: YoY percentage change (green when positive, red when negative)
Zero Line: Reference line at 0% (gray dashed)
Mean Line: Average YoY change over the past 252 days (blue)
Standard Deviation Bands: Shows +/- 1 standard deviation from the mean
Upper band (+1 StdDev): Green, line with breaks style
Lower band (-1 StdDev): Red, line with breaks style
Interpretation
Values above zero indicate YoY growth in central bank assets
Values below zero indicate YoY contraction
Values above the +1 StdDev line indicate unusually strong growth
Values below the -1 StdDev line indicate unusually severe contraction
Crossing above/below the mean line can signal shifts in central bank policy trends
Usage
This indicator is useful for:
Monitoring global central bank liquidity trends
Identifying unusual periods of balance sheet expansion/contraction
Analyzing correlations between central bank activity and market performance
Anticipating potential market impacts from changes in central bank policy
The 252-day lookback period (approximately one trading year) provides a balance between statistical stability and responsiveness to changing trends in central bank behavior.

Bollinger Bands Sigma 1-7Length defaults to 200 for 200 DMA.
Uses standard deviation bands so you can easily see when prices hit extreme sigma deviations (like 4σ or beyond).
Ready to use in latest TradingView Pine Editor.

BLCKBOX Relative Strength IndexAnother quick 'n dirty RSI Indicator based on the Trading View RSI with extra prompts on the main chart showing when an asset is over bought or over sold.

MA Trendline with Angle LockThis indicator is just white line in screenshot (and will show the MA it is using).... This grabs the slope of the MA and makes a trendline out of it until the angle changes by x percentage then it recalculates. Mimics what a 2x sma envelope does to a smaller sma envelope... carves out the impulses just with straight rather than curved edges if that makes sense. Envelopes are shown as an example.

BLCKBOX MACD IndicatorThis indicator is based on the standard Trading View MACD Indicator with added visual prompts to take the guess work out of buying and selling. Only use this indicator when you decide to get in or get out. Used in conjunction with "BLCKBOX Buying / Selling Sentiment" indicator.


Precision Swing Point color (PSP) IndicatorPSP Quarterly Theory indicator - Anyone can see source code, if you make some improvements (true opens, ssmt.. etc) to it let me know. we are a community and should share knowledge. If i didnt believe we are all one, i wouldnt have put this script public. Credits to medic, daye, jacob
1. Blue dot: PSP in NQ
2. Red dot: PSP in ES
3. Green dot: PSP YM
4. Yellow dot: PSP more than one asset

SMC Structures and FVG📌 SMC Structures + FVG + Trend Viewer Pro
This advanced indicator helps traders visualize market structure with key tools:
✅ Break of Structure (BOS)
✅ Change of Character (CHoCH)
✅ Current Structure
✅ Fair Value Gaps (FVG)
✅ Automatic Fibonacci Levels
✅ Fixed Top-Right Trend Viewer (Bullish, Bearish, Sideways)
Designed for Smart Money Traders, this tool combines multiple key elements into one easy-to-use package. Perfect for day trading, swing trading, and spotting key zones.
⚡ Disclaimer:
This indicator is for educational purposes only. It is not financial advice. Please trade responsibly and use proper risk management.
📌 SMC Structures + FVG + Trend Viewer Pro
อินดิเคเตอร์ที่ออกแบบมาเพื่อช่วยให้นักเทรดมองเห็นโครงสร้างตลาดอย่างชัดเจนด้วยเครื่องมือสำคัญ:
✅ Break of Structure (BOS)
✅ Change of Character (CHoCH)
✅ โครงสร้างปัจจุบัน
✅ Fair Value Gaps (FVG)
✅ เส้น Fibonacci อัตโนมัติ
✅ ตัวบอกแนวโน้มค้างมุมขวาบน (Bullish, Bearish, Sideways)
เหมาะสำหรับสาย Smart Money, Day Trade, Swing Trade และผู้ที่เน้นหาจุดเข้าออกในโซนสำคัญ
⚡ คำเตือน:
อินดิเคเตอร์นี้ใช้เพื่อการศึกษาเท่านั้น ไม่ใช่คำแนะนำทางการเงิน โปรดบริหารจัดการความเสี่ยงอย่างเหมาะสม


Trump/Biden Market RegimesHave you ever wondered if it's Trump's stock market (up) or Biden's stock market (down)? Think no more!

BLCKBOX Buying / Selling SentimentThis indicator attempts to predict buying and selling sentiment. It may help?

AL-SAT Sinyali (Dip AL + Heikin Ashi)Buy: Combines RSI, MACD, volume, and trend signals
Sell: RSI>70 + MACD cross down
Target: Auto 10% line, profit shown
Dip Buy: RSI<30 + dip zone + HA bullish
Note: Use with context; HA may delay signals.

Simple Spread Viewer (con texto)Indica spread con numeros, en tiempo real. Ademas lo marca tambien con un grafico

CUSTOM PRO RANGE V2.0 with AlertsCore Functions
Tracks High/Low Ranges
Daily (DR) or Initial (IDR) ranges within custom time windows (e.g., 9:30 AM–4:00 PM).
Optional extended hours (e.g., overnight).
Visual Tools
Draws boxes/lines for range boundaries, midpoints, and opening prices.
Custom colors/styles for clarity.
Smart Alerts
Notifies when price breaks high/low/mid of the range.
Avoids spam with once-per-bar alerts.
Flexible Timeframes
Works for intraday, daily, or even quarterly ranges with minor tweaks.
🎯 Who It Helps
Day Traders: Spot breakouts/reversals.
Swing Traders: Identify key support/resistance.
Analysts: Study price behavior in specific sessions.

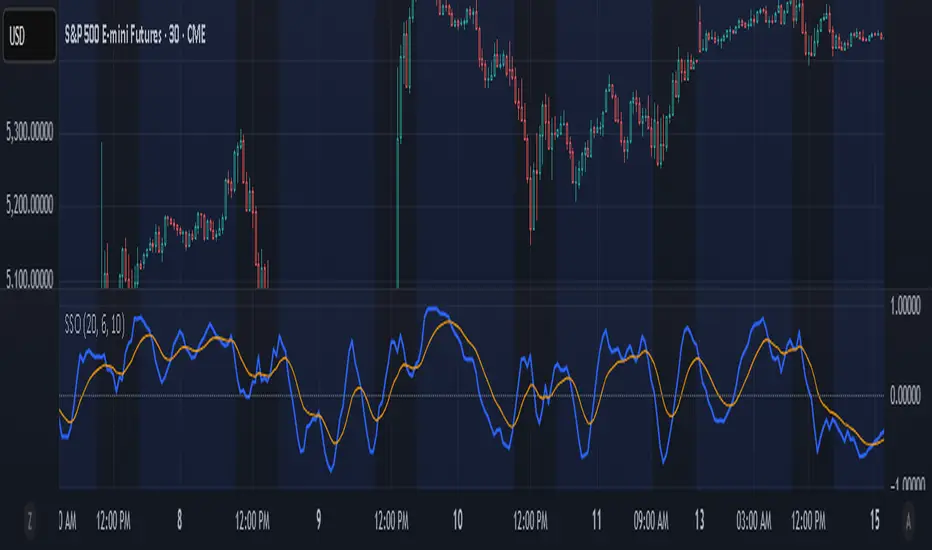
Sine Swing OscillatorThe Sine Swing Oscillator (SSO) is a custom momentum indicator that transforms price movement into a sine-based oscillator ranging from -1 to +1. It does this by measuring the deviation of the current price from a reference price, which is updated at fixed bar intervals. The price deviation is normalized using the Average True Range (ATR) over the same interval, then mapped through a sine transformation to create a bounded oscillator. This transformation helps identify cyclical price behavior in a consistent range.
The resulting sine values are smoothed using a Simple Moving Average (SMA), and a signal line is derived by applying an Exponential Moving Average (EMA) to the smoothed oscillator. Traders can use signal line crossovers, or moves through the zero line, to help identify potential entry or exit signals based on cyclical momentum shifts.
The oscillator and signal line are plotted in a separate pane, with user-configurable smoothing lengths and colors. The zero line is also included for reference.
MAK Entry Zoneindicator("MAK Entry Zone", overlay=true)
// Detect MAK Reversal again
bearReversal = high > high and close < open
bullReversal = low < low and close > open
bearConfirm = bearReversal and close < close
bullConfirm = bullReversal and close > close
// Draw zone (line) at reversal candle's high/low
var line buyZoneLine = na
var line sellZoneLine = na
if (bullConfirm)
buyZoneLine := line.new(bar_index, low , bar_index + 20, low , color=color.green, style=line.style_dashed)
if (bearConfirm)
sellZoneLine := line.new(bar_index, high , bar_index + 20, high , color=color.red, style=line.style_dashed)


TUE ADX/MACD Confluence Strategy V1.0📈 TUE ADX/MACD Confluence Strategy with SL/TP & PineConnector Integration
This strategy is designed to capture trend-following entries using the ADX (Average Directional Index) and MACD (Moving Average Convergence Divergence) indicators, enhanced with built-in Stop Loss (SL) and Take Profit (TP) management. It is fully compatible with PineConnector, allowing for real-time trade automation on supported brokers via MT4/MT5.
🔍 Core Logic:
Entry Signals:
Long Entry: When +DI > -DI, MACD Line > Signal Line, and ADX confirms a strong trend.
Short Entry: When -DI > +DI, MACD Line < Signal Line, and ADX confirms a strong trend.
Risk Management:
Configurable Stop Loss and Take Profit percentages.
Exits are triggered when either SL or TP is hit.
Projections:
Visual SL/TP projection lines for each position.
Overlay:
Colored candles for visual trend confirmation.
Entry markers for quick signal recognition.
🔧 Customizable Inputs:
ADX & MACD lengths
SL/TP percentages
Candle coloring toggle
Signal visibility toggle
🟢 PineConnector Integration:
This strategy is ideal for use with PineConnector, enabling you to:
Execute trades in real time on your preferred broker.
Use it in live, paper, or demo trading environments.
Automate your strategy with zero coding — simply connect, authorize, and trade.

ES/MES 65% Confluence Strategy📈 Designed for ES/MES intraday futures trading on 1–5 minute charts
✅ Signals a trade only when 65%+ of 8 confluence conditions are met
🔍 Confluence conditions include: trend alignment, momentum, price structure, VWAP proximity, volume, volatility, and candle strength
🕒 Uses the 15-minute Opening Range for breakout/reversal structure
🎯 Fixed 5-point stop loss and 5-point target with optional trailing stop every 5 points of profit
📦 Automatically displays risk/reward zones and dynamic trailing stop for each signal
⚠️ Includes alerts for Buy and Sell signal triggers
🧠 Suitable for traders who want structured entries based on multiple confirmation layers

Comercial Trader -Vol. Desvio PadrãoScript criado para fazer a distribuição de volatilidade do ativo pelo desvio padrão
