LANZ Strategy 4.0🔷 LANZ Strategy 4.0 — Trend Impulse Detection with Risk Management
LANZ Strategy 4.0 is a multi-indicator trend strategy designed for short to medium-term trading on any asset or timeframe. It combines Parabolic SAR, Supertrend, ADX, and time zone highlighting to detect and confirm trend impulses, while managing entries with dynamic Stop Loss (SL) and Take Profit (TP) levels.
🧠 Core Components:
Parabolic SAR: Identifies short-term trend reversals.
Supertrend: Highlights trend continuation zones.
ADX Filter: Ensures trend strength by filtering entries when ADX exceeds a defined threshold.
Impulse Detection Logic: Detects and confirms movement impulses with a counter, only generating trade signals on confirmed sequences.
Risk Management: Calculates dynamic SL/TP with a default risk-reward ratio of 1:2, minimum SL of 4 pts, and maximum of 12 pts.
📊 Visual Features:
Trend lines from Supertrend and SAR.
Colored background zones for different sessions (Asia, NY).
Labels and lines for entry, SL, and TP.
Movement number labels help visualize impulse progression.
Alerts when a new impulse is confirmed.
⚙️ How It Works:
The strategy waits for a confirmed impulse (i.e., change in SAR + Supertrend + ADX filter).
Once a valid impulse is confirmed:
A trade signal (BUY/SELL) is shown.
SL and TP levels are calculated and drawn.
The script monitors live price to determine if SL or TP is hit.
Impulse counter advances to label movement progression.
🔔 Alerts:
You will receive an alert each time a new valid impulse is confirmed, indicating a potential trading opportunity.
📝 Notes:
Script is intended for discretionary or assisted trading, not automated execution.
Works best during active sessions with visible trend direction.
You can adjust ATR period, multiplier, SL padding, and impulse thresholds.
Credits:
Developed by LANZ combines established technical indicators and original impulse-count logic.
Fractal

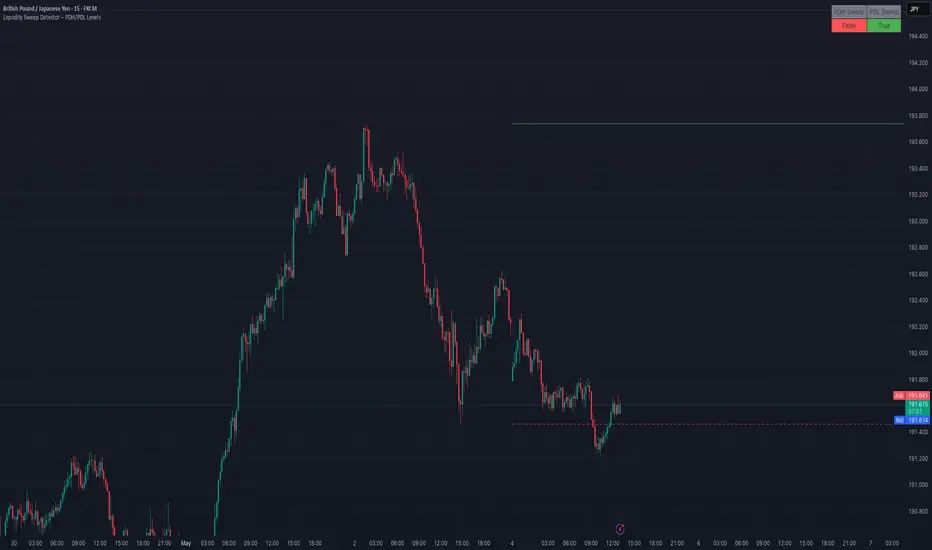
Liquidity Sweep Detector – PDH/PDL LevelsPrevious Day High/Low Liquidity Sweep Detector (Intraday Accurate)
This indicator tracks the previous day's high and low using intraday data, rather than the daily candle, ensuring precise sweep detection across lower timeframes (15m to 4H).
It monitors for liquidity sweeps—moments when price briefly moves above the previous high or below the previous low—and visually marks these events on the chart.
Key Features
Intraday-accurate PDH/PDL tracking
Real-time sweep detection
On-chart labels marking sweep events
Toggleable table showing sweep status
Alert conditions for PDH/PDL sweep triggers
Best For
Traders who use Smart Money Concepts (SMC), liquidity-based strategies, or look for stop hunts and reversal zones tied to key prior-day levels.
Works well across FX, crypto, and indices on 15m, 1H, and 4H charts.
Combined Indicator: SMMA+Fractals+SessionsJust a combination of 3 main indicator; 5SMMA + Fractal + Session. Feel free to use it.

ETH to RTH Gap DetectorETH to RTH Gap Detector
What It Does
This indicator identifies and tracks custom-defined gaps that form between Extended Trading Hours (ETH) and Regular Trading Hours (RTH). Unlike traditional gap definitions, this indicator uses a specialized approach - defining up gaps as the space between previous session close high to current session initial balance low, and down gaps as the space from previous session close low to current session initial balance high. Each detected gap is monitored until it's touched by price.
Key Features
Detects custom-defined ETH-RTH gaps based on previous session close and current session initial balance
Automatically identifies both up gaps and down gaps
Visualizes gaps with color-coded boxes that extend until touched
Tracks when gaps are filled (when price touches the gap area)
Offers multiple display options for filled gaps (color change, border only, pattern, or delete)
Provides comprehensive statistics including total gaps, up/down ratio, and touched gap percentage
Includes customizable alert system for real-time gap filling notifications
Features toggle options for dashboard visibility and weekend sessions
Uses time-based box coordinates to avoid common TradingView drawing limitations
How To Use It
Configure Session Times : Set your preferred RTH hours and timezone (default 9:30-16:00 America/New York)
Set Initial Balance Period : Adjust the initial balance period (default 30 minutes) for gap detection sensitivity
Monitor Gap Formation : The indicator automatically detects gaps between the previous session close and current session IB
Watch For Gap Fills : Gaps change appearance or disappear when price touches them, based on your selected style
Check Statistics : View the dashboard to see total gaps, directional distribution, and touched percentage
Set Alerts : Enable alerts to receive notifications when gaps are filled
Settings Guide
RTH Settings : Configure the start/end times and timezone for Regular Trading Hours
Initial Balance Period : Controls how many minutes after market open to calculate the initial balance (1-240 minutes)
Display Settings : Toggle gap boxes, extension behavior, and dashboard visibility
Filled Box Style : Choose how filled gaps appear - Filled (color change), Border Only, Pattern, or Delete
Color Settings : Customize colors for up gaps, down gaps, and filled gaps
Alert Settings : Control when and how alerts are triggered for gap fills
Weekend Session Toggle : Option to include or exclude weekend trading sessions
Technical Details
The indicator uses time-based coordinates (xloc.bar_time) to prevent "bar index too far" errors
Gap boxes are intelligently limited to avoid TradingView's 500-bar drawing limitation
Box creation and fill detection use proper range intersection logic for accuracy
Session detection is handled using TradingView's session string format for reliability
Initial balance detection is precisely calculated based on time difference
Statistics calculations exclude zero-division scenarios for stability
This indicator works best on futures markets with extended and regular trading hours, especially indices (ES, NQ, RTY) and commodities. Performs well on timeframes from 1-minute to 1-hour.
What Makes It Different
Most gap indicators focus on traditional open-to-previous-close gaps, but this tool offers a specialized definition more relevant to ETH/RTH transitions. By using the initial balance period to define gap edges, it captures meaningful price discrepancies that often provide trading opportunities. The indicator combines sophisticated gap detection logic with clean visualization and comprehensive tracking statistics. The customizable fill styles and integrated alert system make it practical for both chart analysis and active trading scenarios.

BTC Markup/Markdown Zones by Koenigsegg📈 BTC Markup/Markdown Zones
A handcrafted indicator designed to mark Bitcoin's most critical High Time Frame (HTF) structure shifts. This tool overlays true institutional-level Markup and Markdown Zones, selected manually after deep market review. Whether you're testing strategies or actively trading, this tool gives you the bigger picture at all times.
🔍 Key Features:
✅ HTF Markup & Markdown Zones
Every zone is manually selected — no indicators, no repainting. Just raw market history and real structure.
✅ Two Display Modes
• Background Zones — soft overlays with low opacity for visual context — with the option to increase opacity manually if desired.
• Start Candle Highlight — sharply highlighted candle marking the final pivot before a macro reversal.
✅ Custom Color Controls (Style Tab)
All visual styling lives in the Style tab, with clearly labeled fields:
• Markup Zone
• Markdown Zone
• Start Candle Highlight Markup
• Start Candle Highlight Markdown
✅ Minimal Input Section
Just one toggle: display mode. Everything else is kept clean and intuitive.
🧠 Purpose:
This script is made for any timeframe:
• Zoom into lower timeframes to know whether you're trading inside a Markup or Markdown
• Use it during strategy testing for true structural awareness
📅 Handpicked Macro Turning Points:
Each zone originates from a manually confirmed candle — the last meaningful candle before a shift in control between bulls and bears:
• FRI 19 AUG 2011 12PM – MARK DOWN
• THU 20 OCT 2011 12AM – MARK UP
• WED 10 APR 2013 12PM – MARK DOWN
• FRI 12 APR 2013 12PM – MARK UP
• SAT 30 NOV 2013 12AM – MARK DOWN
• WED 14 JAN 2015 12PM – MARK UP
• SUN 17 DEC 2017 12PM – MARK DOWN
• SAT 15 DEC 2018 12PM – MARK UP
• WED 14 APR 2021 4AM – MARK DOWN
• TUE 22 JUN 2021 12PM – MARK UP
• WED 10 NOV 2021 12PM – MARK DOWN
• MON 21 NOV 2022 8PM – MARK UP
• THU 14 MAR 2024 4AM – MARK DOWN
• MON 5 AUG 2024 12PM – MARK UP
• MON 20 JAN 2025 4AM – MARK DOWN
💡 Zones are manually updated by me after each new confirmed Markup or Markdown.
🧬 Fractal Structure for MTF Systems
Price is fractal — meaning the same principles of structure repeat across all timeframes. In Version 2, this tool evolves by introducing manually selected sub-zones inside each High Time Frame (HTF) Markup or Markdown. These sub-zones reflect Medium Timeframe (MTF) structure shifts, offering precision for traders who operate on both intraday and swing levels.
This makes the indicator ideal for low timeframe (LTF) Markup/Markdown awareness — whether you're managing 15m entries or building multi-timeframe confluence systems.
No auto-zones. No guesswork. Just clean, intentional structure division within the broader trend, handpicked for maximum clarity and edge.
💡 Pro Tip:
When price is inside a Markup Zone, shorting becomes riskier — you're trading against a macro bullish structure.
When inside a Markdown Zone, longing becomes riskier — you're fighting against confirmed bearish momentum.
Use this tool to stay aligned with the broader move, especially when zoomed into smaller timeframes or managing entries/exits during intraday setups.
📈 Markup Phase – Bullish Sentiment
Definition: A period where price makes higher highs and higher lows — the uptrend is in full force.
Why sentiment is bullish:
- Institutions and smart money are already positioned long.
- Public/institutional demand drives prices up.
- Momentum is supported by positive news, breakouts, and FOMO.
- Higher highs confirm buyers are in control.
📉 Markdown Phase – Bearish Sentiment
Definition: A period where price makes lower lows and lower highs — clear downtrend.
Why sentiment is bearish:
- Distribution has already occurred, and supply outweighs demand.
- Smart money is short or sidelined, waiting for deeper prices.
- Panic selling or trend-following traders add downside momentum.
- Lower lows confirm sellers are in control.
❌ Trading Against the Trend — Consequences:
-Reduced Probability of Success
-You’re fighting the dominant flow. Most participants are pushing in the opposite direction.
-Drawdowns & Stop-Outs
-Countertrend trades often get wicked or flushed before any meaningful move, especially without structure-based entries.
-Low Risk-Reward Ratio
-Trends offer sustained moves. Countertrend trades may have small take-profit zones or chop.
-Mental Drain & Doubt
-Fighting momentum causes anxiety, second-guessing, and emotional reactions.
-Missed Opportunities
-Focusing on fighting the trend makes you blind to the high-probability setups with the trend.
-Increased Transaction Costs
-More stop-outs and re-entries mean more fees, more friction.
-FOMO from Watching the Trend Run
-Entering countertrend means you might watch the trend explode without you.
-Confirmation Bias & Stubbornness
-Countertrend traders often look for reasons to justify staying in the wrong direction — leading to bigger losses.
🧠 Summary
In markup = bulls dominate → you swim with the current.
In markdown = bears dominate → going long is like pushing a rock uphill.
Trading with the trend is not just safer, it's smarter. The edge lives in momentum — not ego.
⚠️ Disclaimer
This indicator is for educational and analytical use only. It is not financial advice and should not be relied on for decision-making without personal analysis.
This is not a predictive tool. No indicator can forecast upcoming price movements.
What you see here is based purely on past market behavior — specifically, historical tops and bottoms that marked the start of confirmed reversals.
This script does not know where the next reversal begins, nor can it determine where a new Markup or Markdown starts or ends. It is designed to provide context, not prediction.
Always trade with responsibility and perform your own due diligence.

Strict Origin Zone Detectorinventory theory indicator test
Searches for 2 or more consecutive doji candles → marks this as "origin" (grey box).
Waits for 2 strong candles (bullish or bearish) → surge → records its high as TP.

Liquidity-Based Entry Zonestest of the inventory theory indicator
Searches for 2 or more consecutive doji candles → marks this as "origin" (grey box).
Waits for 2 strong candles (bullish or bearish) → surge → records its high as TP.
Calculates Fibonacci level of 0.79 (entry) and 1.03 (SL) → plots them.

Global Liquidity IndexThis indicator tracks worldwide liquidity by aggregating the sum of the global M2 money supply, and major central bank balance sheets and subtracting the U.S. Treasury General Account (TGA), the Federal Reserve’s Reverse Repo (RRP) facility. It offers insight into the overall liquidity environment, often a key driver of risk asset performance.

Fractals + FVG By SHARKImbalance (IMB/FVG/Disbalance/Inefficiency)
An imbalance is an impulsive price movement accompanied by a lack of balance between buyers and sellers. Simply put, it’s a disbalance that creates inefficiency.
In simpler terms, it is a strong impulse where almost no volume was traded by one side (for example, in a bullish impulse, there was very little selling volume). This creates a gap or an inefficient zone that needs to be filled with liquidity — and this is exactly what the market maker (or algorithm) does.
Using this indicator, you can make your work with inefficiencies much easier, as they will now be automatically highlighted on the chart.

Overnight ES Strategy: CBC + Fractal + RSI + ATR FilterThis script is designed for overnight trading of the E-mini S&P 500 futures (ES) between 6 PM and 11 PM EST.
It combines multiple technical confluences to generate high-probability buy and sell signals, focusing on volatility-rich, low-liquidity evening sessions.
Key Features:
Candle Body Confluence (CBC) Approximation:
Identifies candles with small real bodies compared to total range, simulating consolidation zones where price is likely to reverse.
Williams Fractal Confirmation:
Detects local tops and bottoms based on 5-bar fractal reversal patterns, helping validate breakout or reversal points.
RSI Filter:
Ensures momentum is supportive — buys only when RSI < 35 (oversold) and sells only when RSI > 65 (overbought).
ATR Volatility Filter:
Trades are only allowed if the Average True Range (ATR) exceeds a user-defined threshold, filtering out low-volatility, risky environments.
Time Session Control:
Signals are only generated during the user-defined evening session (default: 6 PM to 11 PM EST) to match market behavior.
Real-Time Alerts Enabled:
Alerts can be set for BUY or SELL conditions, enabling mobile notifications, emails, or pop-ups without constant chart monitoring.
Recommended Settings:
Chart Timeframe: 15-minute or 30-minute candles
Assets: ES Mini (ES1!), NQ Mini, or other CME futures
Session: New York Time (EST)
ATR Threshold: Adjust based on market conditions; 5.0 suggested starting point for ES Mini on 15m.
Important:
This script only plots signals, it does not auto-execute trades.
Always backtest and paper trade before using live capital.
Volatility can vary; consider adjusting RSI and ATR filters based on market environment.
Credits:
Script designed based on confluence of price action, momentum, reversal structure, and volatility filtering principles used by professional traders.
Inspired by Candle Body Confluence (CBC) theory and Williams fractal techniques.

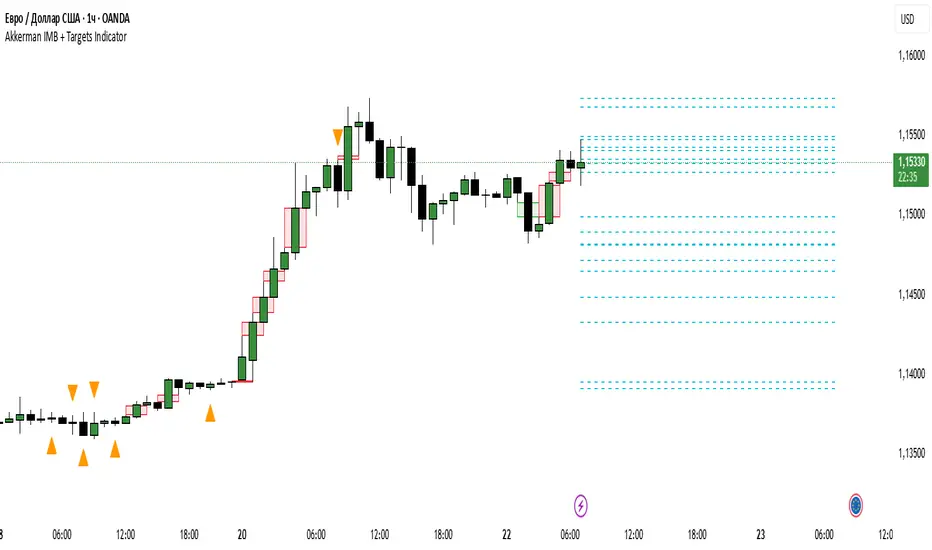
Akkerman IMB + Targets IndicatorAkkerman IMB + Targets Indicator
The Akkerman IMB + Targets Indicator is a powerful tool for traders who use the Smart Money Concept (SMC) methodology for intraday trading. This indicator combines several key elements of technical analysis, such as IMB (Imbalance) zones, liquidity zones, and intraday targets, to help traders identify significant levels on the chart for potential entry and exit points.
Main Features of the Indicator:
IMB (Imbalance) Zones:
The indicator detects IMB zones (imbalances) on the chart, which are often significant for the market because these zones can signal unsupported price moves where the market may either retrace or continue the move.
Green box — indicates a bullish IMB, where the price moves downward but does not reach the previous "low" level.
Red box — indicates a bearish IMB, where the price moves upward but does not reach the previous "high" level.
Liquidity Zones:
The indicator automatically identifies liquidity zones, which are critical levels for potential retracements or breakouts. These zones are determined by equal highs and lows on the chart (where the price has made similar highs or lows).
Triangles or lines highlight levels where significant buy or sell orders might be gathered.
Intraday Target Lines:
The indicator generates targets for intraday trading based on support and resistance levels over the last 10 periods.
These target lines on the chart indicate potential entry or exit points based on the lowest and highest prices over the past 10 bars, which represent key points for trading within the current session.
Indicator Settings:
Show IMB: Toggle to show or hide IMB zones on the chart.
Show Liquidity Zones: Toggle to show or hide liquidity zones on the chart.
Show Targets (Intraday): Toggle to show or hide intraday target lines.
Max Targets (maxTargets): Set the maximum number of targets to display on the chart.
How to Use:
IMB Zones help identify potential retracement or breakout zones on the market. These zones are a critical part of Smart Money analysis, as markets often retrace to these areas after significant price moves.
Liquidity Zones provide clues about where large orders may be gathered, which could lead to a retracement or breakout.
Intraday Targets assist in identifying important levels for entering or exiting trades within the current session to take advantage of short-term price movements.
Important Notes:
This indicator works best on the 1-hour timeframe (H1) for more accurate and stable signals.
For maximum effectiveness, it is recommended to combine this indicator with other technical indicators and analysis methods.
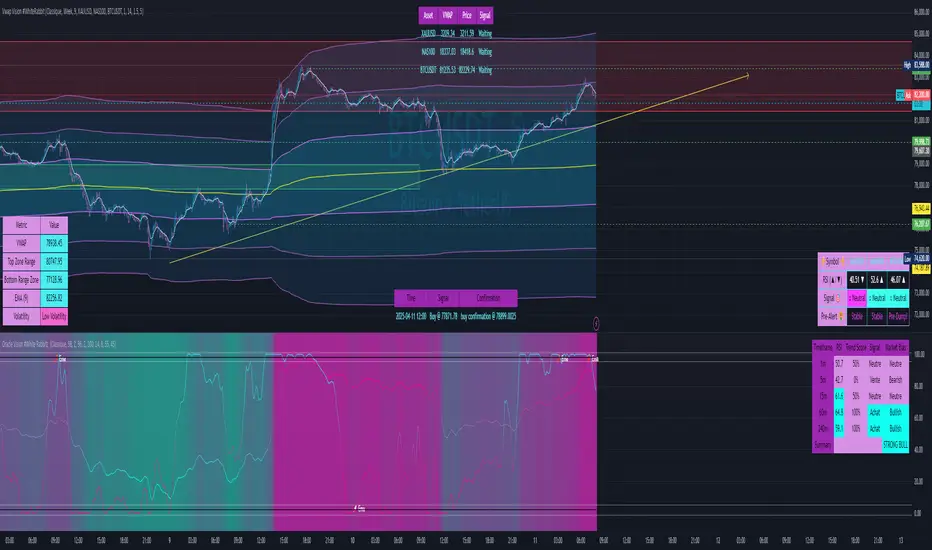
Vwap Vision #WhiteRabbitVWAP Vision #WhiteRabbit
This Pine Script (version 5) script implements a comprehensive trading indicator called "VWAP Vision #WhiteRabbit," designed for analyzing price movements using the Volume-Weighted Average Price (VWAP) along with multiple customizable features, including adjustable color themes for better visual appeal.
Features:
Customizable Color Themes:
Choose from four distinct themes: Classic, Dark Mode, Fluo, and Phil, enhancing the visual layout to match user preferences.
VWAP Calculation:
Uses standard VWAP calculations based on selected anchor periods (Session, Week, Month, etc.) to help identify price trends.
Band Settings:
Multiple bands are calculated based on standard deviations or percentages, with customization options to configure buy/sell zones and liquidity levels.
Buy/Sell Signals:
Generates clear buy and sell signals based on price interactions with the calculated bands and the exponential moving average (EMA).
Real-time Data Display:
Displays real-time signals and VWAP values for selected trading instruments, including XAUUSD, NAS100, and BTCUSDT, along with related alerts for trading opportunities.
Volatility Analysis:
Incorporates volatility metrics using the Average True Range (ATR) to assess market conditions and inform trading decisions.
Enhanced Table Displays:
Provides tables for clear visualization of trading signals, real-time data, and performance metrics.
This script is perfect for traders looking to enhance their analysis and gain insights for making informed trading decisions across various market conditions.
Stoch_RSIStochastic RSI – Advanced Divergence Indicator
This custom indicator is an advanced version of the Stochastic RSI that not only smooths and refines the classic RSI input but also automatically detects both regular and hidden divergences using two powerful methods: fractal-based and pivot-based detection. Originally inspired by contributions from @fskrypt, @RicardoSantos, and later improved by developers like @NeoButane and @FYMD, this script has been fully refined for clarity and ease-of-use.
Key Features:
Dual Divergence Detection:
Fractal-Based Divergence: Uses a four-candle pattern to confirm top and bottom fractals for bullish and bearish divergences.
Pivot-Based Divergence: Employs TradingView’s built-in pivot functions for an alternate view of divergence conditions.
Customizable Settings:
The inputs are organized into logical groups (Stoch RSI settings, Divergence Options, Labels, and Market Open Settings) allowing you to adjust smoothing periods, RSI and Stochastic lengths, and divergence thresholds with a user-friendly interface.
Visual Enhancements:
Plots & Fills: The indicator plots both the K and D lines with corresponding fills and horizontal bands for quick visual reference.
Divergence Markers: Diamond shapes and labeled markers indicate regular and hidden divergences on the chart.
Market Open Highlighting: Optional histogram plots highlight the market open candle based on different timeframes for stocks versus non-forex symbols.
Intrinsic Event (Multi DC OS)Overview
This indicator implements an event-based approach to analyze price movements in the foreign exchange market, inspired by the intrinsic time framework introduced in Fractals and Intrinsic Time - A Challenge to Econometricians by U. A. Müller et al. (1995). It identifies significant price events using an intrinsic time perspective and supports multi-agent analysis to reflect the heterogeneous nature of financial markets. The script plots these events as lines and labels on the chart, offering a visual tool for traders to understand market dynamics at different scales.
Key Features
Intrinsic Events : The indicator detects directional change (DC) and overshoot (OS) events based on user-defined thresholds (delta), aligning with the paper’s concept of intrinsic time (Section 6). Intrinsic time redefines time based on market activity, expanding during volatile periods and contracting during inactive ones, rather than relying on a physical clock.
Multi-Agent Analysis : Supports up to five agents, each with its own threshold and color settings, reflecting the heterogeneous market hypothesis (Section 5). This allows the indicator to capture the perspectives of market participants with different time horizons, such as short-term FX dealers and long-term central banks.
How It Works
Intrinsic Events Detection : The script identifies two types of events using intrinsic time principles:
Directional Change (DC) : Triggered when the price reverses by the threshold (delta) against the current trend (e.g., a drop by delta in an uptrend signals a "Down DC").
Overshoot (OS) : Occurs when the price continues in the trend direction by the threshold (e.g., a rise by delta in an uptrend signals an "Up OS").
DC events are plotted as solid lines, and OS events as dashed lines, with labels like "Up DC" or "OS Down" for clarity. The label style adjusts based on the trend to ensure visibility.
Multi-Agent Setup : Each agent operates independently with its own threshold, mimicking market participants with varying time horizons (Section 5). Smaller thresholds detect frequent, short-term events, while larger thresholds capture broader, long-term movements.
Settings
Each agent can be configured with:
Enable Agent : Toggle the agent on or off.
Threshold (%) : The percentage threshold (delta) for detecting DC and OS events (default values: 0.1%, 0.2%, 0.5%, 1%, 2% for agents 1–5).
Up Mode Color : Color for lines and labels in up mode (DC events).
Down Mode Color : Color for lines and labels in down mode (OS events).
Usage Notes
This indicator is designed for the foreign exchange market, leveraging its high liquidity, as noted in the paper (Section 1). Adjust the threshold values based on the instrument’s volatility—higher volatility leads to more intrinsic events (Section 4). It can be adapted to other markets where event-based analysis applies.
Reference
The methodology is based on:
Fractals and Intrinsic Time - A Challenge to Econometricians by U. A. Müller, M. M. Dacorogna, R. D. Davé, O. V. Pictet, R. B. Olsen, and J. R. Ward (June 28, 1995). Olsen & Associates Preprint.

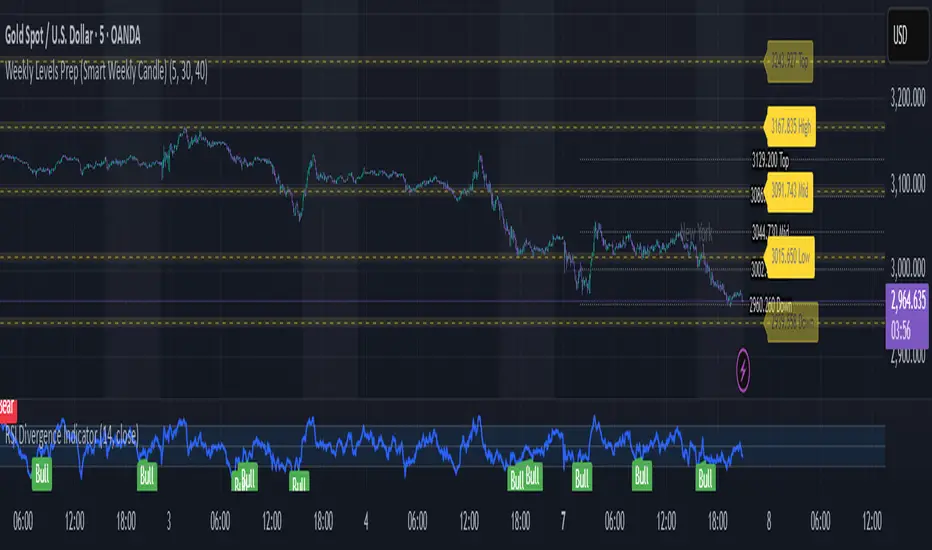
Weekly Levels Prep (Smart Weekly Candle)This script draws key weekly levels based on the most recent completed weekly candle (Monday–Friday). It automatically calculates and plots:
✅ Weekly High & Low
✅ Midpoint (50% level)
✅ Extension levels above and below
All levels are dynamically updated every new week and are visually marked with clean color-coded horizontal lines. Price values are shown near the price axis for clear visibility across all timeframes.
Great for:
Weekly preparation
Swing trading setups
Mean reversion and range breakouts
🔄 Works on all timeframes
🔍 Lightweight and non-intrusive
Built by a trader, for traders. 💼📈
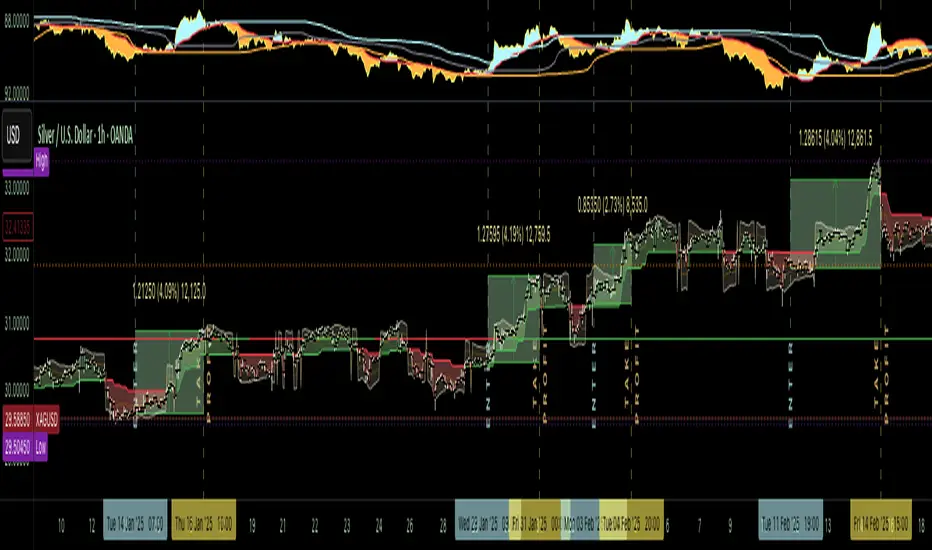
The Silver Lining – GSR🍯 This tool converts the Gold/Silver Ratio (GSR) into a precision timing lens for short-term traders operating inside digital silver markets. It reveals structural dominance, trend exhaustion, and regime inflection by comparing the GSR to its smoothed baseline and historical percentile rhythm. On high timeframes (1D+), it reflects macroeconomic sentiment shifts 📈.
🧐 The lower the timeframe, the higher the alpha; the 15m and 1h charts are where you will the hidden pots of gold. For LTF traders, it becomes a hyper-responsive bias filter — especially when paired with volatility-based confirmation systems like SUPeR TReND 2.718, as shown.
🧠 The core logic compares the GSR (gold ÷ silver) against a user-defined moving average (VWMA or EMA). A color-coded fill shifts based on direction: amber when gold leads, teal when silver gains strength. Percentile bands (20th, 50th, 80th) map structural zones — helping traders anchor trades based on confluence, not hype.
📊 In the example chart, four theoretical long trades are shown on the 1h chart, manually drawn on the 15m timeframe. Each begins when the GSR reverses from the 80th percentile or breaks below its MA. The trades occur precisely as silver tested support, with confirmation from SUPeR TReND’s trend shift. Although idealized, these aren’t guesses — they are compression-to-expansion sequences backed by macro relative strength flow. Several yielded gains exceeding 4%.
🏆 Best-case long trades occur when GSR rotates down through the 50th percentile and silver catches a reactive bid. Shorts appear when GSR rises through the upper percentile band while silver fails to hold key intraday levels. The percentile bands function like behavioral tiers:
🥈 Below 20th = Silver Dominance
⚠️ Around 50th = Crossover Area
🥇 Above 80th = Gold Dominance
🥈 Why silver? It’s faster, more emotional, and more manipulated than gold — which paradoxically makes it more tradable on low timeframes. Its range-bound nature is ideal for rinse-and-repeat systems. Because we trade the derivative (XAGUSD), there’s no friction or delivery constraint — just price action, clean and liquid.
⚖️ The underlying strategy isn’t just technical; it’s alchemical. The system begins with short-term trading in digital silver and funnels gains into physical gold — converting volatility into wealth. Over time, this establishes a perpetual motion model: when profits allow, trade silver, extract value, cash out and convert into gold. The account stays active, and the hedge keeps growing.
🔁 The Silver Lining isn’t a signal engine. It’s a structural overlay. It tells you when the market’s invisible bias is shifting — so your tactics stay aligned with macro rhythm.
🌊 Silver moves fast. Gold moves first. The Silver Lining helps you bridge that gap — with clarity, confluence, and edge.
FRACTAL DIMENSIONSFRACTAL DIMENSIONS was created to allow us to properly visualize
the higher time frame dimensional data, While remaining on a lower
time frame. The Fractal dimensions are basically the higher time frames.
Remaining on a lower time frame allows us to get tighter entries and exits.
Each dimension is set in a wave degree formation. From primary to sub-minute,
depending on the time frame being utilized.
These multidimensional wave degrees will be utilized later in the strategy.
This indicator was broken off of the whole for the sake of drawing lines.
The data here is just for debugging purposes and is not used in the strategy,
but yet remains pretty awesome by itself.
Fractal dimensions is the foundation of the main strategy to come.
Now that we have this data, what are we going to do with it?
Larry Williams POIV A/D [tradeviZion]Larry Williams' POIV A/D - Release Notes v1.0
=================================================
Release Date: 01 April 2025
OVERVIEW
--------
The Larry Williams POIV A/D (Price, Open Interest, Volume Accumulation/Distribution) indicator implements Williams' original formula while adding advanced divergence detection capabilities. This powerful tool combines price movement, open interest, and volume data to identify potential trend reversals and continuations.
FEATURES
--------
- Implements Larry Williams' original POIV A/D formula
- Divergence detection system:
* Regular divergences for trend reversal signals
* Hidden divergences for trend continuation signals
- Fast Mode option for earlier pivot detection
- Customizable sensitivity for divergence filtering
- Dynamic color visualization based on indicator direction
- Adjustable smoothing to reduce noise
- Automatic fallback to OBV when Open Interest is unavailable
FORMULA
-------
POIV A/D = CumulativeSum(Open Interest * (Close - Close ) / (True High - True Low)) + OBV
Where:
- Open Interest: Current period's open interest
- Close - Close : Price change from previous period
- True High - True Low: True Range
- OBV: On Balance Volume
DIVERGENCE TYPES
---------------
1. Regular Divergences (Reversal Signals):
- Bullish: Price makes lower lows while indicator makes higher lows
- Bearish: Price makes higher highs while indicator makes lower highs
2. Hidden Divergences (Continuation Signals):
- Bullish: Price makes higher lows while indicator makes lower lows
- Bearish: Price makes lower highs while indicator makes higher highs
REQUIREMENTS
-----------
- Works best with futures and other instruments that provide Open Interest data
- Automatically adapts to work with any instrument by using OBV when OI is unavailable
USAGE GUIDE
-----------
1. Apply the indicator to any chart
2. Configure settings:
- Adjust sensitivity for divergence detection
- Enable/disable Fast Mode for earlier signals
- Customize visual settings as needed
3. Look for divergence signals:
- Regular divergences for potential trend reversals
- Hidden divergences for trend continuation opportunities
4. Use the alerts system for automated divergence detection
KNOWN LIMITATIONS
----------------
- Requires Open Interest data for full functionality
- Fast Mode may generate more signals but with lower reliability
ACKNOWLEDGEMENTS
---------------
This indicator is based on Larry Williams' work on Open Interest analysis. The implementation includes additional features for divergence detection while maintaining the integrity of the original formula.

ZRK 30m This TradingView indicator draws alternating 30-minute boxes aligned precisely to real clock times (e.g., 10:00, 10:30, 11:00), helping traders visually segment intraday price action. It highlights every other 30-minute block with customizable colors, line styles, and opacity, allowing users to clearly differentiate between trading intervals. The boxes automatically adjust based on the chart’s timeframe, maintaining accuracy on 1-minute to 60-minute charts. Optional time labels can also be displayed for additional context. This tool is useful for identifying patterns, measuring volatility, or applying breakout strategies based on defined, consistent time windows across global trading sessions.

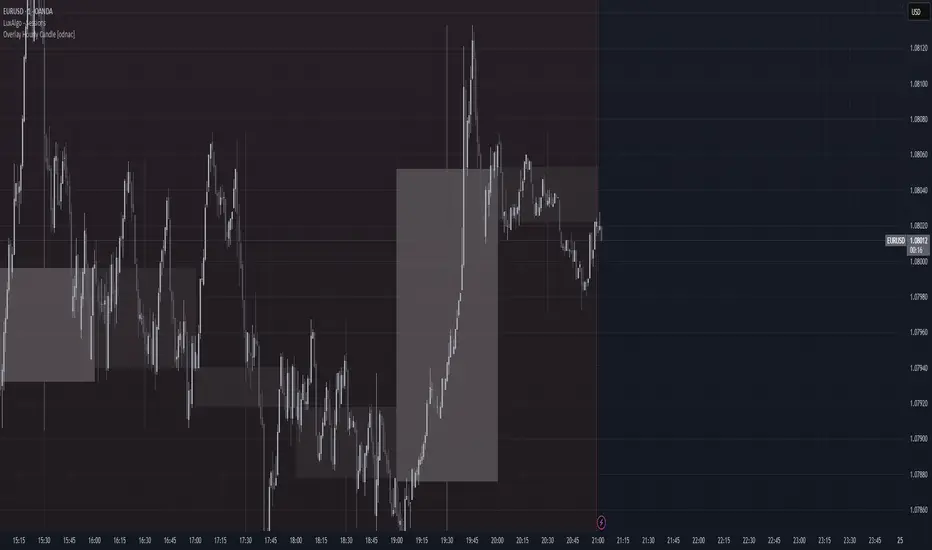
Overlay Hourly Candle [odnac] * This script overlays 1-hour candlestick representations on the chart.
* It captures the open, close, high, and low prices for each hourly period.
* The script dynamically updates as new hourly candles form and adjusts the
* box and wick positions accordingly.
*
* Features:
* - Draws an hourly candle with body and wicks.
* - Colors bullish candles in green and bearish candles in red.
* - Updates dynamically as new hourly candles form.
* - Uses TradingView's box and line functions to represent candle structures.
*
* Usage:
* - Add the script to your TradingView chart as an overlay.
* - Observe how the hourly candles appear distinctly on any timeframe.
Market StructureMarket Structure Indicator
The Market Structure indicator for TradingView helps traders identify key price action patterns by detecting swing highs and lows, visualizing trend structures, and marking potential areas of interest. It works by analyzing market swings and breakouts based on user-defined settings, making it useful for traders who follow Smart Money Concepts (SMC), price action strategies, or structure-based trading approaches.
How It Works and features:
This indicator tracks market structure shifts by analyzing price swings and breakouts.
1. Swing Points & Market Structure Shifts
Swing Width: Defines how many candles must separate two swing points (default: 3).
Higher Timeframe Swing Width (HTF): If on a higher timeframe (15M+), the indicator uses a different swing width setting (default: 7).
Break Type (Wick vs. Body): Choose whether market structure breaks are based on wicks (more sensitive) or candle bodies (more conservative).
2. Structure Visualization
Labels & Colors for Extremes: Mark highest highs (H) and lowest lows (L) on the chart.
Custom Styles: Choose between triangles or circles to represent swing points.
Trend & Breaks Visualization
3. Session-Specific Analysis
Set Trading Sessions (EST time): The indicator allows users to analyze specific market sessions (default: 9:30-10:30 AM EST).
Session Background Highlighting: Highlights the session timeframe on the chart for better visibility.
Apply Body Breaks to Session Only: Limits structure shifts based on candle bodies only during a chosen session (useful for session-based scalping strategies).
4. Points of Interest (POI) & Order Flow Shifts (OFS)
Extreme POI Zones: Highlights key structure breaks where strong price action occurred.
Order Flow Shifts (OFS) Lines: Identifies supply/demand changes with customizable styles and colors.
POI Box Customization: Allows traders to visualize liquidity zones where price reacted strongly.
Who Is This For?
✅ Smart Money Concept (SMC) Traders – Helps track liquidity grabs and structural shifts.
✅ Price Action Traders – Makes it easier to spot swing points and trend shifts.
✅ Breakout & Reversal Traders – Highlights market structure breaks for entry confirmation.
✅ Scalpers & Session-Based Traders – Allows session-specific market structure analysis.
How to Use It?
1️⃣ Adjust Swing Width: Set a number of candles between swing points.
2️⃣ Choose Break Type: Select Wick (aggressive) or Body (conservative) break confirmation.
3️⃣ Enable Sub-Structure & OFS: Visualize minor trends and order flow shifts.
4️⃣ Set Session Filters: Highlight market structure only during key trading hours.
5️⃣ Monitor POI & Trend Labels: Look for breakouts and retests at major swing points.
Conclusion:
The Market Structure Indicator provides a clear visual representation of market trends, breakouts, and liquidity areas, making it a powerful tool for traders who rely on structure-based trading. With extensive customization options, it adapts to various trading styles and strategies. 🚀📈

fractal candle The fractal candle technical indicator to identify potential trend reversals in financial markets. It works by counting a series of price bars and looking for specific patterns that indicate when a trend is likely to reverse.
How the Indicator Works:
Counting Candles:
The indicator compares the closing price of the current candle with the closing price from 4 candles ago.
If the current close is higher, the bullish (buy) count increases.
If the current close is lower, the bearish (sell) count increases.
When a count reaches 9 or 13, it may signal a trend reversal.
Buy and Sell Setup:
A buy setup occurs when there have been 9 consecutive candles where each close is lower than the close 4 candles before. This suggests a possible bullish reversal.
A sell setup occurs when there have been 9 consecutive candles where each close is higher than the close 4 candles before. This suggests a possible bearish reversal.
Support and Resistance Levels:
The indicator tracks previous highs and lows during buy/sell setups to identify potential support and resistance levels.
These levels can help traders decide where price might reverse or consolidate.
Candle Coloring for Visual Aid:
The script changes candle colors:
Red for sell signals 📉
Green for buy signals 📈
Different shades for overshoot conditions (extended trends)

ICT Bread and Butter Sell-SetupICT Bread and Butter Sell-Setup – TradingView Strategy
Overview:
The ICT Bread and Butter Sell-Setup is an intraday trading strategy designed to capitalize on bearish market conditions. It follows institutional order flow and exploits liquidity patterns within key trading sessions—London, New York, and Asia—to identify high-probability short entries.
Key Components of the Strategy:
🔹 London Open Setup (2:00 AM – 8:20 AM NY Time)
The London session typically sets the initial directional move of the day.
A short-term high often forms before a downward push, establishing the daily high.
🔹 New York Open Kill Zone (8:20 AM – 10:00 AM NY Time)
The New York Judas Swing (a temporary rally above London’s high) creates an opportunity for short entries.
Traders fade this move, anticipating a sell-off targeting liquidity below previous lows.
🔹 London Close Buy Setup (10:30 AM – 1:00 PM NY Time)
If price reaches a higher timeframe discount array, a retracement higher is expected.
A bullish order block or failure swing signals a possible reversal.
The risk is set just below the day’s low, targeting a 20-30% retracement of the daily range.
🔹 Asia Open Sell Setup (7:00 PM – 2:00 AM NY Time)
If institutional order flow remains bearish, a short entry is taken around the 0-GMT Open.
Expect a 15-20 pip decline as the Asian range forms.
Strategy Rules:
📉 Short Entry Conditions:
✅ New York Judas Swing occurs (price moves above London’s high before reversing).
✅ Short entry is triggered when price closes below the open.
✅ Stop-loss is set 10 pips above the session high.
✅ Take-profit targets liquidity zones on higher timeframes.
📈 Long Entry (London Close Reversal):
✅ Price reaches a higher timeframe discount array between 10:30 AM – 1:00 PM NY Time.
✅ A bullish order block confirms the reversal.
✅ Stop-loss is set 10 pips below the day’s low.
✅ Take-profit targets 20-30% of the daily range retracement.
📉 Asia Open Sell Entry:
✅ Price trades slightly above the 0-GMT Open.
✅ Short entry is taken at resistance, targeting a quick 15-20 pip move.
Why Use This Strategy?
🚀 Institutional Order Flow Tracking – Aligns with smart money concepts.
📊 Precise Session Timing – Uses market structure across London, New York, and Asia.
🎯 High-Probability Entries – Focuses on liquidity grabs and engineered stop hunts.
📉 Optimized Risk Management – Defined stop-loss and take-profit levels.
This strategy is ideal for traders looking to trade with institutions, fade liquidity grabs, and capture high-probability short setups during the trading day. 📉🔥
