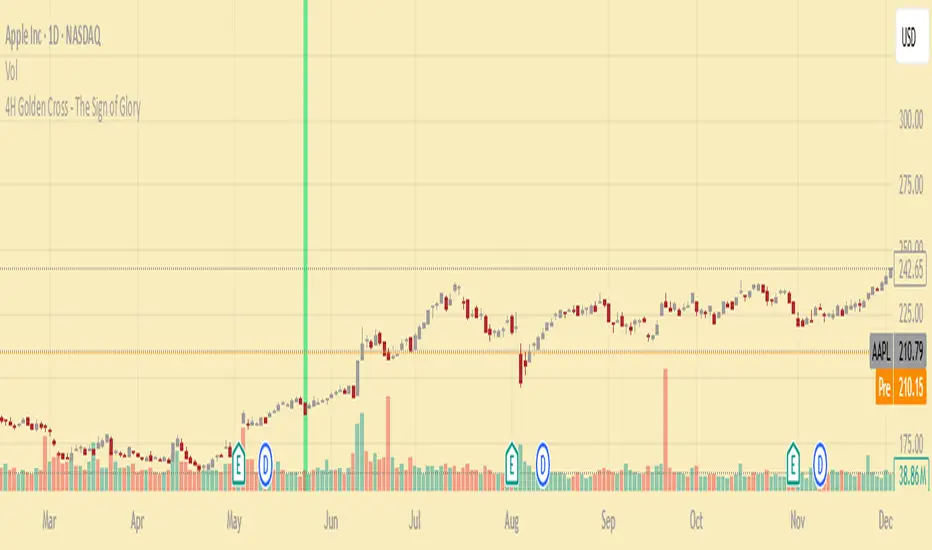
4H Golden Cross - The Sign of GloryCalculates the golden cross on the 4-hour timeframe
Displays the result on any timeframe
Draws a green vertical beam (a vertical line or background stripe) on the bar where the golden cross happened, so it’s clearly visible regardless of your chart timeframe
This is used to see the effectiveness of the 4h golden cross without having to change timeframes continually
Oscillators
RCI Strategy [PineIndicators]RCI Strategy
This strategy leverages the Rank Correlation Index (RCI) — a statistical oscillator that measures the relationship between time and price rank — combined with a configurable moving average filter. It offers clean, rule-based entries and exits, and visually enhanced trade tracking via labeled markers and boxes on the chart.
The RCI Strategy is well-suited for momentum traders looking to capture directional shifts with confirmation through RCI smoothing.
Core Logic
1. Rank Correlation Index (RCI)
Measures how closely price changes correlate with time rankings.
Values range between -100 and +100.
Thresholds at ±80 help identify potential reversals or extremes.
2. RCI Smoothing via Moving Average
A moving average (MA) is applied to the RCI to smooth out fluctuations.
Supported MA types:
SMA
EMA
SMMA (RMA)
WMA
VWMA
Users can disable the smoothing by selecting "None".
Trade Entry Logic
Long Entry: RCI crosses above the selected moving average.
Short Entry: RCI crosses below the moving average.
Entries are restricted by trade direction settings:
Long Only
Short Only
Long & Short
Visual Features
RCI Panel Display
Plots RCI line and its moving average in a separate pane.
Horizontal guide lines at 0, +80, and -80 help visualize signal zones.
Trade Labels on Chart
Buy Label: Plotted when a long entry is executed.
Close Label: Plotted when any position is closed.
Triangle markers for visual emphasis on direction change.
Trade Visualization Boxes
A colored box is drawn between entry and exit prices.
Green = profitable trade; Red = losing trade.
Two horizontal lines connect entry and exit prices for reference.
Customization Parameters
RCI Source: Select input price for the RCI (default: close).
RCI Length: Set sensitivity of the oscillator.
MA Type and Length: Choose and configure the smoothing filter.
Trade Direction Mode: Define whether to allow Long, Short, or both.
Use Cases
Swing traders who want to trade directional reversals with statistical backing.
Traders seeking a clean and visual strategy based on rank momentum.
Environments where both trend and range dynamics occur.
Conclusion
The RCI Strategy is a non-repainting, rule-based trading model that combines rank correlation momentum with smoothed trend logic. Its clean visual markers, labeled trades, and flexible MA filters make it a valuable tool for discretionary and systematic traders alike.

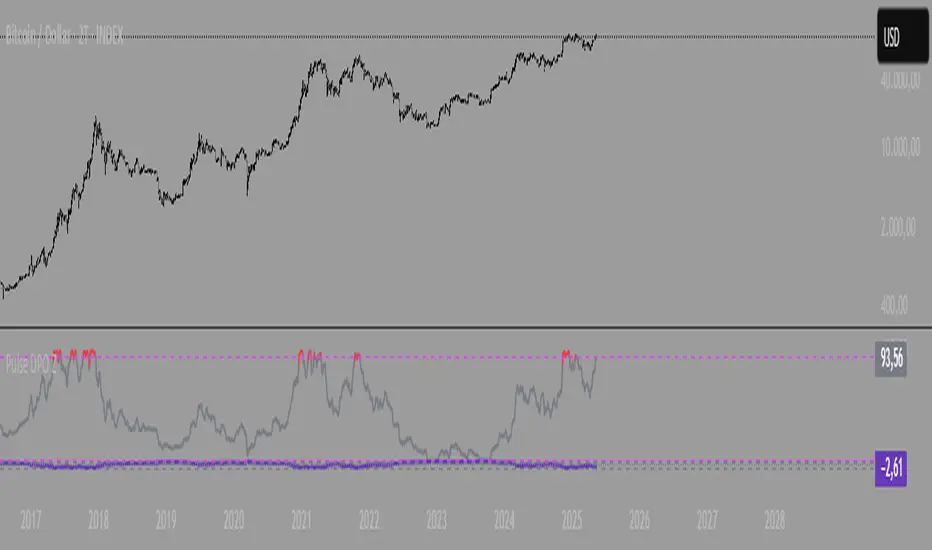
Pulse DPO with Z-Score📌 Pulse DPO with Z-Score — Indicator Description (English)
The Pulse DPO (Detrended Price Oscillator) helps identify major market cycle tops and bottoms by removing long-term trends and focusing on shorter-term price cycles.
This enhanced version includes:
A normalized oscillator (0–100) based on recent price deviations.
A smoothed signal to reduce noise.
A Z-Score transformation, scaling the output to a range from –3 to +3, where:
–3 represents extreme oversold conditions (former normalized value = 100),
+3 represents extreme overbought conditions (former normalized value = 1).
🔍 How it works:
The indicator subtracts a delayed moving average from price to isolate short-term cycles (DPO logic).
It then normalizes the oscillator within a lookback window.
Finally, it converts this to a Z-Score scale for easier interpretation of extremes.
🟢 Suggested Usage:
Consider Long entries or Short exits when Z-Score reaches –2 to –3 (deep oversold).
Consider Short entries or Long exits when Z-Score reaches +2 to +3 (deep overbought).
Use in combination with other signals for higher-confidence setups.
WaveFunction MACD (TechnoBlooms)WaveFunction MACD — The Next Generation of Market Momentum
WaveFunction MACD is an advanced hybrid momentum indicator that merges:
• The classical MACD crossover logic (based on moving averages)
• Wave physics (modeled through phase energy and cosine functions)
• Hilbert Transform theory from signal processing
• The concept of a wavefunction from quantum mechanics, where price action is seen as a probabilistic energy wave—not just a trend.
✨ Key Features of WaveFunction MACD
• Wave Energy Logic : Instead of using just price and MA differences, this indicator computes phase-corrected momentum using the cosine of the wave phase angle — revealing the true energy behind market moves.
• Phase-Based Trend Detection : It reads cycle phases using Hilbert Transform-like logic, allowing you to spot momentum before it becomes visible in price.
• Ultra-Smooth Flow : The main line and histogram are built to follow price flow smoothly — eliminating much of the noise found in traditional MACD indicators.
• Signal Amplification via Energy Histogram : The histogram doesn’t just show momentum changes — it shows the intensity of wave energy, allowing you to confirm the strength of the trend.
• Physics-Driven Structure : The algorithm is rooted in real-world wave mechanics, bringing a scientific edge to trading — ideal for traders who believe in natural models like cycles and harmonics.
• Trend Confirmation & Early Reversals : It can confirm strong trends and also catch subtle shifts that often precede big reversals — giving you both reliability and anticipation.
• Ready for Fusion : Designed to work seamlessly with liquidity zones, price action, order blocks, and structure trading — a perfect fit for modern trading systems.
🧪 The Science Behind It
This tool blends:
• Hilbert Transform: Measures the phase of a waveform (price cycle) to detect turning points
• Cosine Phase Energy: Calculates true wave energy using the cosine of the phase angle, revealing the strength behind price movements
• Quantum Modeling: Views price like a wavefunction, offering predictive insight based on phase dynamics

Hurst Exponent Oscillator [PhenLabs]📊 Hurst Exponent Oscillator -
Version: PineScript™ v5
📌 Description
The Hurst Exponent Oscillator (HEO) by PhenLabs is a powerful tool developed for traders who want to distinguish between trending, mean-reverting, and random market behaviors with clarity and precision. By estimating the Hurst Exponent—a statistical measure of long-term memory in financial time series—this indicator helps users make sense of underlying market dynamics that are often not visible through traditional moving averages or oscillators.
Traders can quickly know if the market is likely to continue its current direction (trending), revert to the mean, or behave randomly, allowing for more strategic timing of entries and exits. With customizable smoothing and clear visual cues, the HEO enhances decision-making in a wide range of trading environments.
🚀 Points of Innovation
Integrates advanced Hurst Exponent calculation via Rescaled Range (R/S) analysis, providing unique market character insights.
Offers real-time visual cues for trending, mean-reverting, or random price action zones.
User-controllable EMA smoothing reduces noise for clearer interpretation.
Dynamic coloring and fill for immediate visual categorization of market regime.
Configurable visual thresholds for critical Hurst levels (e.g., 0.4, 0.5, 0.6).
Fully customizable appearance settings to fit different charting preferences.
🔧 Core Components
Log Returns Calculation: Computes log returns of the selected price source to feed into the Hurst calculation, ensuring robust and scale-independent analysis.
Rescaled Range (R/S) Analysis: Assesses the dispersion and cumulative deviation over a rolling window, forming the core statistical basis for the Hurst exponent estimate.
Smoothing Engine: Applies Exponential Moving Average (EMA) smoothing to the raw Hurst value for enhanced clarity.
Dynamic Rolling Windows: Utilizes arrays to maintain efficient, real-time calculations over user-defined lengths.
Adaptive Color Logic: Assigns different highlight and fill colors based on the current Hurst value zone.
🔥 Key Features
Visually differentiates between trending, mean-reverting, and random market modes.
User-adjustable lookback and smoothing periods for tailored sensitivity.
Distinct fill and line styles for each regime to avoid ambiguity.
On-chart reference lines for strong trending and mean-reverting thresholds.
Works with any price series (close, open, HL2, etc.) for versatile application.
🎨 Visualization
Hurst Exponent Curve: Primary plotted line (smoothed if EMA is used) reflects the ongoing estimate of the Hurst exponent.
Colored Zone Filling: The area between the Hurst line and the 0.5 reference line is filled, with color and opacity dynamically indicating the current market regime.
Reference Lines: Dash/dot lines mark standard Hurst thresholds (0.4, 0.5, 0.6) to contextualize the current regime.
All visual elements can be customized for thickness, color intensity, and opacity for user preference.
📖 Usage Guidelines
Data Settings
Hurst Calculation Length
Default: 100
Range: 10-300
Description: Number of bars used in Hurst calculation; higher values mean longer-term analysis, lower values for quicker reaction.
Data Source
Default: close
Description: Select which data series to analyze (e.g., Close, Open, HL2).
Smoothing Length (EMA)
Default: 5
Range: 1-50
Description: Length for smoothing the Hurst value; higher settings yield smoother but less responsive results.
Style Settings
Trending Color (Hurst > 0.5)
Default: Blue tone
Description: Color used when trending regime is detected.
Mean-Reverting Color (Hurst < 0.5)
Default: Orange tone
Description: Color used when mean-reverting regime is detected.
Neutral/Random Color
Default: Soft blue
Description: Color when market behavior is indeterminate or shifting.
Fill Opacity
Default: 70-80
Range: 0-100
Description: Transparency of area fills—higher opacity for stronger visual effect.
Line Width
Default: 2
Range: 1-5
Description: Thickness of the main indicator curve.
✅ Best Use Cases
Identifying if a market is regime-shifting from trending to mean-reverting (or vice versa).
Filtering signals in automated or systematic trading strategies.
Spotting periods of randomness where trading signals should be deprioritized.
Enhancing mean-reversion or trend-following models with regime-awareness.
⚠️ Limitations
Not predictive: Reflects current and recent market state, not future direction.
Sensitive to input parameters—overfitting may occur if settings are changed too frequently.
Smoothing can introduce lag in regime recognition.
May not work optimally in markets with structural breaks or extreme volatility.
💡 What Makes This Unique
Employs advanced statistical market analysis (Hurst exponent) rarely found in standard toolkits.
Offers immediate regime visualization through smart dynamic coloring and zone fills.
🔬 How It Works
Rolling Log Return Calculation:
Each new price creates a log return, forming the basis for robust, non-linear analysis. This ensures all price differences are treated proportionally.
Rescaled Range Analysis:
A rolling window maintains cumulative deviations and computes the statistical “range” (max-min of deviations). This is compared against the standard deviation to estimate “memory”.
Exponent Calculation & Smoothing:
The raw Hurst value is translated from the log of the rescaled range ratio, and then optionally smoothed via EMA to dampen noise and false signals.
Regime Detection Logic:
The smoothed value is checked against 0.5. Values above = trending; below = mean-reverting; near 0.5 = random. These control plot/fill color and zone display.
💡 Note:
Use longer calculation lengths for major market character study, and shorter ones for tactical, short-term adaptation. Smoothing balances noise vs. lag—find a best fit for your trading style. Always combine regime awareness with broader technical/fundamental context for best results.

The Ultimate Buy and Sell Indicator: Unholy Grail Edition"You see, Watson, the market is not random—it simply whispers in a code too complex for the average trader. Lucky for you, I am not average."
They searched for the Holy Grail of trading for decades—promises, false prophets, and overpriced PDFs.
But they were all looking in the wrong place.
This isn’t a relic buried in the desert.
This is the Unholy Grail — a machine-forged fusion of logic, engineering, and tactical overkill .
Built by Sherlock Macgyver , this is not a mystical object. It’s a surveillance system for trend detection, signal validation, and precision entries .
⚠️ Important: This script draws its own candles.
To see it properly, disable regular candles by turning off "Body", "Wick" and "Border" colors.
🔧 What You’re Looking At
This overlay plots confirmed Buy/Sell signals , momentum-based “watch” zones , adaptive candle coloring , SuperTrend bias detection , dual Bollinger Bands , and a moving average ribbon .
It’s not “minimalist” —it’s comprehensive .
📍 Configuring the Tool: Follow the Breadcrumbs
Every setting includes a tooltip — read them . They're not filler. They explain exactly how each feature functions so you can dial this thing in like you're tuning a surveillance rig in a Cold War bunker .
If you skip them, you're walking blind in a minefield .
🕰️ Timeframes: The Signal Sweet Spot
Each asset has a tempo . You need to find the one where signals align with clarity —not chaos .
Start with 4H or 1H —work up or down from there.
Too many fakeouts? → Higher timeframe
Too slow? → Drop to 15m or 5m —but expect more noise and adjust settings accordingly.
The signals scale with time, but you must find the rhythm that best fits your asset—and your trading lifestyle .
♻️ RSI Cycle = Signal Sensitivity
This is the heart of the system . It controls how reactive the RSI engine is.
Adjust based on noise level and how often you can actually monitor your charts.
Short cycle (14–24): More signals, more speed, more noise
Longer cycle (36–64): Smoother entries, better for swing traders
Tip: If your signals feel too jittery, increase the cycle. If they lag too much, reduce it.
📉 SuperTrend: Your Trend Bias Compass
This isn’t your average SuperTrend. It adapts with RSI overlay logic and detects market “silence” via EMA compression— turning white right before the chaos . That said, you still control its aggression.
ATR Length = how many bars to average
ATR Factor = how tight or loose it hugs price
Lower = more sensitive (more trades, more noise)
Higher = confirmation only (fewer, but stronger signals)
Tweak until it feels like a sniper rifle.
No, you won’t get it perfect on the first try.
Yes, it’s worth it.
🛠️ Modular Signals: Why Things Fire (or Don’t)
Buy/Sell entries require conditions to align. The logic is modular, and that’s on purpose.
RSI signals only fire if RSI crosses its smoothed MA outside the dead zone and a “Watch” condition is active.
SuperTrend signals can be enabled to act on crossovers, optionally ignoring the Watch filter .
Watch conditions (colored squares) act as early recon and hint at possible upcoming trades.
Background color changes are “pre-signal warnings” and will repaint . Use them as leading signals, not gospel.
Want more trades? Loosen your filters .
Want sniper entries? Lock them down .
🌈 Candles and MAs: Visual Market Structure
Candles adapt in real-time to MA structure:
Green = bullish (above both fast/slow MAs)
Yellow = indecision (between)
Red = bearish (below both)
Buy/Sell signals override candles with bright orange and fuchsia —because subtlety doesn’t win wars .
You can also enable up to 8 customizable moving averages —great for confluence , trend confirmation , or just looking like a wizard .
🧠 Pro Usage Tips (TL;DR for Smart People):
Use tooltips in the settings menu —every toggle and slider is explained
Test timeframes until signal frequency and reliability match your goals
Adjust RSI cycle to reduce noise or speed up signals based on how frequently you trade
Tweak SuperTrend factor and ATR to fit volatility on your asset
Start with visual confirmation :
• Are watch signals lining up with trend zones?
• Are backgrounds firing before price moves?
• Are candle colors agreeing with signal direction?
📣 Alerts & Integration
Alerts are available for:
Buy/Sell entries (confirmed or advanced background)
Watch signals
Full band agreement (both Bollinger bands bullish or bearish)
Use these with webhook systems , bots , or your own trade journals .
Created by Sherlock Macgyver
Because sometimes the best trade…
is knowing exactly when not to take one.

Parabolic RSI Strategy [ChartPrime × PineIndicators]This strategy combines the strengths of the Relative Strength Index (RSI) with a Parabolic SAR logic applied directly to RSI values.
Full credit to ChartPrime for the original concept and indicator, licensed under the MPL 2.0.
It provides clear momentum-based trade signals using an innovative method that tracks RSI trend reversals via a customized Parabolic SAR, enhancing traditional oscillator strategies with dynamic trend confirmation.
How It Works
The system overlays a Parabolic SAR on the RSI, detecting trend shifts in RSI itself rather than on price, offering early reversal insight with visual and algorithmic clarity.
Core Components
1. RSI-Based Trend Detection
Calculates RSI using a customizable length (default: 14).
Uses upper and lower thresholds (default: 70/30) for overbought/oversold zones.
2. Parabolic SAR Applied to RSI
A custom Parabolic SAR function tracks momentum within the RSI, not price.
This allows the system to capture RSI trend reversals more responsively.
Configurable SAR parameters: Start, Increment, and Maximum acceleration.
3. Signal Generation
Long Entry: Triggered when the SAR flips below the RSI line.
Short Entry: Triggered when the SAR flips above the RSI line.
Optional RSI filter ensures that:
Long entries only occur above a minimum RSI (e.g. 50).
Short entries only occur below a maximum RSI.
Built-in logic prevents new positions from being opened against trend without prior exit.
Trade Modes & Controls
Choose from:
Long Only
Short Only
Long & Short
Optional setting to reverse positions on opposite signal (instead of waiting for a flat close).
Visual Features
1. RSI Plotting with Thresholds
RSI is displayed in a dedicated pane with overbought/oversold fill zones.
Custom horizontal lines mark threshold boundaries.
2. Parabolic SAR Overlay on RSI
SAR dots color-coded for trend direction.
Visible only when enabled by user input.
3. Entry & Exit Markers
Diamonds: Mark entry points (above for shorts, below for longs).
Crosses: Mark exit points.
Strategy Strengths
Provides early momentum reversal entries without relying on price candles.
Combines oscillator and trend logic without repainting.
Works well in both trending and mean-reverting markets.
Easy to configure with fine-tuned filter options.
Recommended Use Cases
Intraday or swing traders who want to catch RSI-based reversals early.
Traders seeking smoother signals than price-based Parabolic SAR entries.
Users of RSI looking to reduce false positives via trend tracking.
Customization Options
RSI Length and Thresholds.
SAR Start, Increment, and Maximum values.
Trade Direction Mode (Long, Short, Both).
Optional RSI filter and reverse-on-signal settings.
SAR dot color customization.
Conclusion
The Parabolic RSI Strategy is an innovative, non-repainting momentum strategy that enhances RSI-based systems with trend-confirming logic using Parabolic SAR. By applying SAR logic to RSI values, this strategy offers early, visualized, and filtered entries and exits that adapt to market dynamics.
Credit to ChartPrime for the original methodology, published under MPL-2.0.

RSI Divergence Candlestick SwiftEdge// RSI Divergence Candlestick SwiftEdge
//
// Overview:
// RSI Divergence Candlestick SwiftEdge is a unique oscillator that transforms the traditional Relative Strength Index (RSI) into a candlestick format, combined with advanced divergence detection. This indicator is designed to help traders identify momentum shifts and potential reversals by visualizing RSI as candlesticks and highlighting both regular and hidden divergences between price and RSI. Unlike standard RSI indicators, this tool provides a more intuitive, price-like representation of RSI movements, making it easier to spot trends and reversals in momentum.
//
// Why This Combination?
// The combination of RSI candlesticks and divergence detection serves a dual purpose:
// 1. RSI Candlesticks: By presenting RSI as candlesticks, traders can apply familiar price action techniques (such as identifying trends, reversals, or consolidation patterns) directly to RSI. This format makes it easier to see momentum shifts in a way that resembles price movements.
// 2. Divergence Detection: Regular and hidden divergences between price and RSI often signal potential reversals or trend continuations. This indicator automatically identifies these divergences and draws lines to connect the pivot points, helping traders spot high-probability setups without manual analysis.
//
// How It Works:
// - RSI Candlesticks: The indicator calculates the RSI using a user-defined length (default 14). Each candlestick is constructed as follows:
// * Open: The RSI value from the previous bar.
// * Close: The current RSI value.
// * High/Low: Estimated by looking at the highest and lowest RSI values over a short lookback period (default 3 bars), simulating wicks to mimic price candlestick behavior.
// The candlesticks are colored green for upward momentum (close > open) and red for downward momentum (close < open), with gray wicks for clarity.
// - Divergence Detection: The indicator identifies pivot highs and lows in both price and RSI using a pivot lookback period (default 5 bars). It then checks for four types of divergences:
// * Regular Bullish Divergence: Price makes a lower low, but RSI makes a higher low, indicating potential reversal to the upside.
// * Regular Bearish Divergence: Price makes a higher high, but RSI makes a lower high, indicating potential reversal to the downside.
// * Hidden Bullish Divergence: Price makes a higher low, but RSI makes a lower low, suggesting trend continuation to the upside.
// * Hidden Bearish Divergence: Price makes a lower high, but RSI makes a higher high, suggesting trend continuation to the downside.
// Divergence lines are drawn between the RSI pivot points in the oscillator window and optionally on the price chart. Regular divergences use solid lines, while hidden divergences use dashed lines, with green for bullish and red for bearish signals.
// - Overbought/Oversold Restriction: By default, divergences are restricted to overbought (RSI > 70) or oversold (RSI < 30) zones to filter out less reliable signals. This can be disabled in the settings.
//
// How to Use:
// 1. Add the indicator to your chart to see RSI displayed as candlesticks in the oscillator window.
// 2. Look for RSI candlestick patterns:
// * Green candlesticks indicate increasing momentum; red candlesticks indicate decreasing momentum.
// * Use the wicks to identify overextensions in momentum, similar to price candlesticks.
// 3. Identify divergences:
// * Regular bullish/bearish divergences (solid lines) may signal reversals.
// * Hidden bullish/bearish divergences (dashed lines) may signal trend continuations.
// * Divergence lines are drawn in the RSI window and optionally on the price chart (toggle in settings).
// 4. Adjust settings:
// * RSI Length (default 14): Controls the sensitivity of the RSI calculation.
// * Wick Lookback (default 3): Determines how far back to look for RSI highs/lows to create wicks.
// * Pivot Lookback (default 5): Controls the sensitivity of pivot point detection for divergence.
// * Restrict Divergence (default true): Limits divergences to overbought/oversold zones.
// * Show Divergence on Chart (default true): Toggles whether divergence lines appear on the price chart.
//
// Use Case:
// This indicator is ideal for swing traders and reversal hunters looking to combine momentum analysis with price action techniques. The RSI candlestick format allows traders to apply chart patterns directly to RSI, while the divergence detection highlights high-probability setups. For example, a regular bullish divergence in an oversold zone, combined with a bullish RSI candlestick pattern, can signal a strong buying opportunity.
//
// Limitations:
// - The wicks on RSI candlesticks are an estimation based on recent RSI values, as Pine Script cannot access intra-bar RSI data.
// - Divergence detection relies on pivot points, which may lag slightly due to the lookback period. Adjust the pivot lookback setting to balance sensitivity and reliability.
// - This is an indicator, not a strategy, so it does not provide backtesting results or trade signals. Use it as part of a broader trading system.

RSI/MFI with Volatility Bands with Alerts [BetaBlock]Based on LazyBear - RSI/MFI with Bollinger Bands indicator, but with Oversold and Overbought alerts

Technical Signal Master📘 **Technical Signal Master** - Multi-Indicator Signal Table (50+ indicators)
This script integrates over 50 technical indicators and outputs Buy / Sell / Neutral signals into a dual-column table, helping traders evaluate market conditions at a glance.
---
🔍 **Included Indicators**
- Oscillators: RSI, MACD, Stochastic, Momentum, ADX, CCI, Williams %R, Awesome Oscillator
- Trend Tools: EMA (20/50/75/100/200), Supertrend, PSAR, HMA, KAMA, DMI
- Volume-Based: OBV, MFI, CMF, Chaikin Oscillator, VFI, Force Index, Acc/Dist
- Composite: TDI, Aroon, KST, Coppock, TSI, DPO, ROC, PPO
---
🧠 **What This Script Does**
- Each indicator outputs a numeric value and a signal (Buy = green, Sell = red, Neutral = gray)
- A total score is calculated to summarize the market sentiment (Bullish / Bearish / Neutral)
- All signals are shown in a fixed table at the top-right (overlay = false)
---
🎯 **Use Case**
This tool is designed for:
- Discretionary traders to make informed decisions
- Streamers or instructors to visually show signal summaries
- Anyone needing a unified signal dashboard
---
📝 **日本語説明(for JP users)**
このスクリプトは、50種類以上のテクニカル指標を統合し、それぞれの買い/売り/中立の判定をテーブル形式で表示します。チャート上には描画せず、右上に固定テーブルを表示するのみです。裁量判断や配信補助ツールとして活用できます。
---
✅ No repaint / No overlay plots / Fully open source

50-Line OscillatorFractal Vortex Oscillator
Version 5 | Overlay: Off
Overview
The Fractal Vortex Oscillator blends multiple moving-average trends into a single, rainbow-colored “vortex” that highlights shifting market momentum and internal crossovers. By stacking 26 sequential moving averages (SMA, EMA, WMA) with gradually increasing lengths, it creates a rich, multicolored band whose twists and overlaps reveal trend strength and turning points.
Key Features
Dynamic Trend Lines (26):
Uses a mix of SMA, EMA, and WMA on your chosen source (default = close).
Base length starts at 14 and increases by 1 for each subsequent line.
Rainbow Coloring:
Seven semi-transparent hues (red → orange → yellow → green → blue → fuchsia → navy) cycle through the lines for easy visual separation.
Filled Bands:
Adjacent trend lines are softly filled with aqua-tinted shading to emphasize the vortex bands.
Crossover Counting:
Internally tallies the number of times faster lines cross over or under their immediate slower neighbors on each bar.
Displays a small gray label on price showing “Up: X / Down: Y” to quantify rising vs. falling momentum.
Inputs
Base Length (base_length, default 14) – Starting period for the first moving average; all others increment from here.
Source (source, default close) – Price series to feed into the moving averages.
How It Works
Trend Array Creation
An array of 26 floats is built, each element computed by choosing SMA, EMA, or WMA in rotation and applying it to source with periods base_length + index.
Color Assignment
A seven-color palette is cycled through, giving every third line the same hue for a smooth rainbow gradient.
Plotting & Filling
Each of the 26 lines is plotted in its assigned color.
Consecutive lines are filled with a semi-transparent aqua to accentuate the “vortex” effect.
Momentum Signals
On each bar, the script checks for crossovers between each pair of adjacent lines:
CrossUp increments when a faster line crosses above a slower one.
CrossDown increments when it crosses below.
A label at the current bar displays the total counts, giving a quick read on whether upward or downward momentum dominates.
Interpretation & Usage
Wide, uniform bands suggest a steady trend; tight, overlapping bands point to consolidation or indecision.
Rising “Up” count signals growing bullish momentum; rising “Down” count signals bearish pressure.
Use the vortex’s twists—where different-colored lines intersect—as early warnings of potential trend shifts.

Multi-Indicator Swing [TIAMATCRYPTO]v6# Strategy Description:
## Multi-Indicator Swing
This strategy is designed for swing trading across various markets by combining multiple technical indicators to identify high-probability trading opportunities. The system focuses on trend strength confirmation and volume analysis to generate precise entry and exit signals.
### Core Components:
- **Supertrend Indicator**: Acts as the primary trend direction filter with optimized settings (Factor: 3.0, ATR Period: 10) to balance responsiveness and reliability.
- **ADX (Average Directional Index)**: Confirms the strength of the prevailing trend, filtering out sideways or choppy market conditions where the strategy avoids taking positions.
- **Liquidity Delta**: A volume-based indicator that analyzes buying and selling pressure imbalances to validate trend direction and potential reversals.
- **PSAR (Optional)**: Can be enabled to add additional confirmation for trend changes, turned off by default to reduce signal filtering.
### Key Features:
- **Flexible Direction Trading**: Choose between long-only, short-only, or bidirectional trading to adapt to market conditions or account restrictions.
- **Conservative Risk Management**: Implements fixed percentage-based stop losses (default 2%) and take profits (default 4%) for a positive risk-reward ratio.
- **Realistic Backtesting Parameters**: Includes commission (0.1%) and slippage (2 points) to reflect real-world trading conditions.
- **Visual Signals**: Clear buy/sell arrows with customizable sizes for easy identification on the chart.
- **Information Panel**: Dynamic display showing active indicators and current risk settings.
### Best Used On:
Daily timeframes for cryptocurrencies, forex, or stock indices. The strategy performs optimally on assets with clear trending behavior and sufficient volatility.
### Default Settings:
Optimized for conservative position sizing (5% of equity per trade) with an initial capital of $10,000. The backtesting period (2021-2023) provides a statistically significant sample of varied market conditions.

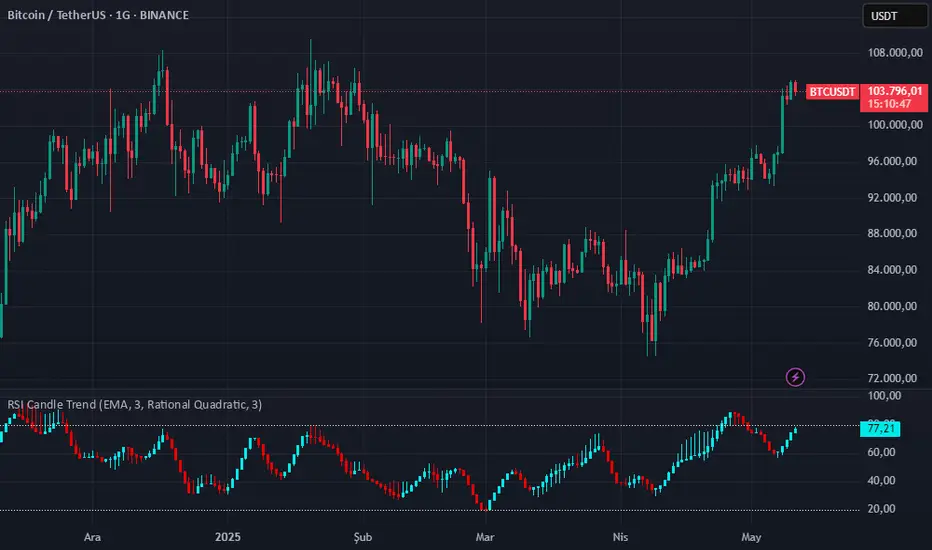
RSI Candle Trend🎯 Purpose:
This TradingView script is designed to visualize trend strength using RSI values as candle data, instead of traditional price candles. It transforms RSI data into custom candles using various smoothing and filtering methods (like Heikin-Ashi, Linear Regression, Rational Quadratic Filter, or McGinley Dynamic). It allows traders to:
📌Track RSI-based momentum using visual candle representation
📌Apply advanced smoothing/filters to the RSI to reduce noise
📌Highlight candle trend strength using dynamic coloring
📌Identify overbought/oversold zones using reference lines (RSI 80 and 20)
🧩 How It Works:
It calculates RSI values for open, high, low, close prices.
These RSI values are then optionally smoothed with user-selected moving averages (EMA, SMA, etc.).
Depending on the selected mode (Normal, Heikin-Ashi, Linear, Rational Quadratic), the RSI values are transformed into synthetic candles.
Candles are colored cyan (uptrend) or red (downtrend) based on RSI movement.
⚙️ Key Inputs:
Method: Type of moving average to smooth the RSI (e.g. EMA, SMA, VWMA, etc.)
Length: Length for RSI and smoothing filters
Candle: Type of candle transformation (Normal, Heikin-Ashi, Linear, Rational Quadratic)
Rational Quadratic: Parameter for the Rational Quadratic smoothing method
📊 Outputs:
Custom candles plotted using RSI-transformed values
Candle colors based on RSI strength:
Cyan for strong bullish RSI movement
Red for strong bearish RSI movement
Horizontal lines at RSI levels 80 and 20 (overbought/oversold)
🧠 Why Use This Indicator?
Unlike traditional RSI indicators that show a line, this tool:
Converts RSI into candle-style visualization
Helps traders visually interpret trend strength, reversals, or continuation patterns
Offers more refined control over RSI behavior and filtering
Provides a unique blend of momentum and candle analysis
❗Important Note:
This script is provided for educational purposes and does not constitute financial advice. Traders and investors should conduct their research and analysis before making any trading decisions.
AP IFTCCIv2/IFTStoch/IFTRSI Multi-TimeframeMulti-Timeframe IFT-CCI/Stoch/RSI Composite
This enhanced indicator combines three powerful oscillators—Inverse Fisher Transform (IFT) versions of the Commodity Channel Index (CCI), Stochastic, and Relative Strength Index (RSI)—into a unified multi-timeframe analysis tool. Originally developed by John Ehlers (pioneer of cyclical analysis and signal processing in trading systems) and adapted by KIVANC (@fr3762), this version adds dual-timeframe capability to compare indicator values across different chart resolutions.
Key Features:
Triple Oscillator Composite
IFT-CCI: Smoothed CCI values transformed via Ehlers' Inverse Fisher Transform (blue-gold)
IFT-Stochastic: Classic stochastic oscillator processed through IFT (blue)
IFT-RSI: RSI oscillator converted to IFT format (magenta)
Composite Average Line: Combined average of all three indicators (green)
Multi-Timeframe Analysis
Compare primary and secondary timeframes (e.g., 1H vs. 4H, daily vs. weekly)
Primary timeframe plots use solid lines with 80% opacity
Secondary timeframe (optional) uses dashed/circle markers with 40% opacity
Key Levels
Overbought (+0.75) and oversold (-0.75) reference lines
Zero-centerline for momentum direction bias
Applications:
Trend Confirmation: Align higher timeframe signals with lower timeframe entries
Divergence Detection: Spot inter-timeframe discrepancies in momentum
Regime Filter: Use higher timeframe composite values to filter trades
Technical Basis:
Inverse Fisher Transform: Compresses oscillator values into bounded (-1 to +1) range while emphasizing extreme moves
Dual WMA Smoothing: Combines initial calculation smoothing (WMA1) with final output smoothing (WMA2)
Exponential Scaling: (e^2x - 1)/(e^2x + 1) formula converts Gaussian-like distributions to bounded outputs
Credits:
Original Concept: John Ehlers (IFT methodology, cyclical analysis foundations)
Initial Implementation: KIVANC (@fr3762 on Twitter) for the base IFT-CCI/Stoch/RSI script
Multi-Timeframe Adaptation: for cross-resolution analysis capabilities
This tool is particularly effective for traders seeking to align multiple timeframes while using Ehlers' noise-reduction techniques. The composite average line provides a consensus view, while the individual oscillators help identify component strength/weakness.

Market Sentiment Index US Top 40 [Pt]▮Overview
Market Sentiment Index US Top 40 [Pt} shows how the largest US stocks behave together. You pick one simple measure—High Low breakouts, Above Below moving average, or RSI overbought/oversold—and see how many of your chosen top 10/20/30/40 NYSE or NASDAQ names are bullish, neutral, or bearish.
This tool gives you a quick view of broad-market strength or weakness so you can time trades, confirm trends, and spot hidden shifts in market sentiment.
▮Key Features
► Three Simple Modes
High Low Index: counts stocks making new highs or lows over your lookback period
Above Below MA: flags stocks trading above or below their moving average
RSI Sentiment: marks overbought or oversold stocks and plots a small histogram
► Universe Selection
Top 10, 20, 30, or 40 symbols from NYSE or NASDAQ
Option to weight by market cap or treat all symbols equally
► Timeframe Choice
Use your chart’s timeframe or any intraday, daily, weekly, or monthly resolution
► Histogram Smoothing
Two optional moving averages on the sentiment bars
Markers show when the faster average crosses above or below the slower one
► Ticker Table
Optional on-chart table showing each ticker’s state in color
Grid or single-row layout with adjustable text size and color settings
▮Inputs
► Mode and Lookback
Pick High Low, Above Below MA, or RSI Sentiment
Set lookback length (for example 10 bars)
If using Above Below MA, choose the moving average type (EMA, SMA, etc.)
► Universe Setup
Market: NYSE or NASDAQ
Number of symbols: 10, 20, 30, or 40
Weights: on or off
Timeframe: blank to match chart or pick any other
► Moving Averages on Histogram
Enable fast and slow averages
Set their lengths and types
Choose colors for averages and markers
► Table Options
Show or hide the symbol table
Select text size: tiny, small, or normal
Choose layout: grid or one-row
Pick colors for bullish, neutral, and bearish cells
Show or hide exchange prefixes
▮How to Read It
► Sentiment Bars
Green means bullish
Red means bearish
Near zero means neutral
► Zero Line
Separates bullish from bearish readings
► High Low Line (High Low mode only)
Smooth ratio of highs versus lows over your lookback
► MA Crosses
Fast MA above slow MA hints rising breadth
Fast MA below slow MA hints falling breadth
► Ticker Table
Each cell colored green, gray, or red for bull, neutral, or bear
▮Use Cases
► Confirm Market Trends
Early warning when price makes highs but breadth is weak
Catch rallies when breadth turns strong while price is flat
► Spot Sector Rotation
Switch between NYSE and NASDAQ to see which group leads
Watch tech versus industrial breadth to track money flow
► Filter Trade Signals
Enter longs only when breadth is bullish
Consider shorts when breadth turns negative
► Combine with Other Indicators
Use RSI Sentiment with trend tools to spot overextended moves
Add volume indicators in High Low mode for breakout confirmation
► Timeframe Analysis
Daily for big-picture bias
Intraday (15-min) for precise entries and exits

Supertrend + Stochastic RSIThe Supertrend + Stochastic RSI indicator is designed for scalping and short-term trading, combining the trend-following power of the Supertrend with the momentum insights of the Stochastic RSI to generate reliable buy and sell signals. This indicator aims to reduce false signals by requiring confirmation from both trend direction and momentum, making it suitable for traders targeting quick, high-probability trades in fast-moving markets on lower timeframes (e.g., 1-minute to 15-minute charts).
How It Works
The indicator integrates two technical components to produce actionable signals:
Supertrend for Trend Direction:
The Supertrend, calculated with a default length of 10 and a factor of 3.0, identifies the prevailing trend. It plots a line above or below the price, turning green when the trend is bullish (price above Supertrend) and red when bearish (price below Supertrend). This helps traders stay aligned with the market’s direction, reducing trades against the trend.
Stochastic RSI for Momentum Confirmation:
The Stochastic RSI, computed over a 14-period RSI with 3-period smoothing for %K and %D lines, measures momentum. A buy signal is generated when the %K line crosses above the oversold level (default: 20), indicating potential upward momentum, while a sell signal occurs when %K crosses below the overbought level (default: 80), suggesting downward momentum.
Signal Generation
Signals are produced only when both conditions align, using the previous bar’s values to prevent repainting:
Buy Signal: The Stochastic RSI %K crosses above the oversold level, and the Supertrend confirms a bullish trend (price above Supertrend). Displayed as a green upward triangle below the bar.
Sell Signal: The Stochastic RSI %K crosses below the overbought level, and the Supertrend confirms a bearish trend (price below Supertrend). Displayed as a red downward triangle above the bar.

Adaptive Volume-Weighted RSI (AVW-RSI)Concept Summary
The AVW-RSI is a modified version of the Relative Strength Index (RSI), where each price change is weighted by the relative trading volume for that period. This means periods of high volume (typically driven by institutions or “big money”) have a greater influence on the RSI calculation than periods of low volume.
Why AVW-RSI Helps Traders
Avoids Weak Signals During Low Volume
Standard RSI may show overbought/oversold zones even during low-volume periods (e.g., during lunch hours or after news).
AVW-RSI gives less weight to these periods, avoiding misleading signals.
Amplifies Strong Momentum Moves
If RSI is rising during high volume, it's more likely driven by institutional buying—AVW-RSI reflects that stronger by weighting the RSI component.
Filters Out Retail Noise
By prioritizing high-volume candles, it naturally discounts fakeouts caused by thin markets or retail-heavy moves.
Highlights Institutional Entry/Exit
Useful for spotting hidden accumulation/distribution that classic RSI would miss.
How It Works (Calculation Logic)
Traditional RSI Formula Recap
RSI = 100 - (100 / (1 + RS))
RS = Average Gain / Average Loss (over N periods)
Modified Step – Apply Volume Weight
For each period
Gain_t = max(Close_t - Close_{t-1}, 0)
Loss_t = max(Close_{t-1} - Close_t, 0)
Weight_t = Volume_t / AvgVolume(N)
WeightedGain_t = Gain_t * Weight_t
WeightedLoss_t = Loss_t * Weight_t
Weighted RSI
AvgWeightedGain = SMA(WeightedGain, N)
AvgWeightedLoss = SMA(WeightedLoss, N)
RS = AvgWeightedGain / AvgWeightedLoss
AVW-RSI = 100 - (100 / (1 + RS))
Visual Features on Chart
Line Color Gradient
Color gets darker as volume weight increases, signaling stronger conviction.
Overbought/Oversold Zones
Traditional: 70/30
Suggested AVW-RSI zones: Use dynamic thresholds based on historical volatility (e.g., 80/20 for high-volume coins).
Volume Spike Flags
Mark RSI turning points that occurred during volume spikes with a special dot/symbol.
Trading Strategies with AVW-RSI
1. Weighted RSI Divergence
Regular RSI divergence becomes more powerful when volume is high.
AVW-RSI divergence with volume spike is a strong signal of reversal.
2. Trend Confirmation
RSI crossing above 50 during rising volume is a good entry signal.
RSI crossing below 50 with high volume is a strong exit or short trigger.
3. Breakout Validation
Price breaking resistance + AVW-RSI > 60 with volume = Confirmed breakout.
Price breaking but AVW-RSI < 50 or on low volume = Potential fakeout.
Example Use Case
Stock XYZ is approaching a resistance zone. A trader sees:
Standard RSI: 65 → suggests strength.
Volume is 3x the average.
AVW-RSI: 78 → signals strong momentum with institutional backing.
The trader enters confidently, knowing this isn't just low-volume hype.
Limitations / Tips
Works best on liquid assets (Forex majors, large-cap stocks, BTC/ETH).
Should be used alongside price action and volume analysis—not standalone.
Periods of extremely high volume (news events) might need smoothing to avoid spikes.

Parsifal.Swing.TrendScoreThe Parsifal.Swing.TrendScore indicator is a module within the Parsifal Swing Suite, which includes a set of swing indicators such as:
• Parsifal Swing TrendScore
• Parsifal Swing Composite
• Parsifal Swing RSI
• Parsifal Swing Flow
Each module serves as an indicator facilitating judgment of the current swing state in the underlying market.
________________________________________
Background
Market movements typically follow a time-varying trend channel within which prices oscillate. These oscillations—or swings—within the trend are inherently tradable.
They can be approached:
• One-sidedly, aligning with the trend (generally safer), or
• Two-sidedly, aiming to profit from mean reversions as well.
Note: Mean reversions in strong trends often manifest as sideways consolidations, making one-sided trades more stable.
________________________________________
The Parsifal Swing Suite
The modules aim to provide additional insights into the swing state within a trend and offer various trigger points to assist with entry decisions.
All modules in the suite act as weak oscillators, meaning they fluctuate within a range but are not bounded like true oscillators (e.g., RSI, which is constrained between 0% and 100%).
________________________________________
The Parsifal.Swing.TrendScore – Specifics
The Parsifal.Swing.TrendScore module combines short-term trend data with information about the current swing state, derived from raw price data and classical technical indicators. It provides an indication of how well the short-term trend aligns with the prevailing swing, based on recent market behavior.
________________________________________
How Swing.TrendScore Works
The Swing.TrendScore calculates a swing score by collecting data within a bin (i.e., a single candle or time bucket) that signals an upside or downside swing. These signals are then aggregated together with insights from classical swing indicators.
Additionally, it calculates a short-term trend score using core technical signals, including:
• The Z-score of the price's distance from various EMAs
• The slope of EMAs
• Other trend-strength signals from additional technical indicators
These two components—the swing score and the trend score—are then combined to form the Swing.TrendScore indicator, which evaluates the short-term trend in context with swing behavior.
________________________________________
How to Interpret Swing.TrendScore
The trend component enhances Swing.TrendScore’s ability to provide stronger signals when the short-term trend and swing state align.
It can also override the swing score; for example, even if a mean reversion appears to be forming, a dominant short-term trend may still control the market behavior.
This makes Swing.TrendScore particularly valuable for:
• Short-term trend-following strategies
• Medium-term swing trading
Unlike typical swing indicators, Swing.TrendScore is designed to respond more to medium-term swings rather than short-lived fluctuations.
________________________________________
Behavior and Chart Representation
The Swing.TrendScore indicator fluctuates within a range, as most of its components are range-bound (though Z-score components may technically extend beyond).
• Historically high or low values may suggest overbought or oversold conditions
• The chart displays:
o A fast curve (orange)
o A slow curve (white)
o A shaded background representing the market state
• Extreme values followed by curve reversals may signal a developing mean reversion
________________________________________
TrendScore Background Value
The Background Value reflects the combined state of the short-term trend and swing:
• > 0 (shaded green) → Bullish mode: swing and short-term trend both upward
• < 0 (shaded red) → Bearish mode: swing and short-term trend both downward
• The absolute value represents the confidence level in the market mode
Notably, the Background Value can remain positive during short downswings if the short-term trend remains bullish—and vice versa.
________________________________________
How to Use the Parsifal.Swing.TrendScore
Several change points can act as entry triggers or aids:
• Fast Trigger: change in slope of the fast signal curve
• Trigger: fast line crosses slow line or the slope of the slow signal changes
• Slow Trigger: change in sign of the Background Value
Examples of these trigger points are illustrated in the accompanying chart.
Additionally, market highs and lows aligning with the swing indicator values may serve as pivot points in the evolving price process.
________________________________________
As always, this indicator should be used in conjunction with other tools and market context in live trading.
While it provides valuable insight and potential entry points, it does not predict future price action.
Instead, it reflects recent tendencies and should be used judiciously.
________________________________________
Extensions
The aggregation of information—whether derived from bins or technical indicators—is currently performed via simple averaging. However, this can be modified using alternative weighting schemes, based on:
• Historical performance
• Relevance of the data
• Specific market conditions
Smoothing periods used in calculations are also modifiable. In general, the EMAs applied for smoothing can be extended to reflect expectations based on relevance-weighted probability measures.
Since EMAs inherently give more weight to recent data, this allows for adaptive smoothing.
Additionally, EMAs may be further extended to incorporate negative weights, akin to wavelet transform techniques.

Ceres Trader Simple Trend & Momentum SignalsCeres Trader – Simple Trend & Momentum Signals
Description:
Cut through chart noise with a lightweight, two-factor signal system that combines a classic trend filter (200 EMA) with momentum confirmation (smoothed RSI as a QQE proxy). This indicator plots clean entry arrows—no background shading, no clutter—so you can trade only in the high-probability regime:
Trend Filter: 200-period exponential moving average
Momentum Filter: RSI(14) smoothed over N bars, offset by 50 to create a zero-line
Long Entry: Price above the 200 EMA and the smoothed RSI crosses up through zero → green up-arrow below bar
Short Entry: Price below the 200 EMA and the smoothed RSI crosses down through zero → red down-arrow above bar
Key Features:
Minimalist display: only the 200 EMA and entry arrows
Customizable inputs: EMA length, RSI length, RSI smoothing period
Ultra-low CPU load: suitable for lower timeframes (e.g. 1 min gold futures)
Yellow label text: for optimal visibility on dark or light chart backgrounds
How to Use:
Add the script to your TradingView chart.
Choose your timeframe and adjust inputs as needed.
Take only the long signals when price is above the EMA, and only the short signals when price is below.
Place stops just beyond the EMA; targets can be measured swings or fixed R-multiples.
Notes:
Designed as a regime-based entry filter—no exits or background fills included.
Feel free to combine with your own stop-loss, take-profit, and money-management rules.
Trade smarter, not harder—let the market tell you only when both trend and momentum align.

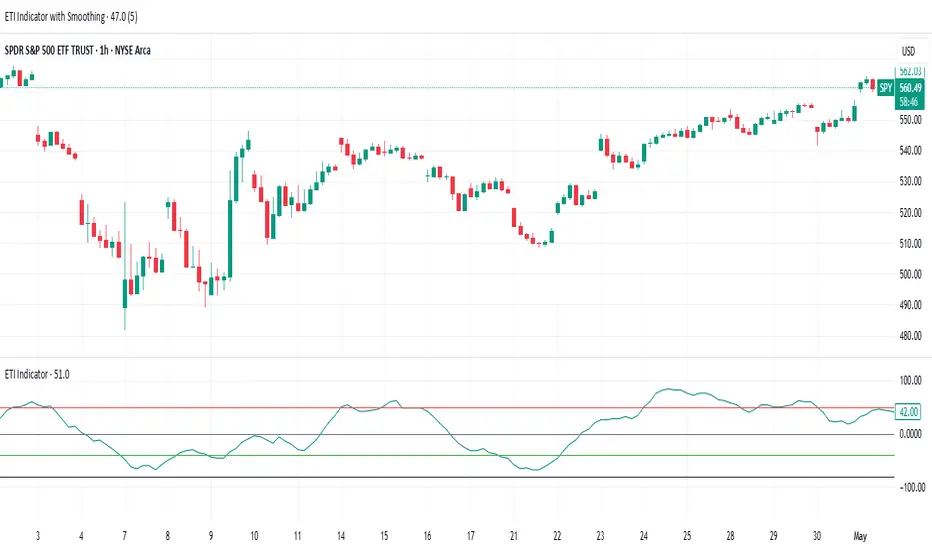
ETI IndicatorThe Ensemble Technical Indicator (ETI) is a script that combines multiple established indicators into one single powerful indicator. Specifically, it takes a number of technical indicators and then converts them into +1 to represent a bullish trend, or a -1 to represent a bearish trend. It then adds these values together and takes the running sum over the past 20 days.
The ETI is composed of the following indicators and converted to +1 or -1 using the following criteria:
Simple Moving Average (10 days) : When the price is above the 10-day simple moving averaging, +1, when below -1
Weighted Moving Average (10 days) : Similar to the SMA 10, when the the price is above the 10-day weighted moving average, +1, when below -1
Stochastic K% : If the current Stochastic K% is greater than the previous value, then +1, else -1.
Stochastic D% : Similar to the Stochastic K%, when the current Stochastic D% is greater than the previous value, +1, else -1.
MACD Difference : First subtract the MACD signal (i.e. the moving average) from the MACD value and if the current value is higher than the previous value, then +1, else -1.
William's R% : If the current William's R% is greater than the previous one, then +1, else -1.
William's Accumulation/Distribution : If the current William's AD value is greater than the previous value, then +1, else -1.
Commodity Channel Index : If the Commodity Channel Index is greater than 200 (overbought), then -1, if it is less than -200 (oversold) then +1. When it is between those values, if the current value is greater than the previous value then +1, else -1.
Relative Strength Index : If the Relative Strength Index is over 70 (overbought) then -1 and if under 30 (oversold) then +1. If the Relative Strength Indicator is between those values then if the current value is higher than the previous value +1, else -1.
Momentum (9 days) : If the momentum value is greater than 0, then +1, else -1.
Again, once these values have been calculated and converted, they are added up to produce a single value. This single value is then summed across the previous 20 candles to produce a running sum.
By coalescing multiple technical indicators into a single value across time, traders can better understand how multiple inter-related indicators are behaving at once; high scores indicate that numerous indicators are showing bullish signals indicating a potential or ongoing uptrend (and vice-versa with low scores).
Additional Features
Numerous smoothing transformations have also been added (e.g. gaussian smoothing) to remove some of the noise might exist.
Suggested Use
It is recommended that stocks are shorted when the cross below 0, and are bought when the ETI crosses above -40. Arrows can be shown on the indicator to show these points. However feel free to use levels that work best for you.
Traditionally, I have treated values above +50 as overbought and below -40 as undersold (with -80 indicating extremely oversold); however these levels could also indicate either upwards and downwards momentum so taking a position based on where the ETI is (rather than crossing levels) should be done with caution.
Parsifal.Swing.FlowThe Parsifal.Swing.Flow indicator is a module within the Parsifal Swing Suite, which includes a set of swing indicators such as:
• Parsifal Swing TrendScore
• Parsifal Swing Composite
• Parsifal Swing RSI
• Parsifal Swing Flow
Each module serves as an indicator facilitating judgment of the current swing state in the underlying market.
________________________________________
Background
Market movements typically follow a time-varying trend channel within which prices oscillate. These oscillations—or swings—within the trend are inherently tradable.
They can be approached:
• One-sidedly, aligning with the trend (generally safer), or
• Two-sidedly, aiming to profit from mean reversions as well.
Note: Mean reversions in strong trends often manifest as sideways consolidations, making one-sided trades more stable.
________________________________________
The Parsifal Swing Suite
The modules aim to provide additional insights into the swing state within a trend and offer various trigger points to assist with entry decisions.
All modules in the suite act as weak oscillators, meaning they fluctuate within a range but are not bounded like true oscillators (e.g., RSI, which is constrained between 0% and 100%).
________________________________________
The Parsifal.Swing.Flow – Specifics
The Parsifal.Swing.Flow module aggregates price and trading flow data per bin (a "bin" refers to a single candle or time bucket) and smooths this information over recent historical data to reflect ongoing market dynamics.
________________________________________
How Swing.Flow Works
For each bin, individual data points—called "bin-infolets"—are collected. Each infolet reflects the degree and direction of trading flow, offering insight into buying and selling pressure.
The module processes this data in two steps:
1. Aggregation:
All bin-infolet values within a bin are averaged to produce a single bin-flow value.
2. Smoothing:
The resulting bin-flow values are then smoothed across multiple bins, typically using short-term EMAs.
The outcome is a dynamic representation of the current swing state based on recent trading flow activity.
________________________________________
How to Interpret Swing.Flow
• Range-bound but not a true oscillator:
While individual bin-infolets are range-bound, the Swing.Flow indicator itself is not a classical oscillator.
• Overbought/Oversold Signals:
Historically high or low values in Swing.Flow may signal overbought or oversold conditions.
• Chart Representation:
o A fast curve (orange)
o A slow curve (white)
o A shaded background that illustrates overall market state
• Mean Reversion Signals:
Extreme curve values followed by reversals may indicate the onset of a mean reversion in price.
________________________________________
Flow Background Value
The Flow Background Value represents the net state of trading flow:
• > 0 (green shading) → Bullish mode
• < 0 (red shading) → Bearish mode
• The absolute value reflects the confidence level in the current trend direction
________________________________________
How to Use the Parsifal.Swing.Flow
Several change points can act as entry point triggers:
• Fast Trigger:
A change in the slope of the fast signal curve
• Trigger:
The fast line crossing the slow line or a change in the slope of the slow signal
• Slow Trigger:
A change in the sign of the Background Value
These triggers are visualized in the accompanying chart.
Additionally, market highs and lows that align with the swing indicator values can serve as pivot points for the ongoing price process.
________________________________________
As always, this indicator is best used in conjunction with other indicators and market information.
While Parsifal.Swing.Flow offers valuable insight and potential entry points, it does not predict future price action.
Rather, it reflects the most recent market tendencies, and should therefore be applied with discretion.
________________________________________
Extensions
• Aggregation Method:
The current approach—averaging all infolets—can be replaced by alternative weighting schemes, adjusted according to:
o Historical performance
o Relevance of data
o Specific market conditions
• Smoothing Period:
The EMA-based smoothing period can be varied. In general, EMAs can be enhanced to reflect relevance-weighted probability measures, giving greater importance to recent data for a more adaptive and dynamic response.
• Advanced Smoothing:
EMAs can be further extended to include negative weights, similar to wavelet transform techniques, allowing even greater flexibility in smoothing methodologies.

Parsifal.Swing.RSIThe Parsifal.Swing.RSI indicator is a module within the Parsifal Swing Suite, which includes a set of swing indicators:
• Parsifal Swing TrendScore
• Parsifal Swing Composite
• Parsifal Swing RSI
• Parsifal Swing Flow
Each module facilitates judgment of the current swing state in the underlying market.
________________________________________
Background
Market movements typically follow a time-varying trend channel within which prices oscillate. These swings within the trend are inherently tradable.
They can be approached:
• One-sidedly, in alignment with the trend (generally safer), or
• Two-sidedly, aiming to profit from mean reversions.
Note: In strong trends, mean reversions often appear as sideways consolidations, making one-sided trades more robust.
________________________________________
The Parsifal Swing Suite
The suite provides insights into current swing states and offers various entry point triggers.
All modules act as weak oscillators, meaning they fluctuate within a range but are not bounded like true oscillators (e.g., the RSI, which ranges from 0 to 100%).
________________________________________
The Parsifal.Swing.RSI – Specifics
The Parsifal.Swing.RSI is the simplest module in the suite. It uses variations of the classical RSI, explicitly combining:
• RSI: 14-period RSI of the market
• RSIMA: 14-period EMA of the RSI
• RSI21: 14-period RSI of the 21-period EMA of the market
• RSI21MA: 14-period EMA of RSI21
Component Behavior:
• RSI: Measures overbought/oversold levels but reacts very sensitively to price changes.
• RSIMA: Offers smoother directional signals, making it better for assessing swing continuation. Its slope and sign changes are more reliable indicators than pure RSI readings.
• RSI21: Based on smoothed prices. In strong trends, it reaches higher levels and reacts more smoothly than RSI.
• RSI21MA: Further smooths RSI21, serving as a medium-term swing estimator and a signal line for RSI21.
When RSI21 exceeds RSI, it indicates trend strength.
• In uptrends, RSI21 > RSI, with larger exceedance = stronger trend
• In downtrends, the reverse holds
________________________________________
Indicator Construction
The Swing RSI combines:
• RSI and RSIMA → short-term swings
• RSI21 and RSI21MA → medium-term swings
This results in:
• A fast swing curve, derived from RSI and RSI21
• A slow swing curve, derived from RSIMA and RSI21MA
This setup is smoother than RSI/RSIMA alone but more responsive than using RSI21/RSI21MA alone.
________________________________________
Background Value
The Background Value reflects the overall market state, derived from RSI21:
• > 0: shaded green → bullish mode
• < 0: shaded red → bearish mode
• The absolute value reflects confidence in the current mode
________________________________________
How to Use the Parsifal.Swing.RSI
Several change points can act as entry triggers:
• Fast Trigger: change in slope of the fast signal curve
• Trigger: fast line crossing slow line or change in slow signal's slope
• Slow Trigger: change in sign of the Background Value
Examples of these triggers are shown in the chart.
Additionally, market highs and lows aligned with swing values can serve as pivot points in evolving price movements.
________________________________________
As always, this indicator should be used alongside other tools and information in live trading.
While it provides valuable insights and potential entry points, it does not predict future price action.
It reflects the latest tendencies and should be used judiciously.

Adaptive RSI | Lyro RSThe Adaptive RSI | 𝓛𝔂𝓻𝓸 𝓡𝓢 indicator enhances the traditional Relative Strength Index (RSI) by integrating adaptive smoothing techniques and dynamic bands. This design aims to provide traders with a nuanced view of market momentum, highlighting potential trend shifts and overbought or oversold conditions.
Key Features
Adaptive RSI Calculation: Combines fast and slow Exponential Moving Averages (EMAs) of the RSI to capture momentum shifts effectively.
Dynamic Bands: Utilizes a smoothed standard deviation approach to create upper and lower bands around the adaptive RSI, aiding in identifying extreme market conditions.
Signal Line: An additional EMA of the adaptive RSI serves as a signal line, assisting in confirming trend directions.
Customizable Color Schemes: Offers multiple predefined color palettes, including "Classic," "Mystic," "Accented," and "Royal," with an option for users to define custom colors for bullish and bearish signals.
How It Works
Adaptive RSI Computation: Calculates the difference between fast and slow EMAs of the RSI, producing a responsive oscillator that adapts to market momentum.
Band Formation: Applies a smoothing factor to the standard deviation of the adaptive RSI, generating dynamic upper and lower bands that adjust to market volatility.
Signal Line Generation: Computes an EMA of the adaptive RSI to act as a signal line, providing additional confirmation for potential entries or exits.
Visualization: Plots the adaptive RSI as color-coded columns, with colors indicating bullish or bearish momentum. The dynamic bands are filled to visually represent overbought and oversold zones.
How to Use
Identify Momentum Shifts: Observe crossovers between the adaptive RSI and the signal line to detect potential changes in trend direction.
Spot Overbought/Oversold Conditions: Monitor when the adaptive RSI approaches or breaches the dynamic bands, signaling possible market extremes.
Customize Visuals: Select from predefined color palettes or define custom colors to align the indicator's appearance with personal preferences or chart themes.
Customization Options
RSI and EMA Lengths: Adjust the lengths of the RSI, fast EMA, slow EMA, and signal EMA to fine-tune the indicator's sensitivity.
Band Settings: Modify the band length, multiplier, and smoothing factor to control the responsiveness and width of the dynamic bands.
Color Schemes: Choose from predefined color modes or enable custom color settings to personalize the indicator's appearance.
⚠️ DISCLAIMER ⚠️: This indicator alone is not reliable and should be combined with other indicator(s) for a stronger signal.
ADX Forecast [Titans_Invest]ADX Forecast
This isn’t just another ADX indicator — it’s the most powerful and complete ADX tool ever created, and without question the best ADX indicator on TradingView, possibly even the best in the world.
ADX Forecast represents a revolutionary leap in trend strength analysis, blending the timeless principles of the classic ADX with cutting-edge predictive modeling. For the first time on TradingView, you can anticipate future ADX movements using scientifically validated linear regression — a true game-changer for traders looking to stay ahead of trend shifts.
1. Real-Time ADX Forecasting
By applying least squares linear regression, ADX Forecast projects the future trajectory of the ADX with exceptional accuracy. This forecasting power enables traders to anticipate changes in trend strength before they fully unfold — a vital edge in fast-moving markets.
2. Unmatched Customization & Precision
With 26 long entry conditions and 26 short entry conditions, this indicator accounts for every possible ADX scenario. Every parameter is fully customizable, making it adaptable to any trading strategy — from scalping to swing trading to long-term investing.
3. Transparency & Advanced Visualization
Visualize internal ADX dynamics in real time with interactive tags, smart flags, and fully adjustable threshold levels. Every signal is transparent, logic-based, and engineered to fit seamlessly into professional-grade trading systems.
4. Scientific Foundation, Elite Execution
Grounded in statistical precision and machine learning principles, ADX Forecast upgrades the classic ADX from a reactive lagging tool into a forward-looking trend prediction engine. This isn’t just an indicator — it’s a scientific evolution in trend analysis.
⯁ SCIENTIFIC BASIS LINEAR REGRESSION
Linear Regression is a fundamental method of statistics and machine learning, used to model the relationship between a dependent variable y and one or more independent variables 𝑥.
The general formula for a simple linear regression is given by:
y = β₀ + β₁x + ε
β₁ = Σ((xᵢ - x̄)(yᵢ - ȳ)) / Σ((xᵢ - x̄)²)
β₀ = ȳ - β₁x̄
Where:
y = is the predicted variable (e.g. future value of RSI)
x = is the explanatory variable (e.g. time or bar index)
β0 = is the intercept (value of 𝑦 when 𝑥 = 0)
𝛽1 = is the slope of the line (rate of change)
ε = is the random error term
The goal is to estimate the coefficients 𝛽0 and 𝛽1 so as to minimize the sum of the squared errors — the so-called Random Error Method Least Squares.
⯁ LEAST SQUARES ESTIMATION
To minimize the error between predicted and observed values, we use the following formulas:
β₁ = /
β₀ = ȳ - β₁x̄
Where:
∑ = sum
x̄ = mean of x
ȳ = mean of y
x_i, y_i = individual values of the variables.
Where:
x_i and y_i are the means of the independent and dependent variables, respectively.
i ranges from 1 to n, the number of observations.
These equations guarantee the best linear unbiased estimator, according to the Gauss-Markov theorem, assuming homoscedasticity and linearity.
⯁ LINEAR REGRESSION IN MACHINE LEARNING
Linear regression is one of the cornerstones of supervised learning. Its simplicity and ability to generate accurate quantitative predictions make it essential in AI systems, predictive algorithms, time series analysis, and automated trading strategies.
By applying this model to the ADX, you are literally putting artificial intelligence at the heart of a classic indicator, bringing a new dimension to technical analysis.
⯁ VISUAL INTERPRETATION
Imagine an ADX time series like this:
Time →
ADX →
The regression line will smooth these values and extend them n periods into the future, creating a predicted trajectory based on the historical moment. This line becomes the predicted ADX, which can be crossed with the actual ADX to generate more intelligent signals.
⯁ SUMMARY OF SCIENTIFIC CONCEPTS USED
Linear Regression Models the relationship between variables using a straight line.
Least Squares Minimizes the sum of squared errors between prediction and reality.
Time Series Forecasting Estimates future values based on historical data.
Supervised Learning Trains models to predict outputs from known inputs.
Statistical Smoothing Reduces noise and reveals underlying trends.
⯁ WHY THIS INDICATOR IS REVOLUTIONARY
Scientifically-based: Based on statistical theory and mathematical inference.
Unprecedented: First public ADX with least squares predictive modeling.
Intelligent: Built with machine learning logic.
Practical: Generates forward-thinking signals.
Customizable: Flexible for any trading strategy.
⯁ CONCLUSION
By combining ADX with linear regression, this indicator allows a trader to predict market momentum, not just follow it.
ADX Forecast is not just an indicator — it is a scientific breakthrough in technical analysis technology.
⯁ Example of simple linear regression, which has one independent variable:
⯁ In linear regression, observations ( red ) are considered to be the result of random deviations ( green ) from an underlying relationship ( blue ) between a dependent variable ( y ) and an independent variable ( x ).
⯁ Visualizing heteroscedasticity in a scatterplot against 100 random fitted values using Matlab:
⯁ The data sets in the Anscombe's quartet are designed to have approximately the same linear regression line (as well as nearly identical means, standard deviations, and correlations) but are graphically very different. This illustrates the pitfalls of relying solely on a fitted model to understand the relationship between variables.
⯁ The result of fitting a set of data points with a quadratic function:
_______________________________________________________________________
🥇 This is the world’s first ADX indicator with: Linear Regression for Forecasting 🥇_______________________________________________________________________
_________________________________________________
🔮 Linear Regression: PineScript Technical Parameters 🔮
_________________________________________________
Forecast Types:
• Flat: Assumes prices will remain the same.
• Linreg: Makes a 'Linear Regression' forecast for n periods.
Technical Information:
ta.linreg (built-in function)
Linear regression curve. A line that best fits the specified prices over a user-defined time period. It is calculated using the least squares method. The result of this function is calculated using the formula: linreg = intercept + slope * (length - 1 - offset), where intercept and slope are the values calculated using the least squares method on the source series.
Syntax:
• Function: ta.linreg()
Parameters:
• source: Source price series.
• length: Number of bars (period).
• offset: Offset.
• return: Linear regression curve.
This function has been cleverly applied to the RSI, making it capable of projecting future values based on past statistical trends.
______________________________________________________
______________________________________________________
⯁ WHAT IS THE ADX❓
The Average Directional Index (ADX) is a technical analysis indicator developed by J. Welles Wilder. It measures the strength of a trend in a market, regardless of whether the trend is up or down.
The ADX is an integral part of the Directional Movement System, which also includes the Plus Directional Indicator (+DI) and the Minus Directional Indicator (-DI). By combining these components, the ADX provides a comprehensive view of market trend strength.
⯁ HOW TO USE THE ADX❓
The ADX is calculated based on the moving average of the price range expansion over a specified period (usually 14 periods). It is plotted on a scale from 0 to 100 and has three main zones:
• Strong Trend: When the ADX is above 25, indicating a strong trend.
• Weak Trend: When the ADX is below 20, indicating a weak or non-existent trend.
• Neutral Zone: Between 20 and 25, where the trend strength is unclear.
______________________________________________________
______________________________________________________
⯁ ENTRY CONDITIONS
The conditions below are fully flexible and allow for complete customization of the signal.
______________________________________________________
______________________________________________________
🔹 CONDITIONS TO BUY 📈
______________________________________________________
• Signal Validity: The signal will remain valid for X bars .
• Signal Sequence: Configurable as AND or OR .
🔹 +DI > -DI
🔹 +DI < -DI
🔹 +DI > ADX
🔹 +DI < ADX
🔹 -DI > ADX
🔹 -DI < ADX
🔹 ADX > Threshold
🔹 ADX < Threshold
🔹 +DI > Threshold
🔹 +DI < Threshold
🔹 -DI > Threshold
🔹 -DI < Threshold
🔹 +DI (Crossover) -DI
🔹 +DI (Crossunder) -DI
🔹 +DI (Crossover) ADX
🔹 +DI (Crossunder) ADX
🔹 +DI (Crossover) Threshold
🔹 +DI (Crossunder) Threshold
🔹 -DI (Crossover) ADX
🔹 -DI (Crossunder) ADX
🔹 -DI (Crossover) Threshold
🔹 -DI (Crossunder) Threshold
🔮 +DI (Crossover) -DI Forecast
🔮 +DI (Crossunder) -DI Forecast
🔮 ADX (Crossover) +DI Forecast
🔮 ADX (Crossunder) +DI Forecast
______________________________________________________
______________________________________________________
🔸 CONDITIONS TO SELL 📉
______________________________________________________
• Signal Validity: The signal will remain valid for X bars .
• Signal Sequence: Configurable as AND or OR .
🔸 +DI > -DI
🔸 +DI < -DI
🔸 +DI > ADX
🔸 +DI < ADX
🔸 -DI > ADX
🔸 -DI < ADX
🔸 ADX > Threshold
🔸 ADX < Threshold
🔸 +DI > Threshold
🔸 +DI < Threshold
🔸 -DI > Threshold
🔸 -DI < Threshold
🔸 +DI (Crossover) -DI
🔸 +DI (Crossunder) -DI
🔸 +DI (Crossover) ADX
🔸 +DI (Crossunder) ADX
🔸 +DI (Crossover) Threshold
🔸 +DI (Crossunder) Threshold
🔸 -DI (Crossover) ADX
🔸 -DI (Crossunder) ADX
🔸 -DI (Crossover) Threshold
🔸 -DI (Crossunder) Threshold
🔮 +DI (Crossover) -DI Forecast
🔮 +DI (Crossunder) -DI Forecast
🔮 ADX (Crossover) +DI Forecast
🔮 ADX (Crossunder) +DI Forecast
______________________________________________________
______________________________________________________
🤖 AUTOMATION 🤖
• You can automate the BUY and SELL signals of this indicator.
______________________________________________________
______________________________________________________
⯁ UNIQUE FEATURES
______________________________________________________
Linear Regression: (Forecast)
Signal Validity: The signal will remain valid for X bars
Signal Sequence: Configurable as AND/OR
Condition Table: BUY/SELL
Condition Labels: BUY/SELL
Plot Labels in the Graph Above: BUY/SELL
Automate and Monitor Signals/Alerts: BUY/SELL
Linear Regression (Forecast)
Signal Validity: The signal will remain valid for X bars
Signal Sequence: Configurable as AND/OR
Table of Conditions: BUY/SELL
Conditions Label: BUY/SELL
Plot Labels in the graph above: BUY/SELL
Automate & Monitor Signals/Alerts: BUY/SELL
______________________________________________________
📜 SCRIPT : ADX Forecast
🎴 Art by : @Titans_Invest & @DiFlip
👨💻 Dev by : @Titans_Invest & @DiFlip
🎑 Titans Invest — The Wizards Without Gloves 🧤
✨ Enjoy!
______________________________________________________
o Mission 🗺
• Inspire Traders to manifest Magic in the Market.
o Vision 𐓏
• To elevate collective Energy 𐓷𐓏
