MARA + IREN / BTC Divergence Monitor (v6, fixed)This indicator tracks the relative performance of two major Bitcoin miners — MARA (Marathon Digital Holdings) and IREN (Irene Energy) against Bitcoin (BTC). It calculates smoothed ratios (Miner Price ÷ BTC Price) for each miner and automatically detects divergences and convergences between them.
Indicators and strategies

Sector Analysis [SS]Introducing the most powerful sector analysis tool/indicator available, to date, in Pine!
This is a whopper indicator, so be sure to read carefully to ensure you understand its applications and uses!
First of all, because this is a whopper, let's go over the key functional points of the indicator.
The indicator compares the 11 main sector ETFs against whichever ticker you are looking at.
The functions include the following:
Ability to pull technicals from the sectors, such as RSI, Stochastic and Z-Score;
Ability to look at the correlation of the sector ETF to the current ticker you are looking at.
Ability to calculate the R2 value between the ticker you are looking at and each sector.
The ability to run a Two Tailed T-Test against the log returns of the Ticker of interest and the Sector (to analyze statistically significant returns between sectors/tickers).
The ability to analyze the distribution of returns across all sector ETFs.
The ability to pull buying and selling volume across all sector ETFs.
The ability to create an integrated moving average using a sector ETF to predict the expected close range of a ticker of interest.
These are the highlight functions. Below, I will go more into them, what they mean and how to use them.
Pulling Technicals
This is pretty straight forward. You can pull technicals, such as RSI, Stochastic and Z-Score from all the sector ETFs and view them in a table.
See below for the example:
Pulling Correlation
In order to see which sector your ticker of interest follows more closely, we need to look first at correlation and then at R2.
The correlation will look at the immediate relationship over a specified time. A highly positive value, indicates a strong, symbiotic relationship, which the sector and the ticker follow each other. This would be represented by a correlation of 0.8 or higher.
A strong negative correlation, such as -0.8 or lower, indicates that the sector and the ticker are completely opposite. When one goes up, the other goes down and vice versa.
You can adjust your correlation assessment length directly in the settings menu:
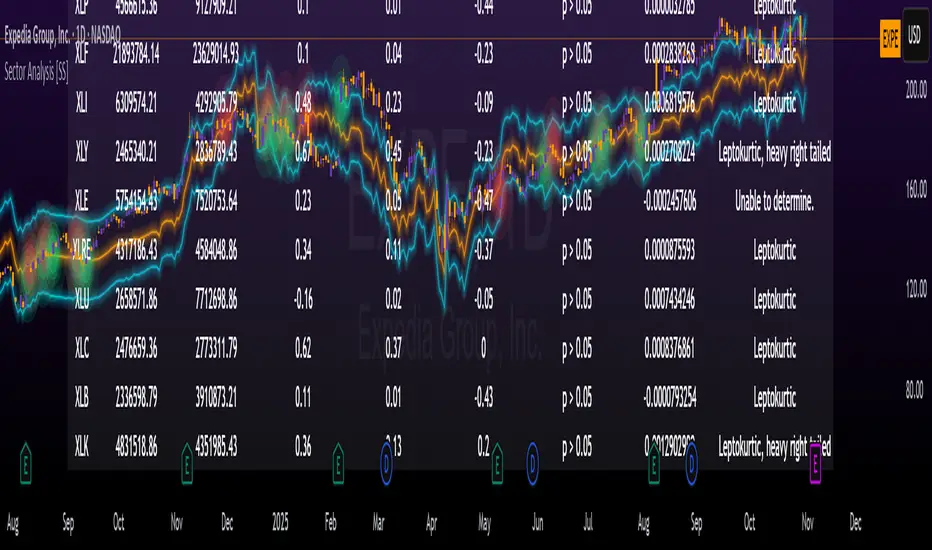
If you want to use a sector ETF to find the expected range for a ticker of interest, it is important to locate the highest, POSITIVE, correlation value. Here are the results for MSFT at a correlation lookback of 200:
In this example, we can see the best relationship is with the ETF XLK.
Analysis of R2
R2 is an important metric. It essentially measures how much of the variance between 2 tickers are explained by a simple, linear relationship.
A high R2 means that a huge degree of variance can be explained between the 2 tickers. A low R2 means that it cannot and that the 2 tickers are likely not integrated or closely related.
In general, if you want to use the sector ETF to find the mean and trading range and identify over-valuation/over-extension and under-extension statistically, you need to see both a high correlation and a high R-Squared. These 2 metrics should be analyzed together.
Let's take a look at MSFT:
Here, despite the correlation implying that XLK was the ticker we should use to analyze, when we look at the R Squared, we see actually, we should be using XLI.
XLI has a strong positive relationship with MSFT, albeit a bit less than XLK, but the R2 is solid, > 0.9, indicating the XLI explains much of MSFT's variance.
Two Tailed T-Test
A two tailed T-test analyzes whether there is a statistically significant difference between 2 different groups, or in our case, tickers.
The T-Test is conducted on the log returns of the ticker of interest and the sector. You then can see the P value results, whether it is significant or not. Let's look at MSFT again:
Looking at this, we can see there is no statistically significant difference in returns between MSFT and any of the sectors.
We can also see the SMA of the log returns for more detailed comparison.
If we were to observe a significant finding on the T-Test metrics, this would indicate that one sector either outperforms or underperforms your ticker to a statistically significant degree! If you stumble upon this, you would check the average log returns to compare against the average returns of your ticker of interest, to see whether there is better performance or worse performance from the sector ETF vs. your ticker of interest.
Analyzing the Distribution
The indicator will also analyze the distribution of returns.
This is an interesting option as it can help you ascertain risk. Normally distributed returns imply mean reverting behavviour. Deviations from that imply trending behaviour with higher risk expectancy. If we look at the distribution statistics currently over the last 200 trading days, here are the results:
Here, we can see all show signs of trending, as none of the returns are normally distributed. The highest risk sectors are XLK and XLY.
Why are they the highest risk?
Because the indicator has found a heavy right tailed distribution, indicated sudden and erratic mean reversion/losses are possible.
Creating an MA
Now for the big bonus of the indicator!
The indicator can actually create a regression based range from closely correlated sectors, so you can see, in sectors that are strongly correlated to your ticker, whether your ticker is over-bought, oversold or has mean reverted.
Let's look at MSFT using XLI, our previously identified sector with a high correlation and high R2 value:
The results are pretty impressive.
You can see that MSFT has rode the mean of the sector on the daily timeframe for quite some time. Each time it over extended itself above the sector implied range, it mean reverted.
Currently, if you were to trade based on Pairs or statistics, MSFT is no trade as it is currently trading at its sector mean.
If you are a visual person, you can have the indicator plot the mean reversion points directly:
Green represents a bullish mean reversion and red a bearish mean reversion.
Concluding Remarks
If you like pair trading, following the link between sectors and tickers or want a more objective way to determine whether a ticker is over-bought or oversold, this indicator can help you.
In addition to doing this, the indicator can provide risk insights into different sectors by looking at the distribution, as well as identify under-performing sectors or tickers.
It can also shed light on sectors that may be technically over-bought or oversold by looking at Z-Score, stochastics and RSI.
Its a whopper and I really hope you find it helpful and useful!
Thanks everyone for reading and checking this out!
Safe trades!
Mum Formasyonları TespitiIt is used to detect candles.
It is designed to analyze all the candles that form.
The most frequently formed candles are displayed on the price chart.


Gann Astronomical Turning PointsThis is a comprehensive Pine Script that implements W.D. Gann's astronomical theories to identify potential market turning points. Here's a detailed breakdown of the script:
Overview
The script identifies and displays astronomical events (sun angles, moon phases, and Mercury retrogrades) that Gann theorists believe correlate with market turning points. It also analyzes historical price performance following these events to provide statistical significance.
Key Components
1. Input Parameters
Date Range: Users can set the analysis period (start and end dates)
Display Options: Toggle visibility of different astronomical events and tables
Analysis Settings: Configure the lookback period for price change analysis (1-20 days)
2. Astronomical Calculations
The script includes several functions to calculate celestial positions:
getDaysSinceEpoch(t): Calculates days since January 1, 2000 (reference point)
getSunLongitude(t): Computes the Sun's position in the ecliptic (0-360°)
getMoonPhase(t): Determines the Moon's phase angle relative to the Sun
getMercuryLongitude(t): Calculates Mercury's position in the ecliptic
3. Gann Critical Angles (Sun Events)
The script identifies when the Sun reaches four critical angles that Gann considered significant:
0° Aries (Spring Equinox)
90° Cancer (Summer Solstice)
180° Libra (Fall Equinox)
270° Capricorn (Winter Solstice)
These are detected by tracking when the Sun's longitude crosses these specific angles.
4. Moon Phases
Four key moon phases are identified:
New Moon: Moon passes between Earth and Sun
First Quarter: Moon is 90° east of Sun
Full Moon: Moon is opposite the Sun
Last Quarter: Moon is 270° east of Sun
5. Mercury Retrograde Periods
The script detects when Mercury appears to move backward in its orbit:
Identifies start and end dates of retrograde motion
Displays these periods as highlighted zones on the chart
6. Price Change Analysis
For each astronomical event, the script:
Calculates the percentage price change over a user-defined lookback period
Categorizes changes as positive or negative
Stores this data for statistical analysis
7. Statistical Significance
The script calculates several metrics for each event type:
Average Price Change: Mean percentage change following events
Up/Down Ratio: Number of positive vs. negative changes
Accuracy Percentage: How often the dominant direction occurred
8. Visual Elements
The script includes multiple display components:
Event Labels
Sun Angles: Orange sun symbols displayed above price bars
Moon Phases: Moon phase emojis displayed below price bars
Mercury Retrograde: Red boxes highlighting the retrograde periods
Information Tables
Events Table: Shows upcoming and recent astronomical events
Significance Analysis Table: Displays statistical performance of each event type
Forecast Section: Identifies the next upcoming event and predicted direction
9. Forecasting Functionality
The script predicts market direction for the next astronomical event based on:
Historical average price change for that event type
Statistical accuracy of previous similar events
Color-coded forecast (green for bullish, red for bearish)
This script offers an interesting implementation of Gann's astronomical theories, but should be used as part of a broader analysis rather than as a standalone trading system.
Disclaimer: This indicator is for educational purposes only. Past performance does not guarantee future results. Always conduct your own research and risk assessment before trading.

Avg Candle Size Table (Ticks) The average of the last N candles in ticks shown on a table in the top right of the chart

JiNFOJiNFO is a clean, data-driven overlay that displays key information about the current symbol directly on your chart — without clutter.
🧭 What it shows
Company & Symbol Info – Name, ticker, sector, industry, market cap
Timeframe Label – Current chart timeframe (auto-formatted)
ATR (14) & % Volatility – With color dots for low 🟢 / medium 🟡 / high 🔴 volatility
Moving Average Status – Indicates if price is above or below the selected MA (default 150)
RSI & RSI-SMA (14) – Compact line with live values and color dot for overbought/neutral/oversold zones
Distance from SMA (50) – Shows how far price is from the 50 MA (+/- %) and grades it A–D by distance 🟢🟠🔴
Earnings Countdown – Days remaining until the next earnings date (if available)
⚙️ Customization
Position (top/middle/bottom, left/center/right)
Text size (default Small), color, opacity (100 %)
Toggle any data row on or off
Choose compact or verbose labels
🧩 Purpose
JiNFO replaces bulky data panels with a lightweight, transparent information layer — perfect for traders who want essential fundamentals, volatility, and technical context at a glance.

VIX Regime AnalyzerVIX Regime Analyzer
The VIX Regime Analyzer is an analytical tool that examines historical VIX patterns to provide insights into how your asset typically performs under similar volatility conditions.
Key Features:
Historical Pattern Matching: Automatically scans up to 1,000 bars of history to find all periods when VIX was at levels similar to today, using customizable tolerance ranges (absolute or percentage-based).
Forward-Looking Statistics: For each VIX regime match, calculates what actually happened to your asset over the next 1, 5, 10, and 20 trading days, providing both average returns and probability of positive outcomes.
Regime Classification System: Intelligently categorizes the current market environment as bullish or bearish: Visual Historical Context:
Background shading throughout your chart highlights every historical period when VIX matched current levels, color-coded by subsequent performance (green for gains, red for losses).
User Inputs:
VIX Level Tolerance (+/-): How closely VIX must match (default: ±5 points)
Use Relative Tolerance (%): Switch to percentage-based matching for consistency across different VIX levels
Lookback Period: How many bars to analyze
Highlight Historical VIX Matches: Toggle background highlighting of past matching periods
The Data Table
The statistics box appears in the right handside of your chart and contains three main sections:
Section 1: VIX REGIME
Current VIX: The live VIX closing price
Range: The tolerance band being searched (e.g., if VIX is 18 with ±5 tolerance, range is 13-23)
Historical Samples: Number of matching periods found in the lookback window (minimum 10 required for statistical validity)
Section 2: FORWARD RETURN
Shows the average percentage change in your asset over different timeframes following similar VIX levels:
Avg Next Day: What typically happened by the next trading session
Avg Next 5 Days: Average 5-day forward performance
Avg Next 10 Days: Average 10-day forward performance
Avg Next 20 Days: Average 20-day forward performance (approximately 1 month)
Section 3: PROBABILITY UP
Shows the win rate - the percentage of times your asset closed higher after VIX matched current levels:
Next Day: Probability of being up the next session
Next 5 Days: Probability of being up after 5 days
Next 10 Days: Probability of being up after 10 days
Next 20 Days: Probability of being up after 20 days
Colors:
🟢 Green: Bullish regimes (various strengths)
🔴 Red: Bearish regimes (various strengths)
🟡 Yellow: Choppy/uncertain regime
When "Highlight Historical VIX Matches" is enabled:
Scroll back through your chart and you'll see colored backgrounds highlighting every period when VIX matched today's level. The color tells you whether that match led to gains (green) or losses (red). This provides instant visual pattern recognition - you can quickly see if similar VIX levels historically led to bullish or bearish outcomes.
Practical Example:
If you see that most historical periods with similar VIX levels are highlighted in green, it suggests the current VIX level has historically been a bullish signal for your asset.
How The Indicator Makes Decisions
The regime classification uses both magnitude AND probability to avoid false signals:
Example of Strong Classification:
Average 5-day return: +1.5%
Win rate: 65%
Result: STRONG BULLISH (both high return and high probability)
Example of Weak Signal:
Average 5-day return: +2.0%
Win rate: 35%
Result: CHOPPY (high average but low consistency = unreliable)
This dual-factor approach ensures the indicator doesn't mislead you with regimes that had a few huge winners but mostly losers, or vice versa.
Best Practices
Combine with your existing strategy: Use this as a regime filter rather than standalone signals
Check sample size: More historical matches = more reliable statistics
Consider multiple timeframes: If 5-day and 20-day metrics disagree, proceed with caution
Asset-specific tuning: Different assets may require different tolerance settings
VIX spikes: The indicator is particularly useful during VIX spikes to understand if panic is justified
What Makes This Different
Unlike simple VIX indicators that just plot the fear index, this tool:
Quantifies the actual impact of VIX levels on YOUR specific asset
Provides probability-based forecasts rather than subjective interpretation
Shows historical context visually so you can see patterns at a glance
Uses rigorous statistical criteria to avoid false regime classifications

MTF VFSMA SqueezeThe purpose of this indicator is to detect a market squeeze (lack of volatility) period and to identify the initiation and direction of the breakout.
It is based on Variety-Filtered, Squeeze Moving Averages indicator.
The original indicator created by Loxx identifies both squeeze zones and breakouts/breakdowns. A squeeze zone is defined when price is below a specific volatility threshold calculated as the difference between a fast- and slow-moving average and filtered using ATR- or Pips-based threshold.
It operates on a single timeframe and includes Loxx's Expanded Source Types, signals, alerts, etc. and 35+ Loxx's Moving Averages. These adaptive, minimal-lag indicators are built upon advanced mathematical and signal processing DSP techniques that far surpass traditional Moving Averages.
This currently published indicator includes the following main developments:
Squeeze Detection using Percentile Rank Method
It detects the Squeeze by applying a Percentile Rank to the historical distance (spread) between the two MAs.
MA Spread: The basis for Squeeze detection is the distance between the two moving averages.
Percentile Rank: A statistical measure that indicates the percentage of past Spread values within the set lookback period that are lower than the current MA Spread.
Squeeze State: A Squeeze occurs when the Percentile Rank is below the set Squeeze Threshold (%)).
Example: If the threshold is 20% and the Rank is 15%, it means the MA Spread is in its tightest 15% range, below the set threshold. Therefore, the condition is currently met.
Goal: Objective volatility measurement that adapts to market conditions.
Squeeze Duration Filter
A key condition for a Breakout signal is that the MAs must have remained in the Squeeze zone for a specified minimum duration.
Goal: To filter out market noise and False Breakouts.
Multi-Timeframe (MTF) Confluence
Multi-Timeframe trend and squeeze monitoring for 3 timeframes (TFs).
Provides confirmation using the MA status from two higher timeframes (TF2, TF3).
Goal: Trend and momentum confirmation from a broader market context.
Signals Only on Bar Close?
By selecting the signalOnClose parameter to enabled, it is possible to avoid repainting on the chart TF. If it is checked, all events on the chart (L/S signals, Squeeze Start/End, MA color change) will only appear after the bar has closed, preventing repainting. Higher TF events remain in real-time.
Goal: To increase the reliability of signals.
Multi-Level Alerts and Info Panel
Comprehensive, confluence-weighted alerts and real-time status display.
Enhanced Alerts based on multi-timeframe confluences. Alerts are ready to enable/disable for Any alert() function call and ready for watchlists. Alert Frequency is also configurable in Inputs window. „Once per bar close” is the most reliable for signals. „Always” or „Once per bar” alert frequencies may generate temporary signal alerts.
Please note that even if "Once per bar close" is selected as alert frequency, this only applies to the chart TF, and TF2 and TF3 status may be modified until the close of the relevant candle.
Goal: Transparent decision-making.
Other Improvements
Unlike the original indicator, the coloring of the MA curves on the chart depends on the relative positions of the fast MA and slow MA. The curves are colored bullish when the fast MA is above the slow MA, bearish when the opposite is true, and neutral in the squeeze zone.
Data Window with Squeeze Start/End, Buy/Sell, Status, Squeeze Percentile etc. on all 3 TFs.
Ready for Pine Screener.
Please be aware that currently only the chart TF is configurable in Pine Screener, TF2 and TF3 are set to their default values.
Pine Script® version 6.
Limitations
When setting the indicator parameters, please take into account the limitations of TradingView. (Lookback period of Percentile Rank and Moving Averages periods, Execution time limit (timeout) etc.)
For example, if a NaN% message appears as the Percentile Rank value, please reduce the lookback period.
How to use it
This indicator is a Breakout-following system, but it can also be the basis for Range Trading.
The Setup Phase
This is the preparation stage. The indicator signals low volatility as the bands tighten.
Squeeze Dynamics: Monitoring the Squeeze Duration is essential. The longer the price spends in the Squeeze zone, the more likely the resulting breakout will be powerful.
The Signal Phase (Breakout)
The Breakout signal appears on the bar where the Percentile Rank first crosses above the Squeeze threshold, indicating a sudden return of volatility.
Further condition: Meets the SqueezeDuration filter.
Breakout direction: Bullish: Fast MA > SLow MA, Bearish: Fast MA < SLow MA
Applying MTF Confluence:
The most promising trades that are in line with higher timeframes:
Total Confluence: Chart TF Signal + TF2 Bullish/Bearish + TF3 Bullish/Bearish. This is the strongest, highest-probability setup.
Simple signal: Only the Chart TF signals. This should be handled with caution, as the higher timeframes (TF2, TF3) might still be in a Squeeze or in a conflicting state.
Alternative Use: Range Trading within the Squeeze Bands
If the market has low volume, the squeeze bands can be used as dynamic support/resistance for bounces off the edges of the range:
The probability of a successful range trade increases if the boundaries of the squeeze zone have only been touched a few times previously. Each touch weakens the zone boundaries and increases the chance of a Breakout.
Suggested Tactics and Risk Management
When using Breakout strategies, strict risk management and the use of confirmations are essential:
Volume Confirmation: A strong, above-average volume Breakout candle increases the probability of a successful breakout.
False Breakout: If the breakout occurs on low volume, there is a higher chance of a pullback and a False Breakout.
Entry After Retest: A safer entry: wait until the price breaks out, but only enter if it returns to the squeeze zone and bounces back from there. This reduces the risk of a False Breakout trap.
The Risk of False Breakout:
False Breakouts are part of any Breakout strategy. Always have a strict Stop Loss set.
Reversal: Be prepared for the possibility that after a Breakout signal (e.g., Long), the price returns to the zone and then breaks out in the opposite (Short) direction.
Please note that all technical analysis and trading signals only indicate probabilities. Always use your own risk management rules and follow market regulations.
Disclaimer
This indicator is provided for educational and informational purposes only. It is not financial advice.
Trading involves substantial risk of loss and is not suitable for every investor. Past performance shown in examples is not indicative of future results.
The indicator provides signals and calculations, but trading decisions are solely your responsibility. Always:
Test strategies on paper before using real money
Never risk more than you can afford to lose
Understand that all trading involves risk
Consider seeking advice from a licensed financial advisor
The publisher makes no guarantees regarding accuracy, profitability, or performance. Use at your own risk.


NY ORB - Full Dynamic SystemNY ORB - Full Dynamic Strategy Summary
1. Opening Range and Session Timing
Opening Range (ORB) Calculation: The strategy identifies the ORB High and ORB Low by tracking the highest high and lowest low during the specified New York pre-market window, which is set by default from 8:30 to 8:45 (New York time).
Entry Window: Trading activity is restricted to a specific entry period, typically starting shortly after the ORB is established (default: 8:50 to 12:00).
Hard Exit Time: Any remaining open positions are automatically closed at a fixed exit time (default: 13:25).
2. Trade Entry Logic and Filters
An entry (Long or Short) is generated when the price breaks out of the established ORB, provided it passes a series of optional filters:
Direction Control: The user can restrict the strategy to trade Long Only, Short Only, or Both.
Second Breakout Logic: An optional filter that requires the price to break out, reverse back into the range, and then break out again, confirming momentum after a consolidation.
Confirmation Candle Count: An optional filter that checks the close of a previous candle (e.g., 1 or 2 candles ago) to ensure the price was still inside the range, preventing premature entry.
Technical Filters (Optional): The entry is only executed if it aligns with selected indicators:
RSI: Filters for non-overbought (Long) or non-oversold (Short) conditions.
MACD: Requires the MACD line to be above/below the Signal line for alignment.
VWAP: Requires the price to be above/below the Volume-Weighted Average Price.
Trend Filter (SMMA): Requires the price to be above/below a 50-period Simple Moving Average.
3. Dynamic Risk and Exit Management
This strategy features highly configurable stop-loss and profit-taking mechanics:
Primary Stop Loss Methods: The Stop Loss distance can be dynamically chosen from four types:
Fixed: A fixed number of ticks.
ATR: Based on a multiple of the Average True Range (ATR).
Capped ATR: ATR-based, but with a hard maximum tick limit.
OR-Based: Based on a multiple of the actual ORB High-to-Low range.
Dynamic Profit Target: The Take Profit level is calculated dynamically based on a multiplier of either the ATR or the ORB Range.
Breakeven Stop:
If enabled, the Stop Loss automatically moves to the entry price (Breakeven) once the price moves a predetermined distance in the profitable direction.
An Adaptive Breakeven option allows the trigger distance to be calculated as a percentage of the overall ATR Profit Target.
Trailing Stop: The strategy uses a trailing stop, which can be custom-set (fixed ticks) or dynamically tied to the ATR. An optional feature Auto Tighten Trailing reduces the trailing multiplier once the breakeven level is hit.
MA Cross Exit: An alternative, counter-trend exit mechanism that closes the trade if the price crosses back over the chosen Moving Average (either SMMA or VWAP), overriding the pending profit target.
4. Daily Account Management
The strategy includes crucial daily risk controls to protect capital and lock in profits:
Daily Profit Limit: If the total daily PnL (realized and unrealized) hits a predefined maximum profit threshold (in ticks), all trades are closed, and new entries are blocked for the remainder of the trading day.
Daily Loss Limit: Conversely, if the total daily PnL hits a predefined maximum loss threshold, all trades are closed, and new entries are blocked for the remainder of the day.

Trailing 12M % Gain/Lossthis script shows profit or loss for training 12 months, works only on daily time frame

Multi-Anchor VWAP | Trade Symmetry🧩 Multi-Anchor VWAP
Description:
Dynamic VWAP anchored to Session, Week, Month, Quarter, and Year — all in one view.
Full Description:
This indicator plots multiple VWAPs (Volume-Weighted Average Prices) simultaneously — each anchored to a different time period:
Session, Week, Month, Quarter, and Year.
💡 Ideal for traders who track institutional mean reversion and liquidity zones across multiple timeframes.
Features
✅ Session, Weekly, Monthly, Quarterly, and Yearly Anchored VWAPs
✅ Independent color and visibility controls for each anchor
✅ Adjustable label position and size
✅ Option to hide VWAPs on Daily or higher charts
✅ Clean and efficient performance
This tool helps you visualize volume-weighted mean levels where price often reacts — offering a clear map of bias and equilibrium across all major time horizons.


Block-Based Trend Breakout (UTB/DTB) & S/R ZonesThis indicator is designed to detect potential trend reversals or volatility bursts by analyzing price action structured into "blocks." Its primary goal is to capture the earliest signals that a defined trend structure is weakening or breaking.
Signal Generation:
🟢 DTB (Downtrend Breakout): When a confirmed downtrend is identified (e.g., price has been falling for 2 blocks), the indicator waits for the price to break above the highest high of the last completed block in that trend. When this break occurs, it signals a potential bullish reversal with a green DTB triangle below the bar.
🔴 UTB (Uptrend Breakdown): When a confirmed uptrend is identified (e.g., price has been rising for 2 blocks), the indicator waits for the price to break below the lowest low of the last completed block. When this break occurs, it signals a potential bearish reversal with a red UTB triangle above the bar.
🛠️ Key Settings
Block Size (bars): The number of bars in each block used to analyze the trend structure. Lower values track short-term trends; higher values track long-term trends.
Trend Confirmation (steps): The minimum number of consecutive blocks required to "confirm" a trend.
Tolerance: Allowed Off-Trend Steps: The number of "noise" blocks allowed while confirming a trend.
Show Support/Resistance Zones: Toggles the histogram-based S/R zones on or off.
S/R Lookback (blocks): Determines how many blocks to look back for calculating S/R zones.
S/R Zone Width (in ATR): Sets the thickness of the S/R zones, denominated in ATRs.
If you find this useful please reach out and let me know how you use it as it's fairly unique... and thus different than anything I've ever seen or used.

Bardan Bias 3.0this script uses SMAs on both the viewed chart and BTC/USD chart so user can get a general market direction
