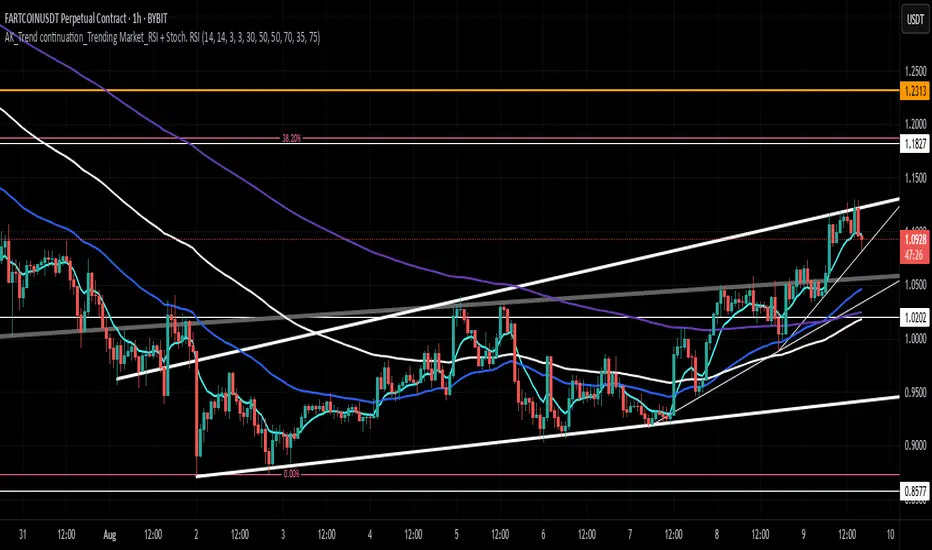
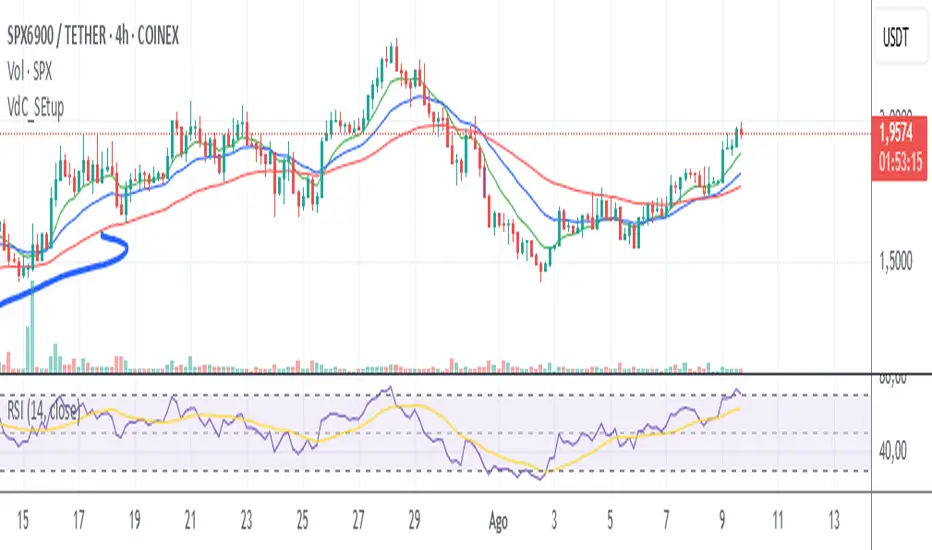
AK_Trend continuation_Trending Market_RSI + Stoch. RSIIndicator to predict where to buy and sell based on market structure. Most applicable in a trending market. Based on RSI and Stochastic RSI
Indicators and strategies
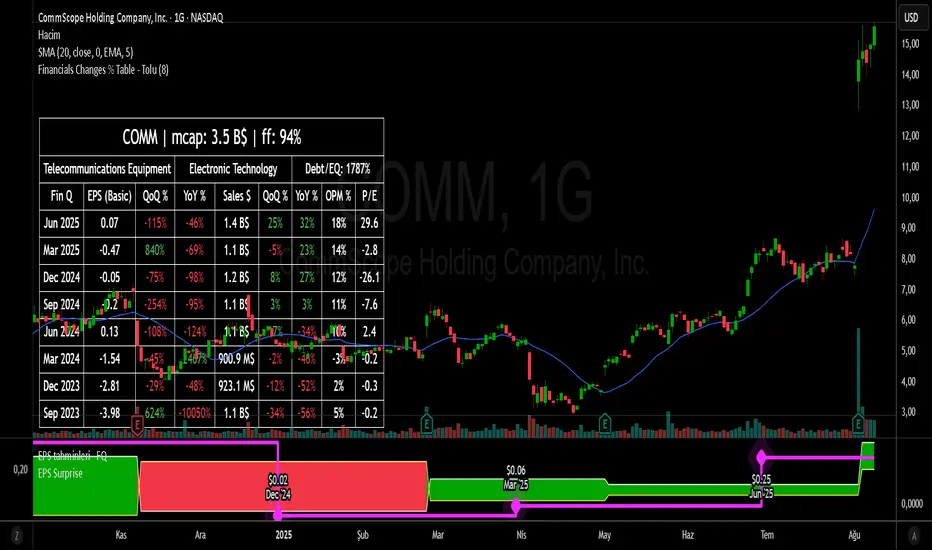
Financial Change % Table - ToluFinancial Change % Table which includes revenue , operating profit and earning per share . compares the financial data with previous quarter QoQ and previous year YoY . and shows the change in %.
xmtr's session highs/lowsMarks Asia & London session highs/lows with precision + PDH/PDL for daily context. Fully customizable & perfect for all traders.

BB & RSI Trailing Stop StrategySimple BB & RSI generated using AI, gets 60% on S&P 500 with the right settings

Advanced CVD with DivergenceOnce added, you'll see:
A new pane below your main chart showing the CVD line (blue by default)
A dotted gray zero line across the middle of the CVD pane
Bullish divergence signals: "BULL" labels below price bars
Bearish divergence signals: "BEAR" labels above price bars
What CVD Shows:
Rising CVD line: More buying pressure than selling (aggressive buyers)
Falling CVD line: More selling pressure than buying (aggressive sellers)
Crossing above zero: Net buying pressure is dominant
Crossing below zero: Net selling pressure is dominant
Using Divergence Signals (Most Powerful Feature)
Bullish Divergence (BUY signal):
Appears when price makes a lower low but CVD makes a higher low
Indicates weakening selling pressure despite lower prices
Best used when:
Price is at key support level
RSI is oversold (<30)
Volume is increasing on up moves
Bearish Divergence (SELL signal):
Appears when price makes a higher high but CVD makes a lower high
Indicates weakening buying pressure despite higher prices
Best used when:
Price is at key resistance level
RSI is overbought (>70)
Volume is decreasing on up moves

MACD (Panel) with Histogram-Confirmed Signals - Middle LineMacd indicator with buy and sell signals to help spot the macd signal crossover and histogram
Chiefs sessions 4This is just an indicator marking the most recent asian session and london session highs and lows, and also marks off previous days high and lows in white. Blue is asian session and red is london. This indicator resets every day.


SR Indicator//@version=5
indicator("TenUp Bots S R (fixed)", overlay=true)
a = input.int(title="Sensitivity", defval=10, minval=1, maxval=9999)
d = input.int(title="Transparency", defval=85, minval=0, maxval=100)
colR = color.new(color.red, d)
colS = color.new(color.blue, d)
// Use ta.highest(source, length) and ta.lowest(source, length)
plot(ta.highest(high, a * 1), title='Resistance 1', color=colR, linewidth=2, style=plot.style_line, trackprice=true)
plot(ta.lowest(low, a * 1), title='Support 1', color=colS, linewidth=2, style=plot.style_line, trackprice=true)
plot(ta.highest(high, a * 2), title='Resistance 2', color=colR, linewidth=2, style=plot.style_line, trackprice=true)
plot(ta.lowest(low, a * 2), title='Support 2', color=colS, linewidth=2, style=plot.style_line, trackprice=true)
plot(ta.highest(high, a * 3), title='Resistance 3', color=colR, linewidth=2, style=plot.style_line, trackprice=true)
plot(ta.lowest(low, a * 3), title='Support 3', color=colS, linewidth=2, style=plot.style_line, trackprice=true)
// ... repeat for all multipliers you had ...
// (copy the pattern above for 4,5,6,...,1500)

ADR/ATR Session by LK## **Features**
1. **Custom ADR & ATR Calculation**
* Calculates **Average Daily Range (ADR)** and **Average True Range (ATR)** separately for:
* **Session timeframe** (default H4 / 06:00–13:00)
* **Daily timeframe**
* Independent smoothing method selection (**SMA, EMA, RMA, WMA**) for H4 ADR, H4 ATR, Daily ADR, and Daily ATR.
2. **Percentage Metrics**
* % of ADR / ATR covered by the **current H4 bar**.
* ADR / ATR expressed as a percentage of the **current price**.
* % of ADR already reached for the **current day**.
* % of Daily ATR vs current day’s True Range.
3. **Dynamic Chart Lines**
* Draws **3 lines for H4**: Session Open, ADR High, ADR Low.
* Draws **3 lines for Daily**: Daily Open, ADR High, ADR Low.
* Lines **extend to the right** so they stay visible across the chart.
* Colors and widths are fully customizable.
4. **Real-Time Data Table**
* Compact table displaying all ADR/ATR values and percentages.
* Adjustable table font size (**tiny, small, normal, large, huge**).
* Transparent background option for minimal chart obstruction.
5. **Flexible Session Settings**
* Select session start and end time in hours/minutes.
* Choose session timezone (chart timezone or major financial centers).
* Toggle H4 lines, Daily lines separately.
6. **Lookahead Control**
* Option to wait for higher-timeframe candle close before updating values (more accurate, less repainting).
---
## **How to Use**
### **1. Adding the Indicator**
* Copy and paste the Pine Script into TradingView’s Pine Editor.
* Click **“Add to chart”**.
* Make sure your chart supports the higher timeframes you choose (e.g., H4 and Daily).
### **2. Setting Your Session**
* **Session Start Hour** & **End Hour** → Defines the intraday session to measure ADR/ATR (default: 06:00–13:00).
* **Session Timezone** → Pick “Chart” or a major financial center (e.g., New York, London, Tokyo).
### **3. Choosing Smoothing Methods**
* For each ADR/ATR (H4 and Daily), choose:
* SMA (Simple)
* EMA (Exponential)
* RMA (Wilder’s smoothing)
* WMA (Weighted)
### **4. Adjusting Chart Display**
* **Show H4 Lines** → Displays session open and ADR High/Low for the current H4 session.
* **Show Daily Lines** → Displays daily open and ADR High/Low.
* Customize line colors and widths.
### **5. Reading the Table**
* **H4 Section**
* ADR / ATR values for the selected session.
* % of ADR/ATR covered by the **current H4 bar**.
* ADR/ATR as % of the current price.
* **Daily Section**
* ADR / ATR for the daily timeframe.
* % of ADR already covered by today’s range.
* ADR/ATR as % of price.
### **6. Pro Tips**
* Use **H4 ADR %** to gauge intraday exhaustion — if current range is near 100%, market may slow or reverse.
* Use **Daily ADR %** for swing trade context — if a day has moved beyond its ADR, expect lower continuation probability.
* Combine with support/resistance to identify high-probability reversal zones.

Painel Técnico (4H x 1D) — Clean UI + Alertas BrenoG📋 Main Functions
1️⃣ Analysis in two fixed timeframes
4 hours and 1 day analyzed in parallel.
Each column in the table displays the data for its respective timeframe.
2️⃣ Entry point based on oversold conditions
The “entry point” is not the current price, but rather the last candle that went into oversold territory (RSI ≤ configured threshold).
If there has been no recent oversold condition, the current price is used as a fallback.
All calculations (Buy Zone, Stops, TPs) are based on this point.
3️⃣ Buy Zone
Defined as:
java
Copiar
Editar
Low Zone = entry * (1 - width%)
High Zone = entry
Always visible in the table, but alerts can be set to trigger only if RSI is oversold at the moment of entry.
4️⃣ Automatic Stops
Moderate Stop and Conservative Stop, calculated as a % below the entry point.
Displayed in the table with black text on a gray background for emphasis.
Alerts trigger when price crosses below these levels.
5️⃣ Take Profits (TP1–TP4)
Calculated from the entry point:
By percentage (usePercentTP = true) or
By fixed prices (usePercentTP = false).
The table displays:
Target price
% gain over the entry point
They only appear when RSI > 50 and EMA50 > EMA200 (the “alignment” condition).
Alerts trigger only on breakouts upward.
6️⃣ Context Indicators
RSI → shows numeric value and green/red color.
MACD → indicates if the MACD line is above or below the signal line.
EMAs 50/200 → indicates “Golden Cross” or “Death Cross”.
Price vs EMA200 → dedicated row showing “Above” or “Below EMA 200” with green/red color.
7️⃣ Visual Panel
Semi–transparent dark gray background, thin borders.
Colored header:
Blue for 4H
Orange for 1D
Rows separated by data type for easy reading.
Configurable font size (tiny to large).
Table position configurable (top_left, top_right, etc.).
8️⃣ Integrated Alerts
Entry/Exit of Buy Zone
Touch of each TP
Touch of each Stop
RSI entering Oversold
All alerts are separated by timeframe with clear, fixed messages.
📌 Simple Summary:
It’s an intelligent panel that combines multi–timeframe technical analysis, automatic calculation of entries/stops/TPs based on oversold conditions, and ready–to–use alerts — all presented in a visual, compact, and fully configurable format.

AK_Trend reversal_Range_Market_RSI + Stoch. RSIRSI + Stoch. RSI based indicator to predict trend reversal. Most applicable in range market

Defense Mode Dashboard ProWhat it is
A one‑look market regime dashboard for ES, NQ, YM, RTY, and SPY that tells you when to play defense, when you might have an offense cue, and when to chill. It blends VIX, VIX term structure, ATR 5 over 60, and session gap signals with clean alerts and a compact table you can park anywhere.
Why traders like it
Because it filters out the noise. Regime first, tactics second. You avoid trading size into landmines and lean in when volatility cooperates.
What it measures
Volatility stress with VIX level and VIX vs 20‑SMA
Term structure using VX1 vs VX2 with two modes
Diff mode: VX1 minus VX2
Ratio mode: VX1 divided by VX2
Realized volatility using ATR5 over ATR60 with optional smoothing
Session risk from RTH opening gaps and overnight range, normalized by ATR
How to use in 30 seconds
Pick a preset in the inputs. ES, NQ, YM, RTY, SPY are ready.
Leave thresholds at defaults to start.
Add one TradingView alert using “Any alert() function call”.
Trade smaller or stand aside when the header reads DEFENSE ON. Consider leaning in only when you see OFFENSE CUE and your playbook agrees.
Defaults we recommend
VIX triggers: 22 and 1.25× the 20‑SMA
Term mode: Diff with tolerance 0.00. Use Ratio at 1.00+ for choppier markets
ATR 5/60 defense: 1.25. Offense cue: 0.85 or lower
ATR smoothing: 1. Try 2 to 3 if you want fewer flips
Gap mode: RTH. Turn Both on if you want ON range to count too
RTH wild gap: 0.60× ATR5. ON wild range: 0.80× ATR5
Alert cadence: Once per RTH session
Snooze: Quick snooze first 30 minutes on. Fire on snooze exit off, unless you really want the catch‑up ping
New since the last description
Multi‑asset presets set symbols and RTH windows for ES, NQ, YM, RTY, SPY
Term ratio mode with near‑flat warning when ratio is between 1.00 and your trigger
ATR smoothing for the 5 over 60 ratio
RTH keying for cadence, so “Once per RTH session” behaves like a trader expects
Snooze upgrades with quick snooze tied to the first N minutes of RTH and an optional fire‑on‑snooze‑exit
Compact title merge and user color controls for labels, values, borders, and background
Exposed series for integrations: DefenseOn(1=yes) and OffenseCue(1=yes)
Debug toggle to visualize gap points, ON range, and term readings
Stronger NA handling with a clear “No core data” row when feeds are missing
Notes
Dynamic alerts require “Any alert() function call”.
Works on any chart timeframe. Daily reads and 1‑minute anchors handle the regime logic.

VPOC Progressivo – Start da data/oraPlots a progressive VPOC starting from a user-selected bar.
The script accumulates volume and updates the Volume Point of Control (VPOC) on every bar. Useful for analysing intraday volume distribution from any custom starting point.

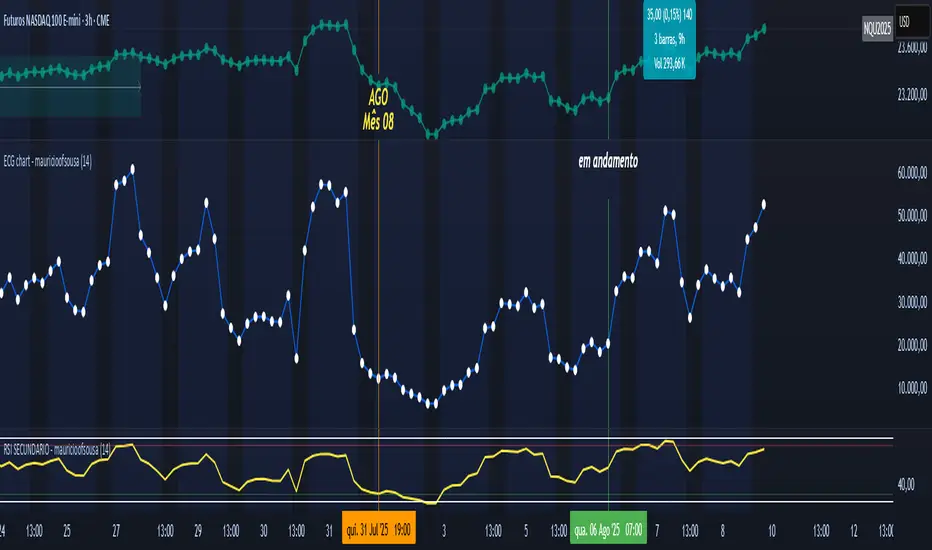
ECG chart - mauricioofsousaMGO Primary – Matriz Gráficos ON
The Blockchain of Trading applied to price behavior
The MGO Primary is the foundation of Matriz Gráficos ON — an advanced graphical methodology that transforms market movement into a logical, predictable, and objective sequence, inspired by blockchain architecture and periodic oscillatory phenomena.
This indicator replaces emotional candlestick reading with a mathematical interpretation of price blocks, cycles, and frequency. Its mission is to eliminate noise, anticipate reversals, and clearly show where capital is entering or exiting the market.
What MGO Primary detects:
Oscillatory phenomena that reveal the true behavior of orders in the book:
RPA – Breakout of Bullish Pivot
RPB – Breakout of Bearish Pivot
RBA – Sharp Bullish Breakout
RBB – Sharp Bearish Breakout
Rhythmic patterns that repeat in medium timeframes (especially on 12H and 4H)
Wave and block frequency, highlighting critical entry and exit zones
Validation through Primary and Secondary RSI, measuring the real strength behind movements
Who is this indicator for:
Traders seeking statistical clarity and visual logic
Operators who want to escape the subjectivity of candlesticks
Anyone who values technical precision with operational discipline
Recommended use:
Ideal timeframes: 12H (high precision) and 4H (moderate intensity)
Recommended assets: indices (e.g., NASDAQ), liquid stocks, and futures
Combine with: structured risk management and macro context analysis
Real-world performance:
The MGO12H achieved a 92% accuracy rate in 2025 on the NASDAQ, outperforming the average performance of major global quantitative strategies, with a net score of over 6,200 points for the year.
VPOC Giornaliero Cumulativo (fix)Title: VPOC – Daily Cumulative Point of Control
Description:
This indicator plots the Volume Point of Control (VPOC) for the current day and updates it on every bar.
The price range is taken from the start of the trading day (based on your chart’s exchange time).
The range is divided into a fixed number of price bins (default: 24).
At each new bar, the script adds that bar’s volume to the bin where the close price falls.
The bin with the highest cumulative volume is marked as the current VPOC and plotted as a continuous red line.
📌 Use cases:
Monitor where the majority of today’s trading volume is concentrated.
Track how the VPOC shifts during the session to spot changes in market control.
Combine with your intraday strategy to confirm or reject trade ideas around high-volume prices.
⚠ Notes:
VPOC resets at the start of each day.
When the day’s high/low range expands, the bin mid-prices are updated, but existing volume stays in its original bin (no full re-binning).
Works on any intraday timeframe; choose bin count to control price resolution.

Enhanced CPR with Historical Levelsit shows the previous days high,low 2 daysa and 3 days back high low

EMA21 Cross with 3-Bar Confirmation//@version=5
indicator("EMA21 Cross with 3-Bar Confirmation", overlay=true)
// Calculate 21-period EMA
ema21 = ta.ema(close, 21)
plot(ema21, "EMA21", color=color.blue, linewidth=2)
// Buy Conditions
crossover = ta.crossover(close, ema21)
threeBarsAfterCross = crossover
// Conditions for the 3 bars after crossover:
// 1. At least one red candle (close < open)
// 2. No candle closes below EMA21
// 3. No candle crosses below EMA21
hasRedCandle = (close < open ) or (close < open ) or (close < open)
allAboveEMA = (close > ema21 ) and (close > ema21 ) and (close > ema21)
noCrossDown = not (ta.crossunder(close , ema21 ) or ta.crossunder(close , ema21 ) or ta.crossunder(close, ema21))
buySignal = threeBarsAfterCross and hasRedCandle and allAboveEMA and noCrossDown
// Sell Conditions (opposite logic)
crossunder = ta.crossunder(close, ema21)
threeBarsAfterUnder = crossunder
// Conditions for the 3 bars after crossunder:
// 1. At least one green candle (close > open)
// 2. No candle closes above EMA21
// 3. No candle crosses above EMA21
hasGreenCandle = (close > open ) or (close > open ) or (close > open)
allBelowEMA = (close < ema21 ) and (close < ema21 ) and (close < ema21)
noCrossUp = not (ta.crossover(close , ema21 ) or ta.crossover(close , ema21 ) or ta.crossover(close, ema21))
sellSignal = threeBarsAfterUnder and hasGreenCandle and allBelowEMA and noCrossUp
// Plot Signals
plotshape(buySignal, title="Buy Signal", text="BUY", location=location.belowbar, color=color.green, size=size.small)
plotshape(sellSignal, title="Sell Signal", text="SELL", location=location.abovebar, color=color.red, size=size.small)
// Optional: Plot arrows on chart
plotarrow(buySignal ? 1 : na, title="Buy Arrow", colorup=color.green, maxheight=60)
plotarrow(sellSignal ? -1 : na, title="Sell Arrow", colordown=color.red, maxheight=60)

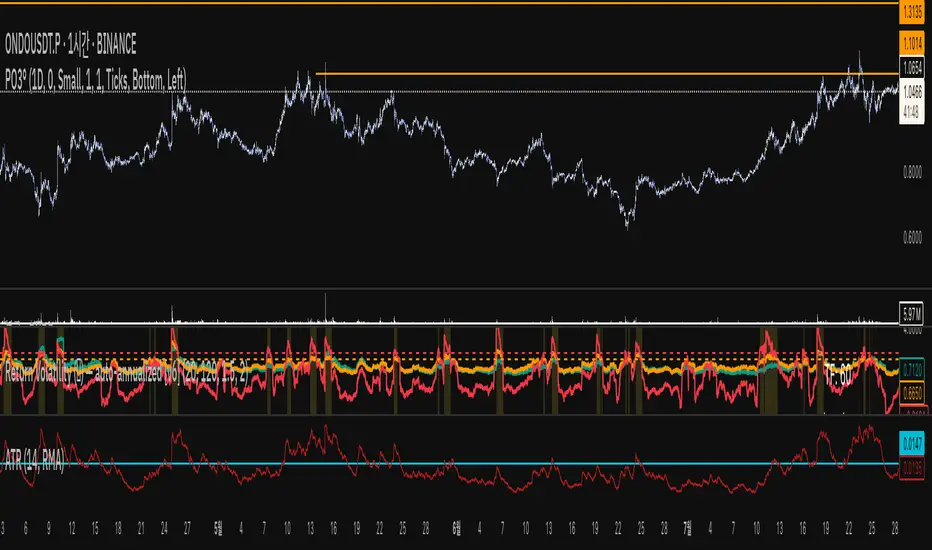
Return Volatility (σ) — auto-annualized [v6]Overview
This indicator calculates and visualizes the return-based volatility (standard deviation) of any asset, automatically adjusting for your chart's timeframe to provide both absolute and annualized volatility values.
It’s designed for traders who want to filter trades, adjust position sizing, and detect volatility events based on statistically significant changes in market activity.
Key Features
Absolute Volatility (abs σ%) – Standard deviation of returns for the current timeframe (e.g., 1H, 4H, 1D).
Annualized Volatility (ann σ%) – Converts abs σ% into an annualized figure for easier cross-timeframe and cross-asset comparison.
Relative Volatility (rel σ) – Ratio of current volatility to the long-term average (default: 120 periods).
Z-Score – Number of standard deviations the current volatility is above or below its historical average.
Auto-Timeframe Adjustment – Detects your chart’s bar size (seconds per bar) and calculates bars/year automatically for crypto’s 24/7 market.
Highlight Mode – Optional yellow background when volatility exceeds set thresholds (rel σ ≥ threshold OR z-score ≥ threshold).
Alert Conditions – Alerts trigger when relative volatility or z-score exceed defined limits.
How It Works
Return Calculation
Log returns: ln(Pt / Pt-1) (default)
or Simple returns: (Pt / Pt-1) – 1
Volatility Measurement
Standard deviation of returns over the lookback period N (default: 20 bars).
Absolute volatility = σ × 100 (% per bar).
Annualization
Uses: σₐₙₙ = σ × √(bars/year) × 100 (%)
Bars/year auto-calculated based on timeframe:
1H = 8,760 bars/year
4H ≈ 2,190 bars/year
1D = 365 bars/year
Relative and Statistical Context
Relative σ = Current σ / Historical average σ (baseLen, default: 120)
Z-score = (Current σ – Historical average σ) / Std. dev. of σ over baseLen
Trading Applications
Volatility Filter – Only allow trade entries when volatility exceeds historical norms (trend traders often benefit from this).
Risk Management – Reduce position size during high volatility spikes to manage risk; increase size in low-volatility trending environments.
Market Scanning – Identify assets with the highest relative volatility for momentum or breakout strategies.
Event Detection – Highlight significant volatility surges that may precede large moves.
Suggested Settings
Lookback (N): 20 bars for short/medium-term trading.
Base Length (M): 120 bars to establish long-term volatility baseline.
Relative Threshold: 1.5× baseline σ.
Z-score Threshold: ≥ 2.0 for statistically significant volatility shifts.
Use Log Returns: Recommended for more consistent scaling across prices.
Notes & Limitations
Volatility measures movement magnitude, not direction. Combine with trend or momentum filters for directional bias.
Very low volatility may still produce false breakouts; combine with volume and market structure analysis.
Crypto markets trade 24/7 — annualization assumes no market closures; adjust for other asset classes if needed.
💡 Best Practice: Use this indicator as a pre-trade filter for breakout or trend-following strategies, or as a risk control overlay in mean-reversion systems.
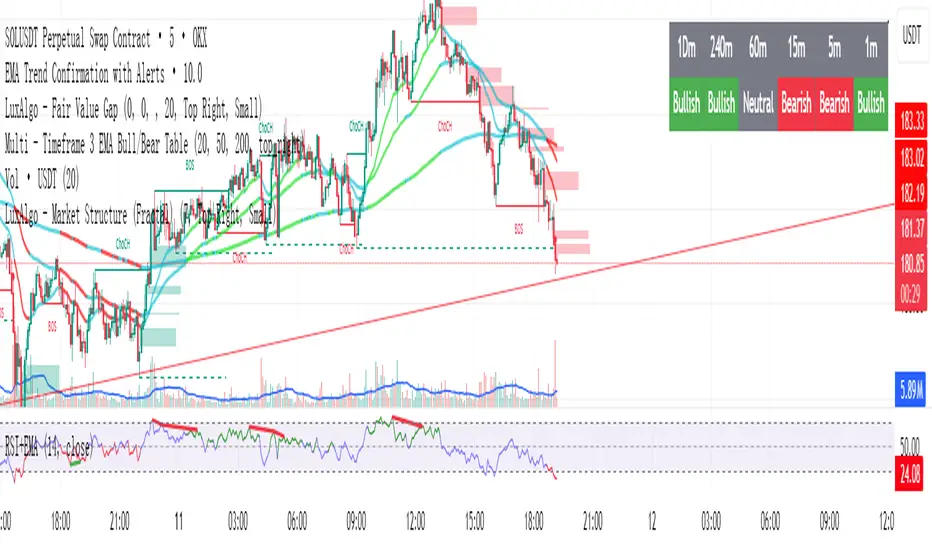
Multi - Timeframe 3 EMA Bull/Bear Table此指标是一个图标指标,适用于短线交易以及中线交易,它明确的显示出来了用EMA来表示方向指示,1分钟不可使用,此图表更新了多次以及修改了多次,在实际回测中有明显的提醒作用,不过多用于参考,不可作为主要指标使用,代码稍复杂如有加以改进的地方请提出,其中核心使用了EMA的20,50,200周期来作为参考,目的是能识别多周期和时间的方向指示,注意:此指标建议仅用于方向参考,不用于主要指标交易。
This indicator is a graphical indicator suitable for short-term and medium-term trading. It clearly shows the direction indicated by the EMA. It cannot be used for 1-minute intervals. This chart has been updated and modified multiple times, and it has a significant alerting effect in actual backtesting; however, it is mainly for reference and should not be used as the primary indicator. The code is somewhat complex, so please suggest improvements if there are any. The core uses the 20, 50, and 200 EMA periods as references, with the aim of identifying the direction indicators across multiple periods and timeframes. Note: This indicator is recommended only for directional reference and not for main indicator trading.