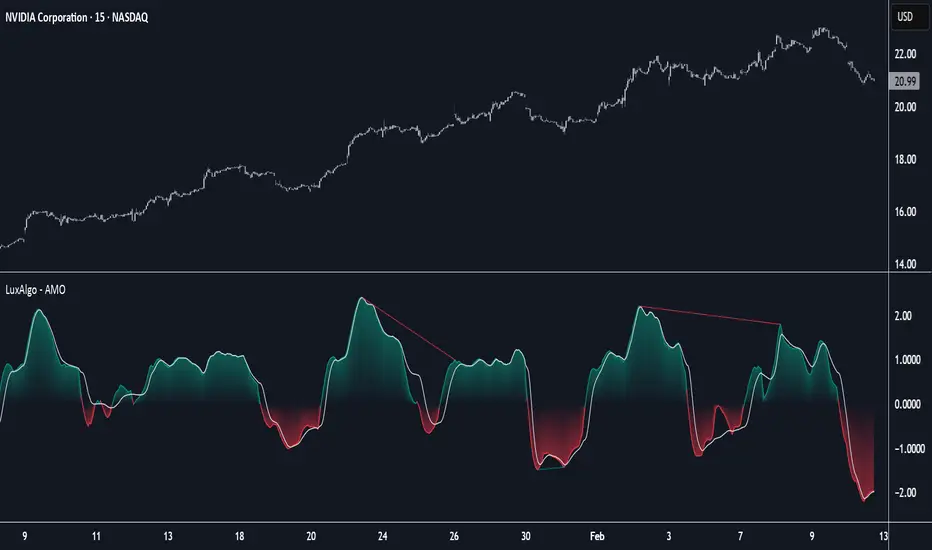
Adaptive Momentum Oscillator [LuxAlgo]The Adaptive Momentum Oscillator tool allows traders to measure the current relative momentum over a given period using the maximum delta in price.
It features a histogram with gradient color, divergences, and an adaptive moving average that allows traders to clearly see the smoothed trend direction.
🔶 USAGE
This unbounded oscillator has positive momentum when values are above 0 and negative momentum when values are below 0. The adaptive moving average is used as a minimum lag smoothing tool over the momentum histogram.
🔹 Signal Line
There are two main uses for the signal line drawn on the chart above.
Momentum crosses above or below the signal line: acceleration in momentum.
Signal line crosses the 0 value: positive or negative momentum.
🔹 Data Length
On the chart above, we can compare different length sizes and how the tool values change, allowing traders to get a shorter or longer-term view of current market strength.
🔹 Smoothing Length
In the previous figure, we can compare how different Smoothing Length values affect the oscillator output.
🔹 Divergences
The divergence detector is disabled by default. Traders can enable it and adjust the divergence length from the settings panel.
As we can see in the chart above, by changing the length of the divergences, traders can fine-tune their detection, a small number will detect smaller divergences, and use a larger number for larger divergences.
🔶 SETTINGS
Data: Select data source, close price by default
Data Length: Select the length for data gathering
Smoothing Length: Select the length for data smoothing
Divergences: Enable/Disable divergences detection and length
Indicators and strategies
Camarilla Pivot Plays█ OVERVIEW
This indicator implements the Camarilla Pivot Points levels and a system for suggesting particular plays. It only calculates and shows the 3rd, 4th, and 6th levels, as these are the only ones used by the system. In total, there are 12 possible plays, grouped into two groups of six. The algorithm constantly evaluates conditions for entering and exiting the plays and indicates them in real time, also triggering user-configurable alerts.
█ CREDITS
The Camarilla pivot plays are defined in a strategy developed by Thor Young, and the whole system is explained in his book "A Complete Day Trading System" . The indicator is published with his permission, and he is a user of it. The book is not necessary in order to understand and use the indicator; this description contains sufficient information to use it effectively.
█ FEATURES
Automatically draws plays, suggesting an entry, stop-loss, and maximum target
User can set alerts on chosen ticker to call these plays, even when not currently viewing them
Highly configurable via many options
Works for US/European stocks and US futures (at least)
Works correctly on both RTH and ETH charts
Automatically switches between RTH and ETH data
Optionally also shows the "other" set of pivots (RTH vs ETH data)
Configurable behaviour in the pre-market, not active in the post-market
Configurable sensitivity of the play detection algorithm
Can also show weekly and monthly Camarilla pivots
Well-documented options tooltips
Sensible defaults which are suitable for immediate use
Well-documented and high-quality open-source code for those who are interested
█ HOW TO USE
The defaults work well; at a minimum, just add the indicator and watch the plays being called. To avoid having to watch securities, by selecting the three dots next to the indicator name, you can set an alert on the indicator and choose to be alerted on play entry or exit events—or both. The following diagram shows several plays activated in the past (with the "Show past plays" option selected).
By default, the indicator draws plays 5 days back; this can be changed up to 20 days. The labels can be shifted left/right using the "label offset" option to avoid overlapping with other labels in this indicator or those of another indicator.
An information box at the top-right of the chart shows:
The data currently in use for the main pivots. This can switch in the pre-market if the H/L range exceeds the previous day's H/L, and if it does, you will see that switch at the time that it happens
Whether the current day's pivots are in a higher or lower range compared to the previous day's. This is based on the RTH close, so large moves in the post-market won't be reflected (there is an advanced option to change this)
The width of the value relationship in the current day compared to the previous day
The currently active play. If multiple plays are active in parallel, only the last activated one is shown
The resistance pivots are all drawn in the same colour (red by default), as are the support pivots (green by default). You can change the resistance and support colours, but it is not possible to have different colours for different levels of the same kind. Plays will always use the correct colour, drawing over the pivots. For example, R4 is red by default, but if a play treats R4 as a support, then the play will draw a green line (by default) over the red R4 line, thereby hiding it while the play is active.
There are a few advanced parameters; leave these as default unless you really know what they do. Please note the script is complicated—it does a lot. You might need to wait a few seconds while it (re)calculates on new tickers or when changing options. Give it time when first loading or changing options!
█ CONCEPTS
The indicator is focused around daily Camarilla pivots and implements 12 possible plays: 6 when in a higher range, 6 when in a lower range. The plays are labelled by two letters—the first indicates the range, the second indicates the play—as shown in this diagram:
The pivots can be calculated using only RTH (Regular Trading Hours) data, or ETH (Extended Trading Hours) data, which includes the pre-market and post-market. The indicator implements logic to automatically choose the correct data, based on the rules defined by the strategy. This is user-overridable. With the default options, ETH will be used when the H/L range in the previous day's post-market or current day's pre-market exceeds that of the previous day's regular market. In auto mode, the chosen pivots are considered the main pivots for that day and are the ones used for play evaluation. The "other" pivots can also be shown—"other" here meaning using ETH data when the main pivots use RTH data, and vice versa.
When displaying plays in the pre-market, since the RTH open is not yet known (and that value is needed to evaluate play pre-conditions), the pre-market open is used as a proxy for the RTH open. After the regular market opens, the correct RTH open is used to evaluate play conditions.
█ NOTE FOR FUTURES
Futures always use full ETH data in auto mode. Users may, however, wish to use the option "Always use RTH close," which uses the 3 p.m. Central Time (CME/Chicago) as a basis for the close in the pivot calculations (instead of the 4 p.m. actual close).
Futures don't officially have a pre-market or post-market like equities. Let's take ES on CME as an example (CME is in Chicago, so all times are Central Time, i.e., 1 hour behind Eastern Time). It trades from 17:00 Sunday to 16:00 Friday, with a daily pause between 16:00 and 17:00. However, most of the trading activity is done between 08:30 and 15:00 (Central), which you can tell from the volume spikes at those times, and this coincides with NYSE/NASDAQ regular hours (09:30–16:00 Eastern). So we define a pseudo-pre-market from 17:00 the previous day to 08:30 on the current day, then a pseudo-regular market from 08:30 to 15:00, then a pseudo-post-market from 15:00 to 16:00.
The indicator then works exactly the same as with equities—all the options behave the same, just with different session times defined for the pre-, regular, and post-market, with "RTH" meaning just the regular market and "ETH" meaning all three. The only difference from equities is that the auto calculation mode always uses ETH instead of switching based on ETH range compared to RTH range. This is so users who just leave all the defaults are not confused by auto-switching of the calculation mode; normally you'll want the pivots based on all the (ETH) data. However, both "Force RTH" and "Use RTH close with ETH data" work the same as with equities—so if, in the calculations, you really want to only use RTH data, or use all ETH H/L data but use the RTH close (at 15:00), you can.
█ LIMITATIONS
The pivots are very close to those shown in DAS Trader Pro. They are not to-the-cent exact, but within a few cents. The reasons are:
TradingView uses real-time data from CBOE One, so doesn't have access to full exchange data (unless you pay for it in TradingView), and
the close/high/low are taken from the intraday timeframe you are currently viewing, not daily data—which are very close, but often not exactly the same. For example, the high on the daily timeframe may differ slightly from the daily high you'll see on an intraday timeframe.
I have occasionally seen larger than a few cents differences in the pivots between these and DAS Trader Pro—this is always due to differences in data, for example a big spike in the data in TradingView but not in DAS Trader Pro, or vice versa. The more traded the stock is, the less the difference tends to be. Highly traded stocks are usually within a few cents. Less traded stocks may be more (for example, 30¢ difference in R4 is the highest I've seen). If it bothers you, official NYSE/NASDAQ data in TradingView is quite inexpensive (but even that doesn't make the 8am candle identical).
The 6th Camarilla level does not have a standard definition and may not match the level shown on other platforms. It does match the definition used by DAS Trader Pro.
The indicator is an intraday indicator (despite also being able to show weekly and monthly pivots on an intraday chart). It deactivates on a daily timeframe and higher. It is untested on sub-minute timeframes; you may encounter runtime errors on these due to various historical data referencing issues. Also, the play detection algorithm would likely be unpredictable on sub-minute timeframes. Therefore, sub-minute timeframes are formally unsupported.
The indicator was developed and tested for US/European stocks and US futures. It may or may not work as intended for stocks and futures in different locations. It does not work for other security types (e.g., crypto), where I have no evidence that the strategy has any relevance.

Quarterly Theory ICT 05 [TradingFinder] Doubling Theory Signals🔵 Introduction
Doubling Theory is an advanced approach to price action and market structure analysis that uniquely combines time-based analysis with key Smart Money concepts such as SMT (Smart Money Technique), SSMT (Sequential SMT), Liquidity Sweep, and the Quarterly Theory ICT.
By leveraging fractal time structures and precisely identifying liquidity zones, this method aims to reveal institutional activity specifically smart money entry and exit points hidden within price movements.
At its core, the market is divided into two structural phases: Doubling 1 and Doubling 2. Each phase contains four quarters (Q1 through Q4), which follow the logic of the Quarterly Theory: Accumulation, Manipulation (Judas Swing), Distribution, and Continuation/Reversal.
These segments are anchored by the True Open, allowing for precise alignment with cyclical market behavior and providing a deeper structural interpretation of price action.
During Doubling 1, a Sequential SMT (SSMT) Divergence typically forms between two correlated assets. This time-structured divergence occurs between two swing points positioned in separate quarters (e.g., Q1 and Q2), where one asset breaks a significant low or high, while the second asset fails to confirm it. This lack of confirmation—especially when aligned with the Manipulation and Accumulation phases—often signals early smart money involvement.
Following this, the highest and lowest price points from Doubling 1 are designated as liquidity zones. As the market transitions into Doubling 2, it commonly returns to these zones in a calculated move known as a Liquidity Sweep—a sharp, engineered spike intended to trigger stop orders and pending positions. This sweep, often orchestrated by institutional players, facilitates entry into large positions with minimal slippage.
Bullish :
Bearish :
🔵 How to Use
Applying Doubling Theory requires a simultaneous understanding of temporal structure and inter-asset behavioral divergence. The method unfolds over two main phases—Doubling 1 and Doubling 2—each divided into four quarters (Q1 to Q4).
The first phase focuses on identifying a Sequential SMT (SSMT) divergence, which forms when two correlated assets (e.g., EURUSD and GBPUSD, or NQ and ES) react differently to key price levels across distinct quarters. For example, one asset may break a previous low while the other maintains structure. This misalignment—especially in Q2, the Manipulation phase—often indicates early smart money accumulation or distribution.
Once this divergence is observed, the extreme highs and lows of Doubling 1 are marked as liquidity zones. In Doubling 2, the market gravitates back toward these zones, executing a Liquidity Sweep.
This move is deliberate—designed to activate clustered stop-loss and pending orders and to exploit pockets of resting liquidity. These sweeps are typically driven by institutional forces looking to absorb liquidity and position themselves ahead of the next major price move.
The key to execution lies in the fact that, during the sweep in Doubling 2, a classic SMT divergence should also appear between the two assets. This indicates a weakening of the previous trend and adds an extra layer of confirmation.
🟣 Bullish Doubling Theory
In the bullish scenario, Doubling 1 begins with a bullish SSMT divergence, where one asset forms a lower low while the other maintains its structure. This divergence signals weakening bearish momentum and possible smart money accumulation. In Doubling 2, the market returns to the previous low and sweeps the liquidity zone—breaking below it on one asset, while the second fails to confirm, forming a bullish SMT divergence.
f this move is followed by a bullish PSP and a clear market structure break (MSB), a long entry is triggered. The stop-loss is placed just below the swept liquidity zone, while the target is set in the premium zone, anticipating a move driven by institutional buyers.
🟣 Bearish Doubling Theory
The bearish scenario follows the same structure in reverse. In Doubling 1, a bearish SSMT divergence occurs when one asset prints a higher high while the other fails to do so. This suggests distribution and weakening buying pressure. Then, in Doubling 2, the market returns to the previous high and executes a liquidity sweep, targeting trapped buyers.
A bearish SMT divergence appears, confirming the move, followed by a bearish PSP on the lower timeframe. A short position is initiated after a confirmed MSB, with the stop-loss placed
🔵 Settings
⚙️ Logical Settings
Quarterly Cycles Type : Select the time segmentation method for SMT analysis.
Available modes include : Yearly, Monthly, Weekly, Daily, 90 Minute, and Micro.
These define how the indicator divides market time into Q1–Q4 cycles.
Symbol : Choose the secondary asset to compare with the main chart asset (e.g., XAUUSD, US100, GBPUSD).
Pivot Period : Sets the sensitivity of the pivot detection algorithm. A smaller value increases responsiveness to price swings.
Pivot Sync Threshold : The maximum allowed difference (in bars) between pivots of the two assets for them to be compared.
Validity Pivot Length : Defines the time window (in bars) during which a divergence remains valid before it's considered outdated.
🎨 Display Settings
Show Cycle :Toggles the visual display of the current Quarter (Q1 to Q4) based on the selected time segmentation
Show Cycle Label : Shows the name (e.g., "Q2") of each detected Quarter on the chart.
Show Labels : Displays dynamic labels (e.g., “Q2”, “Bullish SMT”, “Sweep”) at relevant points.
Show Lines : Draws connection lines between key pivot or divergence points.
Color Settings : Allows customization of colors for bullish and bearish elements (lines, labels, and shapes)
🔔 Alert Settings
Alert Name : Custom name for the alert messages (used in TradingView’s alert system).
Message Frequenc y:
All : Every signal triggers an alert.
Once Per Bar : Alerts once per bar regardless of how many signals occur.
Per Bar Close : Only triggers when the bar closes and the signal still exists.
Time Zone Display : Choose the time zone in which alert timestamps are displayed (e.g., UTC).
Bullish SMT Divergence Alert : Enable/disable alerts specifically for bullish signals.
Bearish SMT Divergence Alert : Enable/disable alerts specifically for bearish signals
🔵 Conclusion
Doubling Theory is a powerful and structured framework within the realm of Smart Money Concepts and ICT methodology, enabling traders to detect high-probability reversal points with precision. By integrating SSMT, SMT, Liquidity Sweeps, and the Quarterly Theory into a unified system, this approach shifts the focus from reactive trading to anticipatory analysis—anchored in time, structure, and liquidity.
What makes Doubling Theory stand out is its logical synergy of time cycles, behavioral divergence, liquidity targeting, and institutional confirmation. In both bullish and bearish scenarios, it provides clearly defined entry and exit strategies, allowing traders to engage the market with confidence, controlled risk, and deeper insight into the mechanics of price manipulation and smart money footprints.

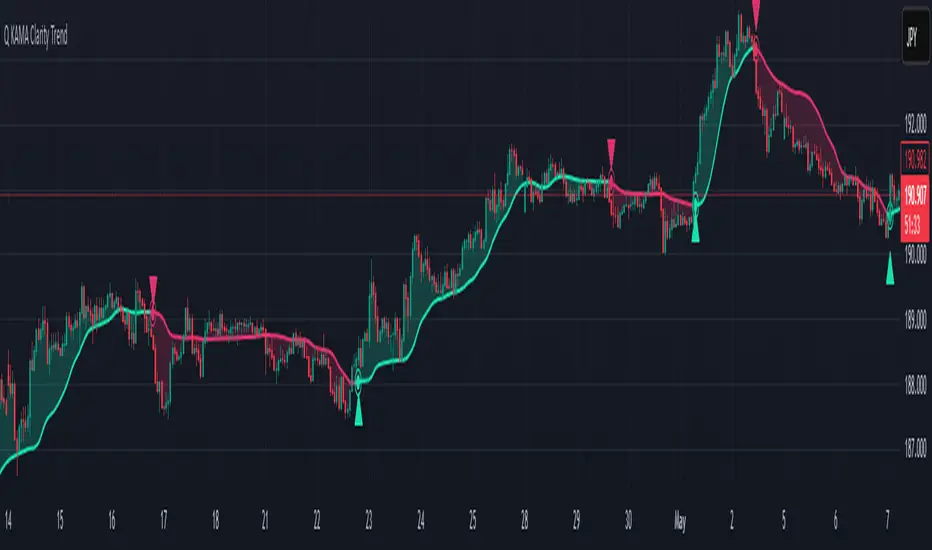
Q KAMA Clarity Trend Q KAMA Clarity Trend
A minimalistic yet versatile trend-following tool that combines **Kaufman’s Adaptive Moving Average (KAMA) with Gaussian smoothing and ATR-based breakout logic. Built for traders who value clarity, responsiveness, and visual simplicity.
🔧 Core Features
1. Adaptive KAMA Trend Line
• Dynamically adjusts to market volatility using Kaufman’s KAMA.
• Gaussian filter pre-smooths price to reduce noise before calculating KAMA.
2. Dual Trend Logic (toggle)
• Default: Trend shifts on price breakouts above/below KAMA ± ATR channel.
• Alternative: Faster signals based on price crossing KAMA directly.
3. Visual Feedback
• Auto-colored KAMA line based on trend direction (up/down/neutral).
• Arrows on trend reversals (up = green, down = red).
• Optional shadow fill below line for regime clarity.
• Optional dot marker ("⦿") on the KAMA line to show trend shifts.
4. Alerts
• Real-time alerts when a new uptrend or downtrend begins.
• Compatible with manual or automated strategies.
⚙️ Configurable Inputs
• Source: Price input (default: close)
• KAMA Length: Adjusts sensitivity (longer = smoother)
• ATR Length & Multiplier: Defines channel width for breakout detection
• Gaussian Filter (Length & Sigma): Controls smoothing strength
• Trend Logic Mode: ATR channel breakout vs. price-KAMA cross
• Style: Custom colors, background fill, marker visibility
📈 How to Use
• Follow trend arrows for directional confirmation
• Use ATR breakout mode for cleaner, filtered signals
• Switch to price-KAMA crossover mode for earlier entries
• Works well with structure, momentum, and volume confirmation
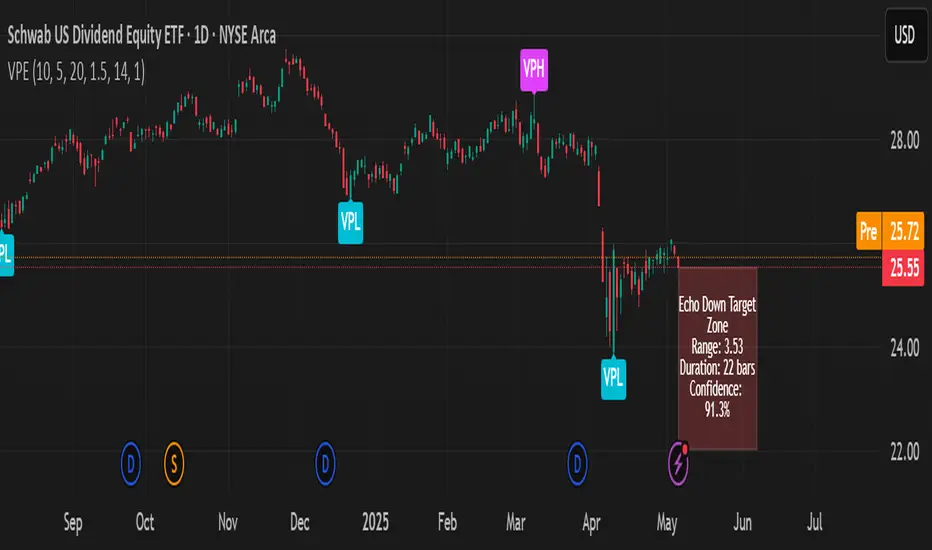
Volumetric Pivot Echo🔮 Volumetric Pivot Echo (VPE)
Future Price Projection Zones with Confidence Scoring
📘 Overview
The Volumetric Pivot Echo (VPE) is a next-generation leading indicator that identifies high-volume reversal points and echoes their price + time behavior into the future — giving you a visual forecast box that includes a confidence score, price range, and duration estimate.
It’s designed for swing and options traders who want forward guidance based on real structure, not just reactive signals.
⚙️ How It Works
Pivot Detection – Finds pivot highs/lows based on configurable bar structure.
Volume Confirmation – Only confirms pivots backed by strong volume (e.g., 1.5× average).
Echo Logic – Measures the price move and time it took to reach the pivot.
ATR Scaling – Adjusts projections based on current market volatility.
Confidence Score – Rates each projection (0–100%) based on structure match, volatility, and direction alignment.
📦 What Appears on Chart
Projection Box:
A forward-drawn rectangle from the current bar to the estimated future zone. The box's size and duration mirror the last valid momentum leg.
Box Label Text:
🔹 Range (projected move size)
⏱️ Duration (bars expected)
✅ Confidence %
VPH/VPL Markers:
Pivot highs and lows confirmed by volume, marked with “VPH” or “VPL”.
🎯 How to Trade with It
Use the box as a target zone for directional trades.
If price enters a box with >85% confidence, consider it a high-quality path projection.
Use with support/resistance confluence or entry systems.
Works especially well for swing trading, breakout setups, or options targeting.
🛠️ Recommended Settings
Box Transparency: Set Projection Up/Down Color to 90 (10% visible).
Text Color: Set to white for readability.
Volume Multiplier: Default 1.5x, increase in choppy markets.
Projection Duration: Start with 1.0x echo multiplier and fine-tune.
⏳ Timeframes & Accuracy
Timeframe Confidence Zones Most Reliable
15m – 1h Use 70–85% confidence scores
1h – 4h Sweet spot for balanced signals
1D – 1W Strongest historical echo tracking (>85% ideal)
✅ Key Features
Forward-looking, non-repainting logic
Clear visual projections — no guesswork
Confidence scoring built-in
ATR-adjusted — adapts to volatility
Works on any asset (stocks, crypto, FX)
🧠 Why It’s Unique
This is not a lagging oscillator or classic trend-following tool.
It’s a leading structure projection model — combining pivot behavior, volume intensity, and market volatility to sketch forward “echo zones” based on the past.
5 EMA Short Strategy (Uptrend Filter for 5-min)
Trend based 5 EMA short strategy.
Visualization is kept simple for better back testing and to avoid confirmation bias. It uses 20 EMA trending momentum to establish 5ema shorts. More restrictive and tighter specification.
Trend EMA length=20 day period
Short EMA length=5 day period
Disclaimer: I don't own this strategy only adding some script tweaks to what is publicly available to make it more restrictive and narrow. Feel free to credit the one who conceptualized it and I shall add their names as needed.

Advanced SMC
//@version=5
indicator("Advanced SMC", overlay = true, max_lines_count = 500, max_labels_count = 500, max_boxes_count = 500, max_bars_back = 1000)
//------------------------------------------------------------------------------
// Settings
//-----------------------------------------------------------------------------{
length = input.int(5, minval = 3)
//Colors
showBull = input(true, 'Bullish Structures', inline = 'bull', group = 'Style')
bullCss = input.color(#089981, '', inline = 'bull', group = 'Style')
showBear = input(true, 'Bearish Structures', inline = 'bear', group = 'Style')
bearCss = input.color(#f23645, '', inline = 'bear', group = 'Style')
showSupport = input(false, 'Support', inline = 's', group = 'Style')
supCss = input.color(#089981, '', inline = 's', group = 'Style')
showResistance = input(false, 'Resistance', inline = 'r', group = 'Style')
resCss = input.color(#f23645, '', inline = 'r', group = 'Style')
//Dashboard
showDash = input(false, 'Show Dashboard' , group = 'Dashboard')
dashLoc = input.string('Top Right', 'Location', options = , group = 'Dashboard')
textSize = input.string('Small', 'Size' , options = , group = 'Dashboard')
//-----------------------------------------------------------------------------}
//Types
//-----------------------------------------------------------------------------{
type fractal
float value
int loc
bool iscrossed
//-----------------------------------------------------------------------------}
//Fractal Detection
//-----------------------------------------------------------------------------{
var p = int(length/2)
n = bar_index
dh = math.sum(math.sign(high - high ), p)
dl = math.sum(math.sign(low - low ), p)
bullf = dh == -p and dh == p and high == ta.highest(length)
bearf = dl == p and dl == -p and low == ta.lowest(length)
bullf_count = ta.cum(bullf ? 1 : 0)
bearf_count = ta.cum(bearf ? 1 : 0)
//-----------------------------------------------------------------------------}
//Bullish market structure
//-----------------------------------------------------------------------------{
var upper = fractal.new()
var line lower_lvl = na
var label ms_lbl = na
var bull_ms_count = 0
var broken_sup = false
var os = 0
if bullf
upper.value := high
upper.loc := n-p
upper.iscrossed := false
if ta.crossover(close, upper.value) and not upper.iscrossed
line.new(upper.loc, upper.value, n, upper.value, color = showBull ? bullCss : na)
ms_lbl := label.new(int(math.avg(n, upper.loc)), upper.value, os == -1 ? 'ChoCH' : 'BOS'
, color = color(na)
, textcolor = showBull ? bullCss : na
, style = label.style_label_down
, size = size.tiny)
//Set support
k = 2
min = low
for i = 2 to (n - upper.loc)-1
min := math.min(low , min)
k := low == min ? i : k
if showSupport
lower_lvl := line.new(n-k, min, n, min, color = bullCss, style = line.style_dashed)
broken_sup := false
upper.iscrossed := true
bull_ms_count += 1
os := 1
else if showSupport and not broken_sup
lower_lvl.set_x2(n)
if close < lower_lvl.get_y2()
broken_sup := true
//-----------------------------------------------------------------------------}
//Bearish market structure
//-----------------------------------------------------------------------------{
var lower = fractal.new()
var line upper_lvl = na
var broken_res = false
var bear_ms_count = 0
if bearf
lower.value := low
lower.loc := n-p
lower.iscrossed := false
if ta.crossunder(close, lower.value) and not lower.iscrossed
line.new(lower.loc, lower.value, n, lower.value, color = showBear ? bearCss : na)
label.new(int(math.avg(n, lower.loc)), lower.value, os == 1 ? 'ChoCH' : 'BOS'
, color = color(na)
, textcolor = showBear ? bearCss : na
, style = label.style_label_up
, size = size.tiny)
//Set resistance
k = 2
max = high
for i = 2 to (n - lower.loc)-1
max := math.max(high , max)
k := high == max ? i : k
if showResistance
upper_lvl := line.new(n-k, max, n, max, color = bearCss, style = line.style_dashed)
broken_res := false
lower.iscrossed := true
bear_ms_count += 1
os := -1
else if showResistance and not broken_res
upper_lvl.set_x2(n)
if close > upper_lvl.get_y2()
broken_res := true
//-----------------------------------------------------------------------------}
//Dashboard
//-----------------------------------------------------------------------------{
var table_position = dashLoc == 'Bottom Left' ? position.bottom_left
: dashLoc == 'Top Right' ? position.top_right
: position.bottom_right
var table_size = textSize == 'Tiny' ? size.tiny
: textSize == 'Small' ? size.small
: size.normal
var tb = table.new(table_position, 2, 3
, bgcolor = #1e222d
, border_color = #373a46
, border_width = 1
, frame_color = #373a46
, frame_width = 1)
if showDash
if barstate.isfirst
tb.cell(0, 0, 'Structure To Fractal %', text_color = color.white, text_size = table_size)
tb.merge_cells(0,0,1,0)
tb.cell(0, 1, 'Bullish', text_color = #089981, text_size = table_size)
tb.cell(1, 1, 'Bearish', text_color = #f23645, text_size = table_size)
if barstate.islast
tb.cell(0, 2, str.tostring(bull_ms_count / bullf_count * 100, format.percent), text_color = #089981, text_size = table_size)
tb.cell(1, 2, str.tostring(bear_ms_count / bearf_count * 100, format.percent), text_color = #f23645, text_size = table_size)
//-----------------------------------------------------------------------------}
//Plots
//-----------------------------------------------------------------------------{
plot(broken_res and not broken_res ? low : na, 'Resistance Breakout', #089981, 2, plot.style_circles)
plot(broken_sup and not broken_sup ? high : na, 'Support Breakout', #f23645, 2, plot.style_circles)
//-----------------------------------------------------------------------------}
numDays = input.int(7, "number of days lookback")
showUP = input.bool(true, "'UP' FVGs:", inline ='1')
colUp = input.color(color.new(#2195f3, 95), "", inline ='1')
showDN = input.bool(true, "'DOWN' FVGs:", inline ='2')
colDn = input.color(color.new(#ff9900, 95), "", inline ='2')
showCE = input.bool(true, "show CE", inline ='3')
ceCol = input.color(color.new(#363a45, 95), "| color:", inline ='3')
ceStyle = input.string(line.style_dotted, "| style:", options= , inline ='3')
deleteFilledBoxes = input.bool(true, "delete filled boxes & lines")
CEcond = input.bool (true, "Use CE (as opposed to Full Fill)", group = 'conditions/alerts', tooltip = "If toggled OFF, FVGs and CEs will paint until FVG has been completely filled. This threshold is used for Above/Below threshold Alert conditions too (but does not effect the IOFED alerts): i.e. this will determine if your 'ABOVE threshold' alert fires when price hits latest active FVG CE ABOVE or latest active FVG Full Fill ABOVE Alerts are set by clicking the three dots on the indicator display line.")
colorNone = color.new(color.white, 100)
_day = 24*3600*1000
var box bxUp = na, var box bxDn = na, var line lnUp = na, var line lnDn = na
var array bxUpArr = array.new(0), var array lnUpArr = array.new(0)
var array bxDnArr = array.new(0), var array lnDnArr = array.new(0)
dnCE = high + (low -high )/2
upCE = low - (low -high )/2
if low > high and time> timenow- numDays*_day and showDN
bxDnArr.push(box.new(bar_index-3, low , bar_index, high , bgcolor = colDn, border_color = colorNone))
lnDnArr.push(line.new(bar_index-3, dnCE, bar_index, dnCE, color = showCE?ceCol:colorNone, style =ceStyle))
if high < low and time> timenow- numDays*_day and showUP
bxUpArr.push(box.new(bar_index-3, low , bar_index, high , bgcolor = colUp, border_color = colorNone))
lnUpArr.push(line.new(bar_index-3, upCE, bar_index, upCE, color = showCE?ceCol:colorNone, style =ceStyle))
var array _countArr =array.new(0)
var array _countArrIOFED =array.new(0)
//modified form of @Bjorgum's looping function. This stops boxes/lines painting when price passes to or through them
extendAndRemoveBx(array boxArray, array lineArray, array countArr1, array countArr2, simple bool isBull, int maxSize) =>
if boxArray.size() > 0
for i = boxArray.size() -1 to 0
line ln = lineArray.get(i)
box bx = boxArray.get(i)
bx.set_right(bar_index)
ln.set_x2(bar_index)
float price = CEcond?ln.get_price(bar_index):(isBull?bx.get_top():bx.get_bottom())
float price_IOFED = isBull?bx.get_bottom():bx.get_top()
int m = isBull ? 1 : -1
float hiLo = isBull ? high : low
if hiLo * m > price * m
boxArray.remove(i)
lineArray.remove(i)
countArr1.push(isBull?1:-1) //for 'above/below threshold alerts; counter sum will decrement 1 on lower threshold hit, increment 1 on upper threshold hit
if deleteFilledBoxes
bx.set_bgcolor(colorNone)
ln.set_color(colorNone)
if hiLo*m>price_IOFED*m
countArr2.push(isBull?1:-1)
if boxArray.size() > maxSize
box.delete(boxArray.shift())
line.delete(lineArray.shift())
extendAndRemoveBx(bxDnArr,lnDnArr,_countArr,_countArrIOFED, true, 12) //12 should be good for around 2200 bars of history
extendAndRemoveBx(bxUpArr, lnUpArr,_countArr,_countArrIOFED, false, 12)
upThresholdLst = array.sum(_countArr)>array.sum(_countArr)
dnThresholdLst = array.sum(_countArr)array.sum(_countArrIOFED)
dnIOFEDlast= array.sum(_countArrIOFED) nz(xATRTrailingStop , 0) ? src - nLoss : src + nLoss
iff_2 = src < nz(xATRTrailingStop , 0) and src < nz(xATRTrailingStop , 0) ? math.min(nz(xATRTrailingStop ), src + nLoss) : iff_1
xATRTrailingStop := src > nz(xATRTrailingStop , 0) and src > nz(xATRTrailingStop , 0) ? math.max(nz(xATRTrailingStop ), src - nLoss) : iff_2
pos = 0
iff_3 = src > nz(xATRTrailingStop , 0) and src < nz(xATRTrailingStop , 0) ? -1 : nz(pos , 0)
pos := src < nz(xATRTrailingStop , 0) and src > nz(xATRTrailingStop , 0) ? 1 : iff_3
xcolor = pos == -1 ? color.red : pos == 1 ? color.green : color.blue
ema = ta.ema(src, 1)
above = ta.crossover(ema, xATRTrailingStop)
below = ta.crossover(xATRTrailingStop, ema)
buy = src > xATRTrailingStop and above
sell = src < xATRTrailingStop and below
barbuy = src > xATRTrailingStop
barsell = src < xATRTrailingStop
plotshape(buy, title='Buy', text='Buy', style=shape.labelup, location=location.belowbar, color=color.new(color.green, 0), textcolor=color.new(color.white, 0), size=size.tiny)
plotshape(sell, title='Sell', text='Sell', style=shape.labeldown, location=location.abovebar, color=color.new(color.red, 0), textcolor=color.new(color.white, 0), size=size.tiny)
barcolor(barbuy ? color.green : na)
barcolor(barsell ? color.red : na)
alertcondition(buy, 'UT Long', 'UT Long')
alertcondition(sell, 'UT Short', 'UT Short')
//------------------------------------------------------------------------------
//Settings
//-----------------------------------------------------------------------------{
bullCss1 = input.color(color.teal, 'FVG Level' , inline = 'bull')
bullAreaCss = input.color(color.new(color.teal, 50), 'Area' , inline = 'bull')
bullMitigatedCss = input.color(color.new(color.teal, 80), 'Mitigated', inline = 'bull')
bearCss1 = input.color(color.red, 'FVG Level' , inline = 'bear')
bearAreaCss = input.color(color.new(color.red, 50), 'Area' , inline = 'bear')
bearMitigatedCss = input.color(color.new(color.red, 80), 'Mitigated' , inline = 'bear')
//-----------------------------------------------------------------------------}
//UDT's
//-----------------------------------------------------------------------------{
type fvg
float top
float btm
bool mitigated
bool isnew
bool isbull
line lvl
box area
type session_range
line max
line min
//-----------------------------------------------------------------------------}
//Methods
//-----------------------------------------------------------------------------{
nl = bar_index
//Method for setting fair value gaps
method set_fvg(fvg id, offset, bg_css, l_css)=>
avg = math.avg(id.top, id.btm)
area = box.new(nl - offset, id.top, nl, id.btm, na, bgcolor = bg_css)
avg_l = line.new(nl - offset, avg, nl, avg, color = l_css, style = line.style_dashed)
id.lvl := avg_l
id.area := area
//Method for setting session range maximum/minimum
method set_range(session_range id)=>
max = math.max(high, id.max.get_y2())
min = math.min(low, id.min.get_y2())
id.max.set_xy2(nl, max)
id.max.set_y1(max)
id.min.set_xy2(nl, min)
id.min.set_y1(min)
//-----------------------------------------------------------------------------}
//Variables
//-----------------------------------------------------------------------------{
var chartCss = color.new(chart.fg_color, 50)
var fvg sfvg = fvg.new(na, na, na, true, na)
var session_range sesr = na
var box area = na
var line avg = na
bull_fvg = low > high and close > high
bear_fvg = high < low and close < low
//Alert conditions
bull_isnew = false
bear_isnew = false
bull_mitigated = false
bear_mitigated = false
within_bull_fvg = false
within_bear_fvg = false
//-----------------------------------------------------------------------------}
//New session
//-----------------------------------------------------------------------------{
dtf = timeframe.change('D')
//On new session
if dtf
//Set delimiter
line.new(nl, high + syminfo.mintick
, nl, low - syminfo.mintick
, color = chartCss
, style = line.style_dashed
, extend = extend.both)
//Set new range
sesr := session_range.new(
line.new(nl, high, nl, high, color = chartCss)
, line.new(nl, low, nl, low, color = chartCss))
sfvg.isnew := true
//Set prior session fvg right coordinates
if not na(sfvg.lvl)
sfvg.lvl.set_x2(nl-2)
sfvg.area.set_right(nl-2)
//Set range
else if not na(sesr)
sesr.set_range()
//Set range lines color
sesr.max.set_color(sfvg.isbull ? bullCss1 : bearCss1)
sesr.min.set_color(sfvg.isbull ? bullCss1 : bearCss1)
//-----------------------------------------------------------------------------}
//Set FVG
//-----------------------------------------------------------------------------{
//New session bullish fvg
if bull_fvg and sfvg.isnew
sfvg := fvg.new(low, high , false, false, true)
sfvg.set_fvg(2, bullAreaCss, bullCss1)
bull_isnew := true
//New session bearish fvg
else if bear_fvg and sfvg.isnew
sfvg := fvg.new(low , high, false, false, false)
sfvg.set_fvg(2, bearAreaCss, bearCss1)
bear_isnew := true
//Change object transparencies if mitigated
if not sfvg.mitigated
//If session fvg is bullish
if sfvg.isbull and close < sfvg.btm
sfvg.set_fvg(1, bullMitigatedCss, bullCss1)
sfvg.mitigated := true
bull_mitigated := true
//If session fvg is bearish
else if not sfvg.isbull and close > sfvg.top
sfvg.set_fvg(1, bearMitigatedCss, bearCss1)
sfvg.mitigated := true
bear_mitigated := true
//Set fvg right coordinates to current bar
if not sfvg.isnew
sfvg.lvl.set_x2(nl)
sfvg.area.set_right(nl)
//-----------------------------------------------------------------------------}
//Alerts
//-----------------------------------------------------------------------------{
//On new session fvg
alertcondition(bull_isnew, 'Bullish FVG', 'New session bullish fvg')
alertcondition(bear_isnew, 'Bearish FVG', 'New session bearish fvg')
//On fvg mitigation
alertcondition(bull_mitigated, 'Mitigated Bullish FVG', 'Session bullish fvg has been mitigated')
alertcondition(bear_mitigated, 'Mitigated Bearish FVG', 'Session bearish fvg has been mitigated')
//If within fvg
alertcondition(close >= sfvg.btm and close <= sfvg.top and sfvg.isbull and not sfvg.isnew
, 'Price Within Bullish FVG'
, 'Price is within bullish fvg')
alertcondition(close >= sfvg.btm and close <= sfvg.top and not sfvg.isbull and not sfvg.isnew
, 'Price Within Bearish FVG'
, 'Price is within bearish fvg')
//On fvg average cross
alertcondition(ta.cross(close, math.avg(sfvg.top, sfvg.btm)) and sfvg.isbull and not sfvg.isnew
, 'Bullish FVG AVG Cross'
, 'Price crossed bullish fvg average')
alertcondition(ta.cross(close, math.avg(sfvg.top, sfvg.btm)) and not sfvg.isbull and not sfvg.isnew
, 'Bearish FVG AVG Cross'
, 'Price crossed bearish fvg average')
//-----------------------------------------------------------------------------}
//INPUTS
cooldownPeriod = input.int(10,title="Cooldown Period", minval=0, group = "Settings")
lbLeft = 20
lbRight = 20
showSwing = input.bool(true,title="Show Swings?", inline="s_1", group = 'Swing Detaction')
swingClr = input.color(color.new(color.orange, 0), title='', inline="s_1", group = 'Swing Detaction')
bullWidth = input.int(1, title='Line Width:', group='Bullish Sweep')
bullStyle = input.string('Dashed', title='Line Style:', options= , group='Bullish Sweep')
bullColor = input.color(color.new(color.teal, 0), title='Bullish Color:', group='Bullish Sweep')
bearWidth = input.int(1, title='Line Width:', group='Bearish Sweep')
bearStyle = input.string('Dashed', title='Line Style:', options= , group='Bearish Sweep')
bearColor = input.color(color.new(color.maroon, 0), title='Bearish Color:', group='Bearish Sweep')
//FUNCTIONS
lineStyle(s) =>
if s == 'Solid'
line.style_solid
else if s == 'Dotted'
line.style_dotted
else
line.style_dashed
//VARS
var int bullSignalIndex = 0
var int bearSignalIndex = 0
var line bullLine = na
var line bearLine = na
var line highLine = na
var line lowLine = na
var label swingHighLbl = na
var label swingLowLbl = na
var label swingHighLblTxt = na
var label swingLowLblTxt = na
var float swingLowVal = na
var float swingHighVal = na
//CALCULATIONS
pLow = ta.pivotlow(low, lbLeft, lbRight)
pHigh = ta.pivothigh(high, lbLeft, lbRight)
pLowVal = ta.valuewhen(not na(pLow), low , 0)
pHighVal = ta.valuewhen(not na(pHigh), high , 0)
prevLowIndex = ta.valuewhen(not na(pLow), bar_index , 0)
prevHighIndex = ta.valuewhen(not na(pHigh), bar_index , 0)
lp = ta.lowest(low, lbLeft)
hp = ta.highest(high, lbLeft)
highestClose = ta.highest(close, lbLeft)
lowestClose = ta.lowest(close, lbLeft)
bullishSFP = low < pLowVal and close > pLowVal and open > pLowVal and low == lp and lowestClose >= pLowVal
bearishSFP = high > pHighVal and close < pHighVal and open < pHighVal and high == hp and highestClose <= pHighVal
bullCond = bullishSFP and (close > pLowVal) and (close > pLowVal ) and (close > pLowVal ) and bar_index >= bullSignalIndex + cooldownPeriod
bearCond = bearishSFP and (close < pHighVal) and (close < pHighVal ) and (close < pHighVal ) and bar_index >= bearSignalIndex + cooldownPeriod
//Check Swing H/L Stopper
var int swingLowCounter = 0
var int swingHighCounter = 0
var bool isSwingLowCheck = false
var bool isSwingHighCheck = false
var bool stopPrintingLow = false
var bool stopPrintingHigh = false
if high < swingLowVal and isSwingLowCheck
swingLowCounter := swingLowCounter+1
if low > swingHighVal and isSwingHighCheck
swingHighCounter := swingHighCounter+1
if ta.crossunder(close, swingLowVal) and isSwingLowCheck == false
isSwingLowCheck := true
swingLowCounter := 1
if ta.crossover(close, swingHighVal) and isSwingHighCheck == false
isSwingHighCheck := true
swingHighCounter := 1
if swingLowCounter == 5 and isSwingLowCheck
stopPrintingLow := true
isSwingLowCheck := false
line.set_x2(lowLine,bar_index )
if swingHighCounter == 5 and isSwingHighCheck
stopPrintingHigh := true
isSwingHighCheck := false
line.set_x2(highLine,bar_index )
//Draw sweep lines
if bullCond
bullSignalIndex := bar_index
bullLine := line.new(prevLowIndex, pLowVal, bar_index-3, pLowVal, color=bullColor, width=bullWidth, style=lineStyle(bullStyle))
if bearCond
bearSignalIndex := bar_index
bearLine := line.new(prevHighIndex, pHighVal, bar_index-3, pHighVal, color=bearColor, width=bearWidth, style=lineStyle(bearStyle))
var swingHighArr = array.new_label(0)
var swingHighTextArr = array.new_label(0)
var swingLowArr = array.new_label(0)
var swingLowTextArr = array.new_label(0)
if array.size(swingHighArr) >= 3
label.delete(array.shift(swingHighArr))
label.delete(array.shift(swingHighTextArr))
if array.size(swingLowArr) >= 3
label.delete(array.shift(swingLowArr))
label.delete(array.shift(swingLowTextArr))
//Draw range lines
if showSwing
if stopPrintingHigh == false
line.set_x2(highLine,bar_index+5)
if stopPrintingLow == false
line.set_x2(lowLine,bar_index+5)
if showSwing and not na(pHigh) and bearishSFP == false
stopPrintingHigh := false
swingHighVal := high
line.delete(highLine)
highLine := line.new(bar_index , high , bar_index+10, high , color = swingClr, width = 2)
swingHighLbl := label.new(bar_index , high , text="", yloc=yloc.abovebar, color = swingClr, textcolor = swingClr, style = label.style_triangledown, size = size.auto)
swingHighLblTxt := label.new(bar_index , high , text="Swing H", yloc=yloc.abovebar, color = swingClr, textcolor = swingClr, style = label.style_none, size = size.small)
array.push(swingHighArr, swingHighLbl)
array.push(swingHighTextArr, swingHighLblTxt)
if showSwing and not na(pLow) and bullishSFP == false
stopPrintingLow := false
swingLowVal := low
line.delete(lowLine)
lowLine := line.new(bar_index , low , bar_index+10, low , color = swingClr, width = 2)
swingLowLbl := label.new(bar_index , low , text="", yloc=yloc.belowbar, color = swingClr, textcolor = swingClr, style = label.style_triangleup, size = size.auto)
swingLowLblTxt := label.new(bar_index , low , text="Swing L", yloc=yloc.belowbar, color = swingClr, textcolor = swingClr, style = label.style_none, size = size.small)
array.push(swingLowArr, swingLowLbl)
array.push(swingLowTextArr, swingLowLblTxt)
//PLOTS
plotshape(bullCond, text='Sweep', color=bullColor, textcolor=bullColor, location=location.belowbar, offset = -3)
plotshape(bearCond, text='Sweep', color=bearColor, textcolor=bearColor, location=location.abovebar, offset = -3)
//ALERTS
alertcondition(bullishSFP, title='Bullish Sweep', message='{{ticker}} Bullish Sweep, Price:{{close}}')
alertcondition(bearishSFP, title='Bearish Sweep', message='{{ticker}} Bearish Sweep, Price:{{close}}')
//------------------------------------------------------------------------------
length1 = input(100)
extend = input(true,'Extend To Last Bar')
show_ext = input(true,'Show Extremities')
show_labels = input(true,'Show Labels')
//Style
upcol = input(#ff1100,'Upper Extremity Color',group='Style')
midcol = input(#ff5d00,'Zig Zag Color',group='Style')
dncol = input(#2157f3,'Lower Extremity Color',group='Style')
//------------------------------------------------------------------------------
//Settings
//-----------------------------------------------------------------------------{
liqGrp = 'Liquidity Detection'
liqLen = input.int (7, title = 'Detection Length', minval = 3, maxval = 13, inline = 'LIQ', group = liqGrp)
liqMar = 10 / input.float (6.9, 'Margin', minval = 4, maxval = 9, step = 0.1, inline = 'LIQ', group = liqGrp)
liqBuy = input.bool (true, 'Buyside Liquidity Zones, Margin', inline = 'Buyside', group = liqGrp)
marBuy = input.float(2.3, '', minval = 1.5, maxval = 10, step = .1, inline = 'Buyside', group = liqGrp)
cLIQ_B = input.color (color.new(#4caf50, 0), '', inline = 'Buyside', group = liqGrp)
liqSel = input.bool (true, 'Sellside Liquidity Zones, Margin', inline = 'Sellside', group = liqGrp)
marSel = input.float(2.3, '', minval = 1.5, maxval = 10, step = .1, inline = 'Sellside', group = liqGrp)
cLIQ_S = input.color (color.new(#f23645, 0), '', inline = 'Sellside', group = liqGrp)
lqVoid = input.bool (false, 'Liquidity Voids, Bullish', inline = 'void', group = liqGrp)
cLQV_B = input.color (color.new(#4caf50, 0), '', inline = 'void', group = liqGrp)
cLQV_S = input.color (color.new(#f23645, 0), 'Bearish', inline = 'void', group = liqGrp)
lqText = input.bool (false, 'Label', inline = 'void', group = liqGrp)
mode = input.string('Present', title = 'Mode', options = , inline = 'MOD', group = liqGrp)
visLiq = input.int (3, ' # Visible Levels', minval = 1, maxval = 50, inline = 'MOD', group = liqGrp)
//-----------------------------------------------------------------------------}
//General Calculations
//-----------------------------------------------------------------------------{
maxSize = 50
atr = ta.atr(10)
atr200 = ta.atr(200)
per = mode == 'Present' ? last_bar_index - bar_index <= 500 : true
//-----------------------------------------------------------------------------}
//User Defined Types
//-----------------------------------------------------------------------------{
// @type used to store pivot high/low data
//
// @field d (array) The array where the trend direction is to be maintained
// @field x (array) The array where the bar index value of pivot high/low is to be maintained
// @field y (array) The array where the price value of pivot high/low is to be maintained
type ZZ
int d
int x
float y
// @type bar properties with their values
//
// @field o (float) open price of the bar
// @field h (float) high price of the bar
// @field l (float) low price of the bar
// @field c (float) close price of the bar
// @field i (int) index of the bar
type bar
float o = open
float h = high
float l = low
float c = close
int i = bar_index
// @type liquidity object definition
//
// @field bx (box) box maitaing the liquity level margin extreme levels
// @field bxz (box) box maitaing the liquity zone margin extreme levels
// @field bxt (box) box maitaing the labels
// @field brZ (bool) mainains broken zone status
// @field brL (bool) mainains broken level status
// @field ln (line) maitaing the liquity level line
// @field lne (line) maitaing the liquity extended level line
type liq
box bx
box bxz
box bxt
bool brZ
bool brL
line ln
line lne
//-----------------------------------------------------------------------------}
//Variables
//-----------------------------------------------------------------------------{
var ZZ aZZ = ZZ.new(
array.new (maxSize, 0),
array.new (maxSize, 0),
array.new (maxSize, na)
)
bar b = bar.new()
var liq b_liq_B = array.new (1, liq.new(box(na), box(na), box(na), false, false, line(na), line(na)))
var liq b_liq_S = array.new (1, liq.new(box(na), box(na), box(na), false, false, line(na), line(na)))
var b_liq_V = array.new_box()
var int dir = na, var int x1 = na, var float y1 = na, var int x2 = na, var float y2 = na
//-----------------------------------------------------------------------------}
//Functions/methods
//-----------------------------------------------------------------------------{
// @function maintains arrays
// it prepends a `value` to the arrays and removes their oldest element at last position
// @param aZZ (UDT, array, array>) The UDT obejct of arrays
// @param _d (array) The array where the trend direction is maintained
// @param _x (array) The array where the bar index value of pivot high/low is maintained
// @param _y (array) The array where the price value of pivot high/low is maintained
//
// @returns none
method in_out(ZZ aZZ, int _d, int _x, float _y) =>
aZZ.d.unshift(_d), aZZ.x.unshift(_x), aZZ.y.unshift(_y), aZZ.d.pop(), aZZ.x.pop(), aZZ.y.pop()
// @function (build-in) sets the maximum number of bars that is available for historical reference
max_bars_back(time, 1000)
//-----------------------------------------------------------------------------}
//Calculations
//-----------------------------------------------------------------------------{
x2 := b.i - 1
ph = ta.pivothigh(liqLen, 1)
pl = ta.pivotlow (liqLen, 1)
if ph
dir := aZZ.d.get(0)
x1 := aZZ.x.get(0)
y1 := aZZ.y.get(0)
y2 := nz(b.h )
if dir < 1
aZZ.in_out(1, x2, y2)
else
if dir == 1 and ph > y1
aZZ.x.set(0, x2), aZZ.y.set(0, y2)
if per
count = 0
st_P = 0.
st_B = 0
minP = 0.
maxP = 10e6
for i = 0 to maxSize - 1
if aZZ.d.get(i) == 1
if aZZ.y.get(i) > ph + (atr / liqMar)
break
else
if aZZ.y.get(i) > ph - (atr / liqMar) and aZZ.y.get(i) < ph + (atr / liqMar)
count += 1
st_B := aZZ.x.get(i)
st_P := aZZ.y.get(i)
if aZZ.y.get(i) > minP
minP := aZZ.y.get(i)
if aZZ.y.get(i) < maxP
maxP := aZZ.y.get(i)
if count > 2
getB = b_liq_B.get(0)
if st_B == getB.bx.get_left()
getB.bx.set_top(math.avg(minP, maxP) + (atr / liqMar))
getB.bx.set_rightbottom(b.i + 10, math.avg(minP, maxP) - (atr / liqMar))
else
b_liq_B.unshift(
liq.new(
box.new(st_B, math.avg(minP, maxP) + (atr / liqMar), b.i + 10, math.avg(minP, maxP) - (atr / liqMar), bgcolor=color(na), border_color=color(na)),
box.new(na, na, na, na, bgcolor = color(na), border_color = color(na)),
box.new(st_B, st_P, b.i + 10, st_P, text = 'Buyside liquidity', text_size = size.tiny, text_halign = text.align_left, text_valign = text.align_bottom, text_color = color.new(cLIQ_B, 25), bgcolor = color(na), border_color = color(na)),
false,
false,
line.new(st_B , st_P, b.i - 1, st_P, color = color.new(cLIQ_B, 0)),
line.new(b.i - 1, st_P, na , st_P, color = color.new(cLIQ_B, 0), style = line.style_dotted))
)
alert('buyside liquidity level detected/updated for ' + syminfo.ticker)
if b_liq_B.size() > visLiq
getLast = b_liq_B.pop()
getLast.bx.delete()
getLast.bxz.delete()
getLast.bxt.delete()
getLast.ln.delete()
getLast.lne.delete()
if pl
dir := aZZ.d.get (0)
x1 := aZZ.x.get (0)
y1 := aZZ.y.get (0)
y2 := nz(b.l )
if dir > -1
aZZ.in_out(-1, x2, y2)
else
if dir == -1 and pl < y1
aZZ.x.set(0, x2), aZZ.y.set(0, y2)
if per
count = 0
st_P = 0.
st_B = 0
minP = 0.
maxP = 10e6
for i = 0 to maxSize - 1
if aZZ.d.get(i) == -1
if aZZ.y.get(i) < pl - (atr / liqMar)
break
else
if aZZ.y.get(i) > pl - (atr / liqMar) and aZZ.y.get(i) < pl + (atr / liqMar)
count += 1
st_B := aZZ.x.get(i)
st_P := aZZ.y.get(i)
if aZZ.y.get(i) > minP
minP := aZZ.y.get(i)
if aZZ.y.get(i) < maxP
maxP := aZZ.y.get(i)
if count > 2
getB = b_liq_S.get(0)
if st_B == getB.bx.get_left()
getB.bx.set_top(math.avg(minP, maxP) + (atr / liqMar))
getB.bx.set_rightbottom(b.i + 10, math.avg(minP, maxP) - (atr / liqMar))
else
b_liq_S.unshift(
liq.new(
box.new(st_B, math.avg(minP, maxP) + (atr / liqMar), b.i + 10, math.avg(minP, maxP) - (atr / liqMar), bgcolor=color(na), border_color=color(na)),
box.new(na, na, na, na, bgcolor=color(na), border_color=color(na)),
box.new(st_B, st_P, b.i + 10, st_P, text = 'Sellside liquidity', text_size = size.tiny, text_halign = text.align_left, text_valign = text.align_top, text_color = color.new(cLIQ_S, 25), bgcolor=color(na), border_color=color(na)),
false,
false,
line.new(st_B , st_P, b.i - 1, st_P, color = color.new(cLIQ_S, 0)),
line.new(b.i - 1, st_P, na , st_P, color = color.new(cLIQ_S, 0), style = line.style_dotted))
)
alert('sellside liquidity level detected/updated for ' + syminfo.ticker)
if b_liq_S.size() > visLiq
getLast = b_liq_S.pop()
getLast.bx.delete()
getLast.bxz.delete()
getLast.bxt.delete()
getLast.ln.delete()
getLast.lne.delete()
for i = 0 to b_liq_B.size() - 1
x = b_liq_B.get(i)
if not x.brL
x.lne.set_x2(b.i)
if b.h > x.bx.get_top()
x.brL := true
x.brZ := true
alert('buyside liquidity level breached for ' + syminfo.ticker)
x.bxz.set_lefttop(b.i - 1, math.min(x.ln.get_y1() + marBuy * (atr), b.h))
x.bxz.set_rightbottom(b.i + 1, x.ln.get_y1())
x.bxz.set_bgcolor(color.new(cLIQ_B, liqBuy ? 73 : 100))
else if x.brZ
if b.l > x.ln.get_y1() - marBuy * (atr) and b.h < x.ln.get_y1() + marBuy * (atr)
x.bxz.set_right(b.i + 1)
x.bxz.set_top(math.max(b.h, x.bxz.get_top()))
if liqBuy
x.lne.set_x2(b.i + 1)
else
x.brZ := false
for i = 0 to b_liq_S.size() - 1
x = b_liq_S.get(i)
if not x.brL
x.lne.set_x2(b.i)
if b.l < x.bx.get_bottom()
x.brL := true
x.brZ := true
alert('sellside liquidity level breached for ' + syminfo.ticker)
x.bxz.set_lefttop(b.i - 1, x.ln.get_y1())
x.bxz.set_rightbottom(b.i + 1, math.max(x.ln.get_y1() - marSel * (atr), b.l))
x.bxz.set_bgcolor(color.new(cLIQ_S, liqSel ? 73 : 100))
else if x.brZ
if b.l > x.ln.get_y1() - marSel * (atr) and b.h < x.ln.get_y1() + marSel * (atr)
x.bxz.set_rightbottom(b.i + 1, math.min(b.l, x.bxz.get_bottom()))
if liqSel
x.lne.set_x2(b.i + 1)
else
x.brZ := false
if lqVoid and per
bull = b.l - b.h > atr200 and b.l > b.h and b.c > b.h
bear = b.l - b.h > atr200 and b.h < b.l and b.c < b.l
if bull
l = 13
if bull
st = math.abs(b.l - b.l ) / l
for i = 0 to l - 1
array.push(b_liq_V, box.new(b.i - 2, b.l + i * st, b.i, b.l + (i + 1) * st, border_color = na, bgcolor = color.new(cLQV_B, 90) ))
else
st = math.abs(b.l - b.h ) / l
for i = 0 to l - 1
if lqText and i == 0
array.push(b_liq_V, box.new(b.i - 2, b.h + i * st, b.i, b.h + (i + 1) * st, text = 'Liquidity Void ', text_size = size.tiny, text_halign = text.align_right, text_valign = text.align_bottom, text_color = na, border_color = na, bgcolor = color.new(cLQV_B, 90) ))
else
array.push(b_liq_V, box.new(b.i - 2, b.h + i * st, b.i, b.h + (i + 1) * st, border_color = na, bgcolor = color.new(cLQV_B, 90) ))
if bear
l = 13
if bear
st = math.abs(b.h - b.h) / l
for i = 0 to l - 1
array.push(b_liq_V, box.new(b.i - 2, b.h + i * st, b.i, b.h + (i + 1) * st, border_color = na, bgcolor = color.new(cLQV_S, 90) ))
else
st = math.abs(b.l - b.h) / l
for i = 0 to l - 1
if lqText and i == l - 1
array.push(b_liq_V, box.new(b.i - 2, b.h + i * st, b.i, b.h + (i + 1) * st, text = 'Liquidity Void ', text_size = size.tiny, text_halign = text.align_right, text_valign = text.align_top, text_color = na, border_color = na, bgcolor = color.new(cLQV_S, 90) ))
else
array.push(b_liq_V, box.new(b.i - 2, b.h + i * st, b.i, b.h + (i + 1) * st, border_color = na, bgcolor = color.new(cLQV_S, 90) ))
if b_liq_V.size() > 0
qt = b_liq_V.size()
for bn = qt - 1 to 0
if bn < b_liq_V.size()
cb = b_liq_V.get(bn)
ba = math.avg(cb.get_bottom(), cb.get_top())
if math.sign(b.c - ba) != math.sign(b.c - ba) or math.sign(b.c - ba) != math.sign(b.l - ba) or math.sign(b.c - ba) != math.sign(b.h - ba)
b_liq_V.remove(bn)
else
cb.set_right(b.i + 1)
if b.i - cb.get_left() > 21
cb.set_text_color(color.new(color.gray, 25))
//-----------------------------------------------------------------------------}
C_Len = 14 // ta.ema depth for bodyAvg
C_ShadowPercent = 5.0 // size of shadows
C_ShadowEqualsPercent = 100.0
C_DojiBodyPercent = 5.0
C_Factor = 2.0 // shows the number of times the shadow dominates the candlestick body
C_BodyHi = math.max(close, open)
C_BodyLo = math.min(close, open)
C_Body = C_BodyHi - C_BodyLo
C_BodyAvg = ta.ema(C_Body, C_Len)
C_SmallBody = C_Body < C_BodyAvg
C_LongBody = C_Body > C_BodyAvg
C_UpShadow = high - C_BodyHi
C_DnShadow = C_BodyLo - low
C_HasUpShadow = C_UpShadow > C_ShadowPercent / 100 * C_Body
C_HasDnShadow = C_DnShadow > C_ShadowPercent / 100 * C_Body
C_WhiteBody = open < close
C_BlackBody = open > close
C_Range = high-low
C_IsInsideBar = C_BodyHi > C_BodyHi and C_BodyLo < C_BodyLo
C_BodyMiddle = C_Body / 2 + C_BodyLo
C_ShadowEquals = C_UpShadow == C_DnShadow or (math.abs(C_UpShadow - C_DnShadow) / C_DnShadow * 100) < C_ShadowEqualsPercent and (math.abs(C_DnShadow - C_UpShadow) / C_UpShadow * 100) < C_ShadowEqualsPercent
C_IsDojiBody = C_Range > 0 and C_Body <= C_Range * C_DojiBodyPercent / 100
C_Doji = C_IsDojiBody and C_ShadowEquals
patternLabelPosLow = low - (ta.atr(30) * 0.6)
patternLabelPosHigh = high + (ta.atr(30) * 0.6)
label_color_bearish = input(color.rgb(255, 82, 82, 90), "Label Color Bearish")
label_color_bullish = input(color.rgb(33, 149, 243, 90), "Label Color Bullish")
C_MarubozuBlackBearishNumberOfCandles = 1
C_MarubozuWhiteBullishNumberOfCandles = 1
C_MarubozuShadowPercentBearish = 5.0
C_MarubozuShadowPercentWhite = 5.0
C_MarubozuBlackBearish = C_BlackBody and C_LongBody and C_UpShadow <= C_MarubozuShadowPercentBearish/100*C_Body and C_DnShadow <= C_MarubozuShadowPercentBearish/100*C_Body and C_BlackBody
C_MarubozuWhiteBullish = C_WhiteBody and C_LongBody and C_UpShadow <= C_MarubozuShadowPercentWhite/100*C_Body and C_DnShadow <= C_MarubozuShadowPercentWhite/100*C_Body and C_WhiteBody
combined_alert_condition = C_MarubozuBlackBearish or C_MarubozuWhiteBullish
alertcondition(combined_alert_condition, title = "Marubozu Pattern Detected", message = "A Marubozu pattern has been detected!")
if C_MarubozuBlackBearish
var ttBearishMarubozuBlack = "Marubozu Black This is a candlestick that has no shadow, which extends from the red-bodied candle at the open, the close, or even at both. In Japanese, the name means “close-cropped” or “close-cut.” The candlestick can also be referred to as Bald or Shaven Head."
label.new(bar_index, patternLabelPosHigh, text="MB", style=label.style_label_down, color = label_color_bearish, textcolor=color.white, tooltip = ttBearishMarubozuBlack)
if C_MarubozuWhiteBullish
var ttBullishMarubozuWhite = "Marubozu White A Marubozu White Candle is a candlestick that does not have a shadow that extends from its candle body at either the open or the close. Marubozu is Japanese for “close-cropped” or “close-cut.” Other sources may call it a Bald or Shaven Head Candle."
label.new(bar_index, patternLabelPosLow, text="MW", style=label.style_label_up, color = label_color_bullish, textcolor=color.white, tooltip = ttBullishMarubozuWhite)
//--------------//
C_DownTrend = true
C_UpTrend = true
var trendRule1 = "SMA50"
var trendRule2 = "SMA50, SMA200"
var trendRule = input.string(trendRule1, "Detect Trend Based On", options= )
if trendRule == trendRule1
priceAvg = ta.sma(close, 50)
C_DownTrend := close < priceAvg
C_UpTrend := close > priceAvg
if trendRule == trendRule2
sma200 = ta.sma(close, 200)
sma50 = ta.sma(close, 50)
C_DownTrend := close < sma50 and sma50 < sma200
C_UpTrend := close > sma50 and sma50 > sma200
C_EngulfingBullishNumberOfCandles = 2
C_EngulfingBullish = C_DownTrend and C_WhiteBody and C_LongBody and C_BlackBody and C_SmallBody and close >= open and open <= close and ( close > open or open < close )
alertcondition(C_EngulfingBullish, title = "New pattern detected", message = "New Engulfing – Bullish pattern detected")
if C_EngulfingBullish
var ttBullishEngulfing = "Engulfing At the end of a given downward trend, there will most likely be a reversal pattern. To distinguish the first day, this candlestick pattern uses a small body, followed by a day where the candle body fully overtakes the body from the day before, and closes in the trend’s opposite direction. Although similar to the outside reversal chart pattern, it is not essential for this pattern to completely overtake the range (high to low), rather only the open and the close."
label.new(bar_index, patternLabelPosLow, text="BE", style=label.style_label_up, color = label_color_bullish, textcolor=color.white, tooltip = ttBullishEngulfing)
C_EngulfingBearishNumberOfCandles = 2
C_EngulfingBearish = C_UpTrend and C_BlackBody and C_LongBody and C_WhiteBody and C_SmallBody and close <= open and open >= close and ( close < open or open > close )
alertcondition(C_EngulfingBearish, title = "New pattern detected", message = "New Engulfing – Bearish pattern detected")
if C_EngulfingBearish
var ttBearishEngulfing = "Engulfing At the end of a given uptrend, a reversal pattern will most likely appear. During the first day, this candlestick pattern uses a small body. It is then followed by a day where the candle body fully overtakes the body from the day before it and closes in the trend’s opposite direction. Although similar to the outside reversal chart pattern, it is not essential for this pattern to fully overtake the range (high to low), rather only the open and the close."
label.new(bar_index, patternLabelPosHigh, text="BE", style=label.style_label_down, color = label_color_bearish, textcolor=color.white, tooltip = ttBearishEngulfing)
//--------------//
// EMA 20 50 200
//-----------------------------------------------------------------------------{
shortest = ta.ema(close, 20)
short = ta.ema(close, 50)
long = ta.ema(close, 200)
color c0 = color.new(color.orange, 50)
color c1 = color.new(color.red, 80)
color c2 = color.new(color.blue, 80)
color c3 = color.new(#2195f3, 30)
plot(shortest, color = c0)
plot(short, color = c1)
plot(long, color = c2)
plot(ta.cross(short, long) ? short : na, style = plot.style_cross, linewidth = 4,color = c3)
//------------------------------------------------------------------------------
// Nadaraya-Watson Envelope
//-----------------------------------------------------------------------------{
length2 = input.float(500,'Window Size',maxval=500,minval=0)
h1 = input.float(10.,'Bandwidth')
mult = input.float(3.)
srcUpperBand = input.source(low,'Source Upper Band')
src1 = input.source(high,'Source Lower Band')
up_col = input.color(#ff1100,'Colors',inline='col')
dn_col = input.color(#39ff14,'',inline='col')
show_bands = input(false, 'Show Bands')
show_sma_7_low_1 = input(false, 'Show SMA 7 LOW +1')
show_sma_7_low_7 = input(false, 'Show SMA 7 LOW -7')
show_sma_30_high = input(false, 'Show SMA 30 HIGH')
//----
var k = 2
var upper1 = array.new_line(0)
var lower1 = array.new_line(0)
sma7_low = ta.sma(low, 7)
sma30_high = ta.sma(high, 30)
strDownArrows = "↓▼↓"
strUpArrows = "↑▲↑"
RoundUp(number, decimals) =>
factor = math.pow(10, decimals)
math.ceil(number * factor) / factor
plot(show_sma_7_low_1?sma7_low:na, color=color.rgb(255, 235, 59, 81), title="SMA 7 LOW +1", offset=+1, linewidth=1)
plot(show_sma_7_low_7?sma7_low:na, color=color.rgb(255, 235, 59, 81), title="7 sma", offset=-7, linewidth=1)
plot(show_sma_30_high ? sma30_high:na, color=color.purple, title="SMA 30 High", linewidth=1)
lset(l,x1,y1,x2,y2,col)=>
line.set_xy1(l,x1,y1)
line.set_xy2(l,x2,y2)
line.set_color(l,col)
line.set_width(l,2)
if barstate.isfirst
for i = 0 to length2/k-1
array.push(upper1,line.new(na,na,na,na))
array.push(lower1,line.new(na,na,na,na))
//----
line up = na
line dn = na
//----
cross_up = 0.
cross_dn = 0.
if barstate.islast
y = array.new_float(0)
yUpper = array.new_float(0)
sum_upper_e = 0.
sum_e = 0.
for i = 0 to length2-1
sum_upper = 0.
sumw_upper = 0.
sum = 0.
sumw = 0.
for j = 0 to length2-1
w = math.exp(-(math.pow(i-j,2)/(h1*h1*2)))
sum_upper += srcUpperBand *w
sum += src1 *w
sumw += w
y_upper_2 = sum_upper/sumw
sum_upper_e += math.abs(srcUpperBand - y_upper_2)
array.push(yUpper,y_upper_2)
y2 = sum/sumw
sum_e += math.abs(src1 - y2)
array.push(y,y2)
mae_upper = sum_upper_e/length2*mult
mae = sum_e/length2*mult
for i = 1 to length2-1
upper_y2 = array.get(yUpper,i)
upper_y1 = array.get(yUpper,i-1)
y2 = array.get(y,i)
y1 = array.get(y,i-1)
up := array.get(upper1,i/k)
dn := array.get(lower1,i/k)
//draw borders bands
if show_bands
lset(up,n-i+1,upper_y1 + mae_upper,n-i,upper_y2 + mae_upper,up_col)
lset(dn,n-i+1,y1 - mae,n-i,y2 - mae,dn_col)
//draw fractals
//if src > y1 + mae and src < y1 + mae
// label.new(n-i,src ,strDownArrows,color=#00000000,style=label.style_label_down,textcolor=dn_col,textalign=text.align_center)
//if src < y1 - mae and src > y1 - mae
// label.new(n-i,src ,strUpArrows,color=#00000000,style=label.style_label_up,textcolor=up_col,textalign=text.align_center)
//draw sma 30 high signals
if sma30_high > upper_y1 + mae_upper and sma30_high < upper_y2 + mae_upper
label.new(n-i,srcUpperBand +mae_upper,strDownArrows,color=#00000000,style=label.style_label_down,textcolor=#ec0505,textalign=text.align_center)
//if sma30_high < y1 - mae and sma30_high > y2 - mae
// label.new(n-i,src ,strUpArrows,color=#00000000,style=label.style_label_down,textcolor=#ec05af,textalign=text.align_center)
//draw sma 7 low signals
if sma7_low > upper_y1 + mae_upper and sma7_low < upper_y2 + mae_upper
label.new(n-i,src1 ,strDownArrows,color=#00000000,style=label.style_label_down,textcolor=color.orange,textalign=text.align_center)
if sma7_low < y1 - mae and sma7_low > y2 - mae
label.new(n-i,src1 -mae,strUpArrows,color=#00000000,style=label.style_label_up,textcolor=color.rgb(16, 177, 4),textalign=text.align_center)
cross_up := array.get(yUpper,0) + mae_upper
cross_dn := array.get(y,0) - mae
sma7_crossover = ta.crossover(sma7_low,cross_up)
sma7_crossunder = ta.crossunder(sma7_low,cross_dn)
sma30_crossover = ta.crossover(sma30_high,cross_up)
sma30_crossunder = ta.crossunder(sma30_high,cross_dn)
alertcondition(sma30_crossunder or sma7_crossunder,title="LONG", message='LONG: {{ticker}}/{{interval}} at price {{close}} on {{exchange}}' )
alertcondition(sma7_crossover or sma30_crossover,title="SHORT", message='SHORT: {{ticker}}/{{interval}} at price {{close}} on {{exchange}}' )
//------------------------------------------------------------------------------
//SMT Divergences
//-----------------------------------------------------------------------------{
length3 = input.int(3, 'Pivot Lookback', minval = 2)
//Symbol A
useSym1 = input(true, 'Comparison Symbol', inline = 'symA')
sym1 = input.symbol('CME_MINI_DL:ES1!', '', inline = 'symA')
//Symbol B
useSym2 = input(true, 'Comparison Symbol', inline = 'symB')
sym2 = input.symbol('CBOT_MINI_DL:YM1!', '', inline = 'symB')
//Style
bullDivCss = input.color(#ff110082, 'Swing High', group = 'Style')
bearDivCss = input.color(#2156f380, 'Swing Low', group = 'Style')
//-----------------------------------------------------------------------------}
//Function
//-----------------------------------------------------------------------------{
get_hl() =>
//Swing highs divergences
get_divergence(ph1, y2, sym_y2, css)=>
var float y1 = na
var float sym_y1 = na
var int x1 = na
var smt = 0
if y2 != y2 and sym_y2 != sym_y2
//Test for SMT
if (y2 - y1) * (sym_y2 - sym_y1) < 0
line.new(n , y2, x1, y1, color = css)
smt += 1
sym_y1 := sym_y2
y1 := y2
x1 := n
else if (ph1 and y2 > y2 ) or (not ph1 and y2 < y2 )
sym_y1 := na
y1 := y2
x1 := n
smt
//-----------------------------------------------------------------------------}
//Main variables
//-----------------------------------------------------------------------------{
var phN = 0, var plN = 0
var ph_smt1 = 0.
var pl_smt1 = 0.
var ph_smt2 = 0.
var pl_smt2 = 0.
ticker1 = syminfo.ticker(sym1)
ticker2 = syminfo.ticker(sym2)
//-----------------------------------------------------------------------------}
//Detect swing highs/lows and divergences
//-----------------------------------------------------------------------------{
ph1 = fixnan(ta.pivothigh(length3, length3))
pl1 = fixnan(ta.pivotlow(length3, length3))
phN += ph1 != ph1 ? 1 : 0
plN += pl1 != pl1 ? 1 : 0
//Comparison symbol pivots
= request.security(sym1, timeframe.period, get_hl())
= request.security(sym2, timeframe.period, get_hl())
//Detect swing high divergences
if useSym1
sym_ph1 = fixnan(ta.pivothigh(h11, length3, length3))
sym_pl1 = fixnan(ta.pivotlow(l1, length3, length3))
ph_smt1 := get_divergence(true, ph1, sym_ph1, bullDivCss)
pl_smt1 := get_divergence(false, pl1, sym_pl1, bearDivCss)
if useSym2
sym_ph2 = fixnan(ta.pivothigh(h21, length3, length3))
sym_pl2 = fixnan(ta.pivotlow(l2, length3, length3))
ph_smt2 := get_divergence(true, ph1, sym_ph2, bullDivCss)
pl_smt2 := get_divergence(false, pl1, sym_pl2, bearDivCss)
txt = ''
if ph1 != ph1
if ph_smt1 > ph_smt1
txt += ticker1
if ph_smt2 > ph_smt2
txt += txt != '' ? ' | ' : ''
txt += ticker2
if txt != ''
label.new(n , ph1, txt
, color = bullDivCss
, style = label.style_label_down
, textcolor = color.white
, size = size.tiny)
else
if pl_smt1 > pl_smt1
txt += ticker1
if pl_smt2 > pl_smt2
txt += txt != '' ? ' | ' : ''
txt += ticker2
if txt != ''
label.new(n , pl1, txt
, color = bearDivCss
, style = label.style_label_up
, textcolor = color.white
, size = size.tiny)
//-----------------------------------------------------------------------------}
//Tables
//-----------------------------------------------------------------------------{
if barstate.isfirst and showDash
tb.cell(1, 0, 'Swing High', text_color = color.white)
tb.cell(2, 0, 'Swing Low', text_color = color.white)
tb.cell(0, 1, ticker1, text_color = color.white)
tb.cell(0, 2, ticker2, text_color = color.white)
if barstate.islast and showDash
//Symbol 1
tb.cell(1, 1, str.format('{0} ({1, number, percent})', ph_smt1, ph_smt1 / phN)
, text_color = bullDivCss)
tb.cell(2, 1, str.format('{0} ({1, number, percent})', pl_smt1, pl_smt1 / plN)
, text_color = bearDivCss)
//Symbol 2
tb.cell(1, 2, str.format('{0} ({1, number, percent})', ph_smt2, ph_smt2 / phN)
, text_color = bullDivCss)
tb.cell(2, 2, str.format('{0} ({1, number, percent})', pl_smt2, pl_smt2 / plN)
, text_color = bearDivCss)
//-----------------------------------------------------------------------------
// Imbalance Finder With Pip Target Box
//-----------------------------------------------------------------------------{
showema = input(defval=false, title='Show all EMAs', group='Plot EMA ')
Overridetargetsize = input(defval=false, title='Change Standard Target Size', group='Targets')
Targetssize = input.float(title='Pips for Target', defval=0.0001, minval=0.0001, group = 'Targets')
color black100 = color.new(color.black,100)
color green75 = color.new(color.green,75)
color green0 = color.new(#4caf4f, 10)
color aqua0 = color.new(color.aqua, 0)
color black0 = color.new(color.black, 0)
color blue0 = color.new(#0F52BA, 0)
color gray0 = color.new(#787b86, 100)
color orange0 = color.new(#ff8c00, 10)
color red0 = color.new(#ff5252, 10)
color red75 = color.new(color.red,75)
color white0 = color.new(color.white, 0)
color yellow0 = color.new(#fff700, 100)
bool showgreydiamond = input(defval=false, title='Show Diamond For Back Testing' ,group='=== Information ===')
LabelDigitDisplay =
syminfo.ticker == 'AUDCAD' == true ? '#.#####' : syminfo.ticker == 'AUDCHF' == true ? '#.#####' : syminfo.ticker == 'AUDJPY' == true ? '#.###' : syminfo.ticker == 'AUDNZD' == true ? '#.#####' :
syminfo.ticker == 'AUDUSD' == true ? '#.#####' : syminfo.ticker == 'CADCHF' == true ? '#.#####' : syminfo.ticker == 'CADJPY' == true ? '#.###' : syminfo.ticker == 'CHFJPY' == true ? '#.###' :
syminfo.ticker == 'EURAUD' == true ? '#.#####' : syminfo.ticker == 'EURCAD' == true ? '#.#####' : syminfo.ticker == 'EURCHF' == true ? '#.#####' : syminfo.ticker == 'EURGBP' == true ? '#.#####' :
syminfo.ticker == 'EURJPY' == true ? '#.###' : syminfo.ticker == 'EURNZD' == true ? '#.#####' : syminfo.ticker == 'EURUSD' == true ? '#.#####' : syminfo.ticker == 'GBPAUD' == true ? '#.#####' :
syminfo.ticker == 'GBPCAD' == true ? '#.#####' : syminfo.ticker == 'GBPCHF' == true ? '#.#####' : syminfo.ticker == 'GBPJPY' == true ? '#.###' : syminfo.ticker == 'GBPNZD' == true ? '#.#####' :
syminfo.ticker == 'GBPUSD' == true ? '#.#####' : syminfo.ticker == 'NZDCAD' == true ? '#.#####' : syminfo.ticker == 'NZDCHF' == true ? '#.#####' : syminfo.ticker == 'NZDJPY' == true ? '#.###':
syminfo.ticker == 'NZDUSD' == true ? '#.#####' : syminfo.ticker == 'USDCAD' == true ? '#.#####' : syminfo.ticker == 'USDCHF' == true ? '#.#####' : syminfo.ticker == 'USDJPY' == true ? '#.###':
syminfo.ticker == 'GOLD' == true ? '#.##' : syminfo.ticker == 'US100' == true ? '#.##' : syminfo.ticker == 'US30' == true ? '#.##' : syminfo.ticker == 'US500' == true ? '#.##' : syminfo.ticker == 'DE40' == true ? '#.##' : '#.#####'
PipsMultiplier =
syminfo.ticker == 'AUDCAD' == true ? 0.00050 : syminfo.ticker == 'AUDCHF' == true ? 0.00050 : syminfo.ticker == 'AUDJPY' == true ? 00.050 : syminfo.ticker == 'AUDNZD' == true ? 0.00050 :
syminfo.ticker == 'AUDUSD' == true ? 0.00050 : syminfo.ticker == 'CADCHF' == true ? 0.00050 : syminfo.ticker == 'CADJPY' == true ? 00.050 : syminfo.ticker == 'CHFJPY' == true ? 00.050:
syminfo.ticker == 'EURAUD' == true ? 0.00050 : syminfo.ticker == 'EURCAD' == true ? 0.00050 : syminfo.ticker == 'EURCHF' == true ? 0.00050 : syminfo.ticker == 'EURGBP' == true ? 0.00050 :
syminfo.ticker == 'EURJPY' == true ? 00.050 : syminfo.ticker == 'EURNZD' == true ? 0.00050 : syminfo.ticker == 'EURUSD' == true ? 0.00050 : syminfo.ticker == 'GBPAUD' == true ? 0.00050 :
syminfo.ticker == 'GBPCAD' == true ? 0.00050 : syminfo.ticker == 'GBPCHF' == true ? 0.00050 : syminfo.ticker == 'GBPJPY' == true ? 00.050 : syminfo.ticker == 'GBPNZD' == true ? 0.00050 :
syminfo.ticker == 'GBPUSD' == true ? 0.00050 : syminfo.ticker == 'NZDCAD' == true ? 0.00050 : syminfo.ticker == 'NZDCHF' == true ? 0.00050 : syminfo.ticker == 'NZDJPY' == true ? 00.050:
syminfo.ticker == 'NZDUSD' == true ? 0.00050 : syminfo.ticker == 'USDCAD' == true ? 0.00050 : syminfo.ticker == 'USDCHF' == true ? 0.00050 : syminfo.ticker == 'USDJPY' == true ? 00.050:
syminfo.ticker == 'GOLD' == true ? 1.5 : syminfo.ticker == 'US100' == true ? 10 : syminfo.ticker == 'US30' == true ? 25 : syminfo.ticker == 'US500' == true ? 10 : syminfo.ticker == 'DE40' == true ? 10 : 1
Targettouse = Overridetargetsize ? Targetssize : PipsMultiplier
Imbcol = input.color(yellow0, 'Imbalance Colour', inline="1" ,group='=== Information ===')
Dimcol = input.color(gray0, 'Imbalance Colour', inline="1" ,group='=== Information ===')
TopImbalance = low <= open and high >= close
TopImbalancesize = low - high
if TopImbalance and TopImbalancesize > 0
BOX1 = box.new(left=bar_index , top=low , right=bar_index , bottom=high )
box.set_bgcolor(BOX1, Imbcol )
box.set_border_color(BOX1, Imbcol )
BottomInbalance = high >= open and low <= close
BottomInbalancesize = low - high
if BottomInbalance and BottomInbalancesize > 0
BOX2 = box.new(left=bar_index , top=low , right=bar_index , bottom=high )
box.set_bgcolor(BOX2, Imbcol )
box.set_border_color(BOX2, Imbcol )
DownImbalance = TopImbalance and TopImbalancesize > 0
plotshape(DownImbalance and showgreydiamond, style=shape.diamond, location=location.abovebar, color=Dimcol, size=size.tiny)
UpImbalance = BottomInbalance and BottomInbalancesize > 0
plotshape(UpImbalance and showgreydiamond, style=shape.diamond, location=location.belowbar, color=Dimcol, size=size.tiny)
DownSell = close >open and closeopen
boxcolourtop = UpBuy ? green0 : black100
boxcolourbottom = DownSell ? red0 : black100
boxcolourtopfill = UpBuy ? green75 : black100
boxcolourbottomfill = DownSell ? red75 : black100
BottomLabel = label.new(x=bar_index, y=high+(Targettouse/3), xloc=xloc.bar_index)
label.set_text(BottomLabel, text
= " Entry = " + str.tostring(close,LabelDigitDisplay)
+ " Stop Loss = " + str.tostring(high,LabelDigitDisplay)
+ " Take Profit = " + str.tostring(close-PipsMultiplier,LabelDigitDisplay)
+ " Target Size = " + str.tostring(PipsMultiplier,LabelDigitDisplay))
label.set_textalign(BottomLabel, text.align_left)
label.set_style(BottomLabel, label.style_label_left)
label.set_color(BottomLabel, black100)
label.set_textcolor(BottomLabel, boxcolourbottom)
label.delete(BottomLabel )
Bottom = box.new(left=bar_index , top=low, right=bar_index , bottom=low-Targettouse, xloc=xloc.bar_index)
box.set_right(Bottom,right=box.get_right(id=Bottom)+10)
box.set_bgcolor(Bottom , color=boxcolourbottomfill )
box.set_border_color(Bottom , color=boxcolourbottom)
box.delete(Bottom )
TopLabel = label.new(x=bar_index, y=low-(Targettouse/3), xloc=xloc.bar_index)
label.set_text(TopLabel, text
= " Entry = " + str.tostring(close,LabelDigitDisplay)
+ " Stop Loss = " + str.tostring(low,LabelDigitDisplay)
+ " Take Profit = " + str.tostring(close+Targettouse,LabelDigitDisplay)
+ " Target Size = " + str.tostring(PipsMultiplier,LabelDigitDisplay))
label.set_textalign(TopLabel, text.align_left)
label.set_style(TopLabel, label.style_label_left)
label.set_color(TopLabel, black100)
label.set_textcolor(TopLabel, boxcolourtop )
label.delete(TopLabel )
Top = box.new(left=bar_index , top=high+Targettouse, right=bar_index , bottom=high, xloc=xloc.bar_index)
box.set_right(Top,right=box.get_right(id=Top)+10)
box.set_bgcolor(Top , color=boxcolourtopfill )
box.set_border_color(Top, color=boxcolourtop )
box.delete(Top )
ema13colour = showema ? red0 : black100
ema35colour = showema ? orange0 : black100
ema50colour = showema ? aqua0 : black100
offset = input.int(title='Offset', defval=0, minval=-500, maxval=500)
emalen1513 =26 //input.int(13, minval=1, title='Length 13 EMA 15 Min', group='=== EMA Information ===')
emasrc1513 = close
EMA13 = request.security(syminfo.tickerid, '1', ta.ema(emasrc1513, emalen1513))
plot(EMA13, title='EMA 13 15 Min', color=ema13colour, linewidth=1, offset=offset)
emalen1535 = 63 //input.int(35, minval=1, title='Length 35 EMA 15 Min', group='=== EMA Information ===')
emasrc1535 = close
EMA35 = request.security(syminfo.tickerid, '1', ta.ema(emasrc1535, emalen1535))
plot(EMA35, title='EMA 35 15 Min', color=ema35colour, linewidth=1, offset=offset)
emalen1550 = 100 //input.int(50, minval=1, title='Length 50 EMA 15 Min', group='=== EMA Information ===')
emasrc1550 = close
EMA50 = request.security(syminfo.tickerid, '1', ta.ema(emasrc1550, emalen1550))
plot(EMA50, title='EMA 50 15 Min', color=ema50colour, linewidth=2, offset=offset)
Up = EMA13 > EMA35 and EMA35 > EMA50
Down = EMA13 < EMA35 and EMA35 < EMA50
plotshape(Up , title='Up', style=shape.square, location=location.bottom, color=green0, size=size.tiny)
plotshape(Down , title='Down', style=shape.square, location=location.bottom, color=red0, size=size.tiny)
plotshape(not Down and not Up , title='Warning', style=shape.square, location=location.bottom, color=orange0, size=size.tiny)
alertcondition(Up and not Up , title='Buy Switch On', message='Buy Switch On')
alertcondition(Down and not Down , title='Sell Switch On', message='Sell Switch On')
alertcondition(Up and not Up , title='Warning Stop any More Buys', message='Warning Stop any More Buys')
alertcondition(Down and not Down, title='Warning Stop any More Sells', message='Warning Stop any More Sells')
alertcondition(open > close or close <= open , title='Every Bar Alert', message='Every Bar Alert')
//-----------------------------------------------------------------------------}
//SUPLLY AND DEMAND
//-----------------------------------------------------------------------------{
//-----------------------------------------------------------------------------}
//SUPPORT AND RESISTANCE MTF
//-----------------------------------------------------------------------------{
const bool DEBUG = false
const int timeframeCount = 3
const float touchATR = 1.0 / 30.0
const float retestATR = 1.0 / 30.0
const float labelOffsetY = 1.5
const int labelOffsetsXIndex = 30
const int maxPivotsBackSR = 15
const int retestLabelEveryXBars = 3
const int maxTraverse = 250 // Affects bar history limit. Default value 250.
const int maxRetestLabels = 100
const int maxSupports = 3
const int maxResistances = 3
const int debug_maxPivotLabels = 25
// _____ INPUTS _____
resistanceSupportCount = input.int(3, "Support & Resistance Count", options = , group = "General Configuration", display = display.none)
pivotRange = input.int(15, "Pivot Range", options = , tooltip = "Increase for more general pivots, decrease for more private pivots.", group = "General Configuration", display = display.none)
strength = input.int(1, "Strength", options = , tooltip = "X many times price touched relative price area in order to be considered a support/resistance zone.", group = "General Configuration", display = display.none)
expandLines = input.bool(true,"Expand Lines & Zones", group = "General Configuration", display = display.none)
enableZones = input.bool(false, "Enable Zones", group = "Support & Resistance Zones", display = display.none)
zoneWidthType = input.string("Dynamic", "Zone Width Type", options = , group = "Support & Resistance Zones", display = display.none)
zoneWidth = input.int(1, "Fixed Zone Width", options = , group = "Support & Resistance Zones", display = display.none)
timeframe1Enabled = input.bool(true, title = "", group = "Timeframes", inline = "timeframe1", display = display.none)
timeframe1 = input.timeframe("", title = "", group = "Timeframes", inline = "timeframe1", display = display.none)
timeframe2Enabled = input.bool(true, title = "", group = "Timeframes", inline = "timeframe2", display = display.none)
timeframe2 = input.timeframe("240", title = "", group = "Timeframes", inline = "timeframe2", display = display.none)
timeframe3Enabled = input.bool(false, title = "", group = "Timeframes", inline = "timeframe3", display = display.none)
timeframe3 = input.timeframe("30", title = "", group = "Timeframes", inline = "timeframe3", display = display.none)
showBreaks = input.bool(true,"Show Breaks", group = "Breaks & Retests", inline = "ShowBR", display = display.none)
showRetests = input.bool(true,"Show Retests", group = "Breaks & Retests", inline = "ShowBR", display = display.none)
avoidFalseBreaks = input.bool(true, "Avoid False Breaks", group = "Breaks & Retests", display = display.none)
falseBreakoutVolumeThresholdOpt = input.float(0.3, "Break Volume Threshold", minval=0.1, maxval=1.0, step=0.1, group = "Breaks & Retests", tooltip = "Only taken into account if Avoid False Breakouts is enabled. Higher values mean it's less likely to be a break.", display = display.none)
inverseBrokenLineColor = input.bool(true, "Inverse Color After Broken", tooltip = "Needs Show Breaks & Expand Lines option enabled.", group = "Breaks & Retests", display = display.none)
falseBreakoutVolumeThreshold = falseBreakoutVolumeThresholdOpt * 100.0
lineStyle = input.string("....", "Line Style", , group = "Style", display = display.none)
lineWidth = input.int(1, "Line Width", minval = 1, group = "Style", display = display.none)
supportColor = input.color(#08998180, "Support Color", group = "Style", inline = "RScolors", display = display.none)
resistanceColor = input.color(#f2364580, "Resistance Color", group = "Style", inline = "RScolors", display = display.none)
textColor = input.color(#11101051, "Text Color", group = "Style", inline = "RScolors", display = display.none)
labelsAlign = input.string("Right", "Align Labels", options = , group = "Style", tooltip = "Will only work when zones are disabled.", display = display.none)
enableRetestAlerts = input.bool(true, "Enable Retest Alerts", tooltip = "Needs Show Retests option enabled.", group = "Alerts", display = display.none)
enableBreakAlerts = input.bool(true, "Enable Break Alerts", group = "Alerts", display = display.none)
memoryOptimizatonEnabled = input.bool(true, "Enable Memory Optimization", tooltip = "Enable this option if you encounter memory errors.", group = "Advanced", display = display.none)
// _____ INPUTS END _____
// _____ DEBUG OPTIONS _____
debug_labelPivots = not DEBUG ? "None" : input.string("None", title = " Label Pivots", group = "DEBUG", options = , tooltip = "All -> Debugs all pivot labels. RS -> Debugs RS pivot labels. None -> Debugs none of the last R&S; pivots.")
debug_pivotLabelText = not DEBUG ? false : input.bool(false, title = " Pivot Label Text", group = "DEBUG")
debug_showBrokenOnLabel = not DEBUG ? false : input.bool(false, " Show Broken Text On Label", group = "DEBUG")
debug_removeDuplicateRS = not DEBUG ? true : input.bool(true, " Remove Duplicate RS", group = "DEBUG")
debug_lastXResistances = not DEBUG ? 3 : input.int(3, " Show Last X Resistances", minval = 0, maxval = maxResistances, group = "DEBUG")
debug_lastXSupports = not DEBUG ? 3 : input.int(3, " Show Last X Supports", minval = 0, maxval = maxSupports, group = "DEBUG")
debug_enabledHistory = not DEBUG ? true : input.bool(true, " Enable History", group = "DEBUG")
debug_maxHistoryRecords = not DEBUG ? 10 : input.int(10, " Max History Records", options = , group = "DEBUG")
// _____ DEBUG OPTIONS END _____
atr1 = ta.atr(30)
createRSLine (color) =>
line.new(na, na, na, na, extend = expandLines ? extend.both : extend.none, xloc=xloc.bar_time, color = color, width = lineWidth, style = lineStyle == "----" ? line.style_dashed : lineStyl
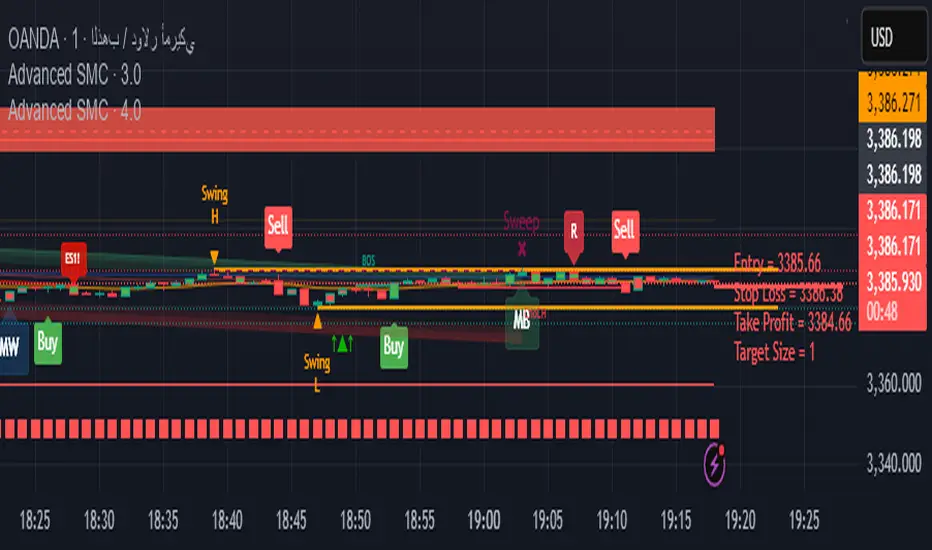
Dealing rangeHi all!
This indicator will show you the current dealing range. The concept of dealing range comes from the inner circle trader (ICT) and gives you a range between an established swing high and an established swing low (the length of these pivots can be changed in settings parameter Length and defaults to 5/2 (left/right)). These swing points must have taken out liquidity to be considered "established". The liquidity that must be grabbed by the swing point has to be a pivot of left length of 1 and a right length of 1.
The dealing range that's created should be used in conjunction with market structure. This could be done through scripts (maybe the Market structure script that I published ()) or manually. It's a common approach to look for long opportunities when the trend is bullish and price is currently in the discount zone of the dealing range. If the trend is bearish then short opportunities are presented when the price is currently in the premium zone of the dealing range.
The zones within the dealing range are premium and discount that are split on the 50% level of the dealing range. These zones can be split into 3 zone with a Fair price (also called Fair value ) zone in between premium and discount. This makes the premium zone to be in the upper third of the dealing range, fair price in the middle third and discount in the lower third. This can be enabled in the settings through the Fair price parameter.
Enabled:
You can choose to enable/disable the visualisation of liquidity grabs and the External liquidity available above and below the swing points that created the dealing range.
Enabled:
Disabled:
Enabled on a higher timeframe (will display a box of the liquidity grab price instead of a label):
This dealing range is configurable to be created by a higher timeframe then the visible charts. Use the setting Higher timeframe to change this.
You can force candles to be closed (for liquidity and swing points). Please note that if you use a higher timeframe then the visible charts the candles must be closed on this timeframe.
Lastly you can also change the transparency of liquidity grabs and external liquidity outside of the dealing range. Use the Transparency setting to change this (a lower value will lead to stronger visuals).
If you have any input or suggestions on future features or bugs, don't hesitate to let me know!
Best of trading luck!

Forex Fire Sling Shot with Trade ManagementForex Fire Sling Shot Indicator with Trade Management
Description
The Forex Fire Sling Shot Indicator is a comprehensive trading system designed specifically for forex markets. It combines trend analysis, momentum confirmation, and advanced trade management features to help traders identify high-probability trading opportunities.
This indicator provides clear entry signals based on multiple EMA crossovers with MACD confirmation, while incorporating professional trade management tools including automatic stop loss calculation, take profit targets, and breakeven management.
Key Features
Triple EMA Trend Analysis: Uses 15, 50, and 200 EMAs to identify trend direction and entry points
MACD Confirmation: Optional MACD filter for enhanced signal reliability
Premium Signals: Strict entry criteria combining EMA crossover with MACD crossover
Automatic Trade Management: Calculates entry, stop loss, and take profit levels
Breakeven Management: Automatically adjusts stop loss to breakeven at predetermined profit levels
Visual Trade Setup: Displays trade management levels with clear labels
Status Dashboard: Real-time display of current market conditions
Alert System: Built-in alerts for premium trading signals
How to Use
Setup
Add the indicator to any forex chart (recommended timeframes: 1H, 4H, Daily)
Ensure your chart is clean without overlapping indicators
Configure input parameters according to your trading style
Signal Identification
Premium Buy Signal (Diamond Below Bar)
15 EMA crosses above 50 EMA
Price is above 200 EMA (bullish trend)
MACD line crosses above signal line
Green diamond appears below candle
Premium Sell Signal (Diamond Above Bar)
15 EMA crosses below 50 EMA
Price is below 200 EMA (bearish trend)
MACD line crosses below signal line
Fuchsia diamond appears above candle
Trade Execution
When a premium signal appears:
Entry:
Buy: Place order above the signal candle's high
Sell: Place order below the signal candle's low
Stop Loss:
Buy: Lowest low of the past 5 candles (adjustable)
Sell: Highest high of the past 5 candles (adjustable)
Take Profit:
Automatically calculated based on your Risk-Reward ratio (default 1:1.5)
Breakeven Management:
Stop loss moves to breakeven when trade reaches 50% of target (adjustable)
Input Parameters
EMA Settings
Short EMA Period (default: 15)
Long EMA Period (default: 50)
Trend EMA Period (default: 200)
MACD Settings
MACD Fast Length (default: 12)
MACD Slow Length (default: 26)
MACD Signal Length (default: 9)
Require MACD Confirmation (default: true)
Trade Management
Risk-Reward Ratio (default: 1.5)
Stop Loss Lookback Candles (default: 5)
Move SL to Breakeven at % of TP (default: 0.5)
Show Trade Management Labels (default: true)
Alert Settings
Enable Premium Signal Alerts (default: true)
Status Dashboard
The top-right dashboard displays:
MACD Signal status (Bullish/Bearish/Cross)
Overall Trend direction
Current Signal status
Trade Setup details (if active)
Risk-Reward information
Breakeven status
Visual Elements
Green Line: 15 EMA (Fast)
Red Line: 50 EMA (Medium)
Black Line: 200 EMA (Trend)
Yellow Lines: Entry levels
Red Lines: Stop loss levels
Green Lines: Take profit levels
Blue Lines: Breakeven levels
Purple Lines: Breakeven trigger levels
Trading Tips
Only trade premium signals in the direction of the trend (above/below 200 EMA)
Wait for candle close before entering trades
Use higher timeframes for better signal reliability (4H, Daily)
Consider market sessions and major news events
Always use proper position sizing based on your account risk
Risk Disclaimer
This indicator is for educational and informational purposes only. Trading forex involves substantial risk of loss and is not suitable for all investors. Past performance is not indicative of future results. Always conduct your own analysis and risk management.
Updates and Support
The indicator includes built-in alerts for premium signals. To set up alerts:
Right-click on the chart
Select "Add Alert"
Choose "Forex Fire Sling Shot with Trade Management"
Select either "Premium Fire Sling Shot Buy" or "Premium Fire Bear Sling Sell"
For questions or support, please use the comments section below the indicator.

Multitimeframe Order Block Finder (Zeiierman)█ Overview
The Multitimeframe Order Block Finder (Zeiierman) is a powerful tool designed to identify potential institutional zones of interest — Order Blocks — across any timeframe, regardless of what chart you're viewing.
Order Blocks are critical supply and demand zones formed by the last opposing candle before an impulsive move. These areas often act as magnets for price and serve as smart-money footprints — ideal for anticipating reversals, retests, or breakouts.
This indicator not only detects such zones in real-time, but also visualizes their mitigation, bull/bear volume pressure, and a smoothed directional trendline based on Order Block behavior.
█ How It Works
The script fetches OHLCV data from your chosen timeframe using request.security() and processes it using strict pattern logic and volume-derived strength conditions. It detects Order Blocks only when the structure aligns with dominant pressure and visually extends valid zones forward for as long as they remain unmitigated.
⚪ Bull/Bear Volume Power Visualization
Each OB includes proportional bars representing estimated buy/sell effort:
Buy Power: % of volume attributed to buyers
Sell Power: % of volume attributed to sellers
This adds a visual, intuitive layer of intent — showing who controlled the price before the OB formed.
⚪ Order Block Trendline (Butterworth Filtered)
A smoothed trendline is derived from the average OB value over time using a two-pole Butterworth low-pass filter. This helps you understand the broader directional pressure:
Trendline up → favor bullish OBs
Trendline down → favor bearish OBs
█ How to Use
⚪ Trade From Order Blocks Like Institutions
Use this tool to find institutional footprints and reaction zones:
Enter at unmitigated OBs
⚪ Volume Power
Volume Pressure Bars inside each OB help you:
Confirm strong buyer/seller dominance
Detect possible traps or exhaustion
Understand how each zone formed
⚪ Find Trend & Pullbacks
The trendline not only helps traders detect the current trend direction, but the built-in trend coloring also highlights potential pullback areas within these trends.
█ Settings
Timeframe – Selects which timeframe to scan for Order Blocks.
Lookback Period – Defines how many bars back are used to detect bullish or bearish momentum shifts.
Sensitivity – When enabled, the indicator uses smoothed price (RMA) with rising/falling logic instead of raw candle closes. This allows more flexible detection of trend shifts and results in more Order Blocks being identified.
Minimum Percent Move – Filters out weak moves. Higher = only strong price shifts.
Mitigated on Mid – OB is removed when price touches its midpoint.
Show OB Table – Displays a panel listing all active (unmitigated) Order Blocks.
Extend Boxes – Controls how far OB boxes stretch into the future.
Show OB Trend – Toggles the trendline derived from Order Block strength.
Passband Ripple (dB) – Controls trendline reactivity. Higher = more sensitive.
Cutoff Frequency – Controls smoothness of trendline (0–0.5). Lower = smoother.
-----------------
Disclaimer
The content provided in my scripts, indicators, ideas, algorithms, and systems is for educational and informational purposes only. It does not constitute financial advice, investment recommendations, or a solicitation to buy or sell any financial instruments. I will not accept liability for any loss or damage, including without limitation any loss of profit, which may arise directly or indirectly from the use of or reliance on such information.
All investments involve risk, and the past performance of a security, industry, sector, market, financial product, trading strategy, backtest, or individual's trading does not guarantee future results or returns. Investors are fully responsible for any investment decisions they make. Such decisions should be based solely on an evaluation of their financial circumstances, investment objectives, risk tolerance, and liquidity needs.

Multi-VWAP System🚀 Multi-VWAP System — Anchored VWAP & Deviation Bands
Overview
The Multi-VWAP System provides traders with a professional-grade approach to anchored VWAP analysis. Inspired by Brian Shannon's pioneering work on Anchored VWAP, this indicator automatically calculates and plots:
Current Session VWAP
Previous Session VWAP (also known as "2-Day VWAP")
High-of-Day (HOD) Anchored VWAP
Each VWAP can also display optional Standard Deviation Bands to highlight statistically significant deviations from the volume-weighted average price.
🔍 Why Anchored VWAP Matters
Volume Weighted Average Price (VWAP) is among the most critical institutional indicators, as it represents the average price paid for a stock adjusted by trading volume. This makes VWAP crucial for identifying fair value and significant areas of institutional activity.
Institutions utilize VWAP extensively to guide their execution algorithms. For instance, if price dips below a 2-day anchored VWAP (anchored to the previous session's open), many institutions interpret this as a discounted entry, potentially triggering large-scale buy programs. Conversely, sustained movement above VWAP signals strong buying pressure and bullish sentiment.
📌 Why Multiple Anchors?
Traders commonly anchor VWAPs at critical reference points:
Current Session VWAP:
Essential for day traders as a reference for intraday sentiment. Price action above this line generally indicates bullish sentiment, while price below signals bearish sentiment.
Previous Session (2-Day) VWAP:
Heavily used by institutions and swing traders, it provides insight into multi-session sentiment. Institutions commonly activate buy or sell programs based on whether price is trading at a premium or discount relative to this VWAP.
High-of-Day (HOD) VWAP:
Frequently used by momentum traders, this anchor captures sentiment after the most recent intraday high. Price above the HOD VWAP suggests sustained bullish momentum, while price below might signal weakening momentum.
🌟 Standard Deviation Bands
Each anchored VWAP in this indicator includes optional Standard Deviation Bands, highlighting statistical extremes. Traders use these bands to:
Identify potentially overextended moves (beyond +2σ or +3σ).
Gauge momentum strength (holding above +1σ).
Spot mean-reversion setups when price returns to VWAP after extreme moves.
🎨 Dynamic Background and Momentum Colorization
To visually highlight strength or weakness in price action relative to VWAP:
Dynamic Background Fill between Current and Previous VWAPs:
Green background appears when the Current VWAP is above the Previous VWAP and the linear regression slope (adjustable length) is positive, indicating bullish sentiment.
Red background appears when the Current VWAP is below the Previous VWAP and the slope is negative, indicating bearish sentiment.
No fill when conditions are mixed or momentum is uncertain.
Gold Fill above HOD VWAP:
When price action is above the High-of-Day VWAP and momentum (linear regression slope) is positive, a subtle gold shading appears, quickly highlighting bullish momentum.
⚙ Fully Customizable Settings
Session Times: Adjust session start and end times to match your specific market hours.
Standard Deviation Bands: Enable or disable each VWAP’s deviation bands individually and select how many bands (1σ, 2σ, or 3σ) you'd like to display.
Momentum Slope Length: Adjustable lookback for linear regression slope calculation—giving you full control of trend sensitivity.
🎯 Who Should Use This Indicator?
This indicator is perfect for:
Day Traders who want quick insights into intraday sentiment shifts.
Swing Traders tracking institutional footprints and seeking optimal entry/exit points.
Momentum Traders who rely on clearly visible momentum signals from HOD anchored VWAPs.
Institutional Traders and Professionals seeking sophisticated, institutionally-inspired VWAP analysis without manual anchoring.
📈 Summary of Features
✅ Automatic VWAP Anchors (Current Session, Previous Session, High-of-Day)
✅ Optional Standard Deviation Bands for each VWAP anchor
✅ Dynamic Background Coloring based on price action and momentum conditions
✅ Gold Momentum Highlight for quick bullish momentum identification above HOD VWAP
✅ Fully Customizable Inputs for precise personalization and flexibility
📢 Conclusion
The Multi-VWAP System isn't just another VWAP indicator. It's an institutional-level, dynamic, multi-dimensional analysis tool inspired by the work of Brian Shannon and leading institutional traders. It takes the guesswork out of anchoring and analysis, leaving you free to focus on identifying and executing high-probability trade setups.
Enjoy trading smarter—not harder. Happy Trading! 🚀📊

pymath█ OVERVIEW
This library ➕ enhances Pine Script's built-in types (`float`, `int`, `array`, `array`) with mathematical methods, mirroring 🪞 many functions from Python's `math` module. Import this library to overload or add to built-in capabilities, enabling calls like `myFloat.sin()` or `myIntArray.gcd()`.
█ CONCEPTS
This library wraps Pine's built-in `math.*` functions and implements others where necessary, expanding the mathematical toolkit available within Pine Script. It provides a more object-oriented approach to mathematical operations on core data types.
█ HOW TO USE
• Import the library: i mport kaigouthro/pymath/1
• Call methods directly on variables: myFloat.sin() , myIntArray.gcd()
• For raw integer literals, you MUST use parentheses: `(1234).factorial()`.
█ FEATURES
• **Infinity Handling:** Includes `isinf()` and `isfinite()` for robust checks. Uses `POS_INF_PROXY` to represent infinity.
• **Comprehensive Math Functions:** Implements a wide range of methods, including trigonometric, logarithmic, hyperbolic, and array operations.
• **Object-Oriented Approach:** Allows direct method calls on `int`, `float`, and arrays for cleaner code.
• **Improved Accuracy:** Some functions (e.g., `remainder()`) offer improved accuracy compared to default Pine behavior.
• **Helper Functions:** Internal helper functions optimize calculations and handle edge cases.
█ NOTES
This library improves upon Pine Script's built-in `math` functions by adding new ones and refining existing implementations. It handles edge cases such as infinity, NaN, and zero values, enhancing the reliability of your Pine scripts. For Speed, it wraps and uses built-ins, as thy are fastest.
█ EXAMPLES
//@version=6
indicator("My Indicator")
// Import the library
import kaigouthro/pymath/1
// Create some Vars
float myFloat = 3.14159
int myInt = 10
array myIntArray = array.from(1, 2, 3, 4, 5)
// Now you can...
plot( myFloat.sin() ) // Use sin() method on a float, using built in wrapper
plot( (myInt).factorial() ) // Factorial of an integer (note parentheses)
plot( myIntArray.gcd() ) // GCD of an integer array
method isinf(self)
isinf: Checks if this float is positive or negative infinity using a proxy value.
Namespace types: series float, simple float, input float, const float
Parameters:
self (float) : (float) value to check.
Returns: (bool) `true` if the absolute value of `self` is greater than or equal to the infinity proxy, `false` otherwise.
method isfinite(self)
isfinite: Checks if this float is finite (not NaN and not infinity).
Namespace types: series float, simple float, input float, const float
Parameters:
self (float) : (float) The value to check.
Returns: (bool) `true` if `self` is not `na` and not infinity (as defined by `isinf()`), `false` otherwise.
method fmod(self, divisor)
fmod: Returns the C-library style floating-point remainder of `self / divisor` (result has the sign of `self`).
Namespace types: series float, simple float, input float, const float
Parameters:
self (float) : (float) Dividend `x`.
divisor (float) : (float) Divisor `y`. Cannot be zero or `na`.
Returns: (float) The remainder `x - n*y` where n is `trunc(x/y)`, or `na` if divisor is 0, `na`, or inputs are infinite in a way that prevents calculation.
method factorial(self)
factorial: Calculates the factorial of this non-negative integer.
Namespace types: series int, simple int, input int, const int
Parameters:
self (int) : (int) The integer `n`. Must be non-negative.
Returns: (float) `n!` as a float, or `na` if `n` is negative or overflow occurs (based on `isinf`).
method isqrt(self)
isqrt: Calculates the integer square root of this non-negative integer (floor of the exact square root).
Namespace types: series int, simple int, input int, const int
Parameters:
self (int) : (int) The non-negative integer `n`.
Returns: (int) The greatest integer `a` such that a² <= n, or `na` if `n` is negative.
method comb(self, k)
comb: Calculates the number of ways to choose `k` items from `self` items without repetition and without order (Binomial Coefficient).
Namespace types: series int, simple int, input int, const int
Parameters:
self (int) : (int) Total number of items `n`. Must be non-negative.
k (int) : (int) Number of items to choose. Must be non-negative.
Returns: (float) The binomial coefficient nCk, or `na` if inputs are invalid (n<0 or k<0), `k > n`, or overflow occurs.
method perm(self, k)
perm: Calculates the number of ways to choose `k` items from `self` items without repetition and with order (Permutations).
Namespace types: series int, simple int, input int, const int
Parameters:
self (int) : (int) Total number of items `n`. Must be non-negative.
k (simple int) : (simple int = na) Number of items to choose. Must be non-negative. Defaults to `n` if `na`.
Returns: (float) The number of permutations nPk, or `na` if inputs are invalid (n<0 or k<0), `k > n`, or overflow occurs.
method log2(self)
log2: Returns the base-2 logarithm of this float. Input must be positive. Wraps `math.log(self) / math.log(2.0)`.
Namespace types: series float, simple float, input float, const float
Parameters:
self (float) : (float) The input number. Must be positive.
Returns: (float) The base-2 logarithm, or `na` if input <= 0.
method trunc(self)
trunc: Returns this float with the fractional part removed (truncates towards zero).
Namespace types: series float, simple float, input float, const float
Parameters:
self (float) : (float) The input number.
Returns: (int) The integer part, or `na` if input is `na` or infinite.
method abs(self)
abs: Returns the absolute value of this float. Wraps `math.abs()`.
Namespace types: series float, simple float, input float, const float
Parameters:
self (float) : (float) The input number.
Returns: (float) The absolute value, or `na` if input is `na`.
method acos(self)
acos: Returns the arccosine of this float, in radians. Wraps `math.acos()`. Input must be between -1 and 1.
Namespace types: series float, simple float, input float, const float
Parameters:
self (float) : (float) The input number. Must be between -1 and 1.
Returns: (float) Angle in radians , or `na` if input is outside or `na`.
method asin(self)
asin: Returns the arcsine of this float, in radians. Wraps `math.asin()`. Input must be between -1 and 1.
Namespace types: series float, simple float, input float, const float
Parameters:
self (float) : (float) The input number. Must be between -1 and 1.
Returns: (float) Angle in radians , or `na` if input is outside or `na`.
method atan(self)
atan: Returns the arctangent of this float, in radians. Wraps `math.atan()`.
Namespace types: series float, simple float, input float, const float
Parameters:
self (float) : (float) The input number.
Returns: (float) Angle in radians , or `na` if input is `na`.
method ceil(self)
ceil: Returns the ceiling of this float (smallest integer >= self). Wraps `math.ceil()`.
Namespace types: series float, simple float, input float, const float
Parameters:
self (float) : (float) The input number.
Returns: (int) The ceiling value, or `na` if input is `na` or infinite.
method cos(self)
cos: Returns the cosine of this float (angle in radians). Wraps `math.cos()`.
Namespace types: series float, simple float, input float, const float
Parameters:
self (float) : (float) The angle in radians.
Returns: (float) The cosine, or `na` if input is `na`.
method degrees(self)
degrees: Converts this float from radians to degrees. Wraps `math.todegrees()`.
Namespace types: series float, simple float, input float, const float
Parameters:
self (float) : (float) The angle in radians.
Returns: (float) The angle in degrees, or `na` if input is `na`.
method exp(self)
exp: Returns e raised to the power of this float. Wraps `math.exp()`.
Namespace types: series float, simple float, input float, const float
Parameters:
self (float) : (float) The exponent.
Returns: (float) `e**self`, or `na` if input is `na`.
method floor(self)
floor: Returns the floor of this float (largest integer <= self). Wraps `math.floor()`.
Namespace types: series float, simple float, input float, const float
Parameters:
self (float) : (float) The input number.
Returns: (int) The floor value, or `na` if input is `na` or infinite.
method log(self)
log: Returns the natural logarithm (base e) of this float. Wraps `math.log()`. Input must be positive.
Namespace types: series float, simple float, input float, const float
Parameters:
self (float) : (float) The input number. Must be positive.
Returns: (float) The natural logarithm, or `na` if input <= 0 or `na`.
method log10(self)
log10: Returns the base-10 logarithm of this float. Wraps `math.log10()`. Input must be positive.
Namespace types: series float, simple float, input float, const float
Parameters:
self (float) : (float) The input number. Must be positive.
Returns: (float) The base-10 logarithm, or `na` if input <= 0 or `na`.
method pow(self, exponent)
pow: Returns this float raised to the power of `exponent`. Wraps `math.pow()`.
Namespace types: series float, simple float, input float, const float
Parameters:
self (float) : (float) The base.
exponent (float) : (float) The exponent.
Returns: (float) `self**exponent`, or `na` if inputs are `na` or lead to undefined results.
method radians(self)
radians: Converts this float from degrees to radians. Wraps `math.toradians()`.
Namespace types: series float, simple float, input float, const float
Parameters:
self (float) : (float) The angle in degrees.
Returns: (float) The angle in radians, or `na` if input is `na`.
method round(self)
round: Returns the nearest integer to this float. Wraps `math.round()`. Ties are rounded away from zero.
Namespace types: series float, simple float, input float, const float
Parameters:
self (float) : (float) The input number.
Returns: (int) The rounded integer, or `na` if input is `na` or infinite.
method sign(self)
sign: Returns the sign of this float (-1, 0, or 1). Wraps `math.sign()`.
Namespace types: series float, simple float, input float, const float
Parameters:
self (float) : (float) The input number.
Returns: (int) -1 if negative, 0 if zero, 1 if positive, `na` if input is `na`.
method sin(self)
sin: Returns the sine of this float (angle in radians). Wraps `math.sin()`.
Namespace types: series float, simple float, input float, const float
Parameters:
self (float) : (float) The angle in radians.
Returns: (float) The sine, or `na` if input is `na`.
method sqrt(self)
sqrt: Returns the square root of this float. Wraps `math.sqrt()`. Input must be non-negative.
Namespace types: series float, simple float, input float, const float
Parameters:
self (float) : (float) The input number. Must be non-negative.
Returns: (float) The square root, or `na` if input < 0 or `na`.
method tan(self)
tan: Returns the tangent of this float (angle in radians). Wraps `math.tan()`.
Namespace types: series float, simple float, input float, const float
Parameters:
self (float) : (float) The angle in radians.
Returns: (float) The tangent, or `na` if input is `na`.
method acosh(self)
acosh: Returns the inverse hyperbolic cosine of this float. Input must be >= 1.
Namespace types: series float, simple float, input float, const float
Parameters:
self (float) : (float) The input number. Must be >= 1.
Returns: (float) The inverse hyperbolic cosine, or `na` if input < 1 or `na`.
method asinh(self)
asinh: Returns the inverse hyperbolic sine of this float.
Namespace types: series float, simple float, input float, const float
Parameters:
self (float) : (float) The input number.
Returns: (float) The inverse hyperbolic sine, or `na` if input is `na`.
method atanh(self)
atanh: Returns the inverse hyperbolic tangent of this float. Input must be between -1 and 1 (exclusive).
Namespace types: series float, simple float, input float, const float
Parameters:
self (float) : (float) The input number. Must be between -1 and 1 (exclusive).
Returns: (float) The inverse hyperbolic tangent, or `na` if input is outside (-1, 1) or `na`.
method cosh(self)
cosh: Returns the hyperbolic cosine of this float.
Namespace types: series float, simple float, input float, const float
Parameters:
self (float) : (float) The input number.
Returns: (float) The hyperbolic cosine, or `na` if input is `na`.
method sinh(self)
sinh: Returns the hyperbolic sine of this float.
Namespace types: series float, simple float, input float, const float
Parameters:
self (float) : (float) The input number.
Returns: (float) The hyperbolic sine, or `na` if input is `na`.
method tanh(self)
tanh: Returns the hyperbolic tangent of this float.
Namespace types: series float, simple float, input float, const float
Parameters:
self (float) : (float) The input number.
Returns: (float) The hyperbolic tangent, or `na` if input is `na`.
method atan2(self, dx)
atan2: Returns the angle in radians between the positive x-axis and the point (dx, self). Wraps `math.atan2()`.
Namespace types: series float, simple float, input float, const float
Parameters:
self (float) : (float) The y-coordinate `y`.
dx (float) : (float) The x-coordinate `x`.
Returns: (float) The angle in radians , result of `math.atan2(self, dx)`. Returns `na` if inputs are `na`. Note: `math.atan2(0, 0)` returns 0 in Pine.
Optimization: Use built-in math.atan2()
method cbrt(self)
cbrt: Returns the cube root of this float.
Namespace types: series float, simple float, input float, const float
Parameters:
self (float) : (float) The value to find the cube root of.
Returns: (float) The real cube root. Handles negative inputs correctly, or `na` if input is `na`.
method exp2(self)
exp2: Returns 2 raised to the power of this float. Calculated as `2.0.pow(self)`.
Namespace types: series float, simple float, input float, const float
Parameters:
self (float) : (float) The exponent.
Returns: (float) `2**self`, or `na` if input is `na` or results in non-finite value.
method expm1(self)
expm1: Returns `e**self - 1`. Calculated as `self.exp() - 1.0`. May offer better precision for small `self` in some environments, but Pine provides no guarantee over `self.exp() - 1.0`.
Namespace types: series float, simple float, input float, const float
Parameters:
self (float) : (float) The exponent.
Returns: (float) `e**self - 1`, or `na` if input is `na` or `self.exp()` is `na`.
method log1p(self)
log1p: Returns the natural logarithm of (1 + self). Calculated as `(1.0 + self).log()`. Pine provides no specific precision guarantee for self near zero.
Namespace types: series float, simple float, input float, const float
Parameters:
self (float) : (float) Value to add to 1. `1 + self` must be positive.
Returns: (float) Natural log of `1 + self`, or `na` if input is `na` or `1 + self <= 0`.
method modf(self)
modf: Returns the fractional and integer parts of this float as a tuple ` `. Both parts have the sign of `self`.
Namespace types: series float, simple float, input float, const float
Parameters:
self (float) : (float) The number `x` to split.
Returns: ( ) A tuple containing ` `, or ` ` if `x` is `na` or non-finite.
method remainder(self, divisor)
remainder: Returns the IEEE 754 style remainder of `self` with respect to `divisor`. Result `r` satisfies `abs(r) <= 0.5 * abs(divisor)`. Uses round-half-to-even.
Namespace types: series float, simple float, input float, const float
Parameters:
self (float) : (float) Dividend `x`.
divisor (float) : (float) Divisor `y`. Cannot be zero or `na`.
Returns: (float) The IEEE 754 remainder, or `na` if divisor is 0, `na`, or inputs are non-finite in a way that prevents calculation.
method copysign(self, signSource)
copysign: Returns a float with the magnitude (absolute value) of `self` but the sign of `signSource`.
Namespace types: series float, simple float, input float, const float
Parameters:
self (float) : (float) Value providing the magnitude `x`.
signSource (float) : (float) Value providing the sign `y`.
Returns: (float) `abs(x)` with the sign of `y`, or `na` if either input is `na`.
method frexp(self)
frexp: Returns the mantissa (m) and exponent (e) of this float `x` as ` `, such that `x = m * 2^e` and `0.5 <= abs(m) < 1` (unless `x` is 0).
Namespace types: series float, simple float, input float, const float
Parameters:
self (float) : (float) The number `x` to decompose.
Returns: ( ) A tuple ` `, or ` ` if `x` is 0, or ` ` if `x` is non-finite or `na`.
method isclose(self, other, rel_tol, abs_tol)
isclose: Checks if this float `a` and `other` float `b` are close within relative and absolute tolerances.
Namespace types: series float, simple float, input float, const float
Parameters:
self (float) : (float) First value `a`.
other (float) : (float) Second value `b`.
rel_tol (simple float) : (simple float = 1e-9) Relative tolerance. Must be non-negative and less than 1.0.
abs_tol (simple float) : (simple float = 0.0) Absolute tolerance. Must be non-negative.
Returns: (bool) `true` if `abs(a - b) <= max(rel_tol * max(abs(a), abs(b)), abs_tol)`. Handles `na`/`inf` appropriately. Returns `na` if tolerances are invalid.
method ldexp(self, exponent)
ldexp: Returns `self * (2**exponent)`. Inverse of `frexp`.
Namespace types: series float, simple float, input float, const float
Parameters:
self (float) : (float) Mantissa part `x`.
exponent (int) : (int) Exponent part `i`.
Returns: (float) The result of `x * pow(2, i)`, or `na` if inputs are `na` or result is non-finite.
method gcd(self)
gcd: Calculates the Greatest Common Divisor (GCD) of all integers in this array.
Namespace types: array
Parameters:
self (array) : (array) An array of integers.
Returns: (int) The largest positive integer that divides all non-zero elements, 0 if all elements are 0 or array is empty. Returns `na` if any element is `na`.
method lcm(self)
lcm: Calculates the Least Common Multiple (LCM) of all integers in this array.
Namespace types: array
Parameters:
self (array) : (array) An array of integers.
Returns: (int) The smallest positive integer that is a multiple of all non-zero elements, 0 if any element is 0, 1 if array is empty. Returns `na` on potential overflow or if any element is `na`.
method dist(self, other)
dist: Returns the Euclidean distance between this point `p` and another point `q` (given as arrays of coordinates).
Namespace types: array
Parameters:
self (array) : (array) Coordinates of the first point `p`.
other (array) : (array) Coordinates of the second point `q`. Must have the same size as `p`.
Returns: (float) The Euclidean distance, or `na` if arrays have different sizes, are empty, or contain `na`/non-finite values.
method fsum(self)
fsum: Returns an accurate floating-point sum of values in this array. Uses built-in `array.sum()`. Note: Pine Script does not guarantee the same level of precision tracking as Python's `math.fsum`.
Namespace types: array
Parameters:
self (array) : (array) The array of floats to sum.
Returns: (float) The sum of the array elements. Returns 0.0 for an empty array. Returns `na` if any element is `na`.
method hypot(self)
hypot: Returns the Euclidean norm (distance from origin) for this point given by coordinates in the array. `sqrt(sum(x*x for x in coordinates))`.
Namespace types: array
Parameters:
self (array) : (array) Array of coordinates defining the point.
Returns: (float) The Euclidean norm, or 0.0 if the array is empty. Returns `na` if any element is `na` or non-finite.
method prod(self, start)
prod: Calculates the product of all elements in this array.
Namespace types: array
Parameters:
self (array) : (array) The array of values to multiply.
start (simple float) : (simple float = 1.0) The starting value for the product (returned if the array is empty).
Returns: (float) The product of array elements * start. Returns `na` if any element is `na`.
method sumprod(self, other)
sumprod: Returns the sum of products of values from this array `p` and another array `q` (dot product).
Namespace types: array
Parameters:
self (array) : (array) First array of values `p`.
other (array) : (array) Second array of values `q`. Must have the same size as `p`.
Returns: (float) The sum of `p * q ` for all i, or `na` if arrays have different sizes or contain `na`/non-finite values. Returns 0.0 for empty arrays.

Liquidity Points - FrancescoLiquidity points, marks likely liquidity points, used with H1 works well, in settings you can choose what timeframe to use

BBPT + ADX CombinedThis indicator is a combination of three key indicators that I use in my trading. You can observe and evaluate how to use it by yourself, as I won’t be able to explain exactly how it works. However, I believe it will definitely be useful for users. Thank you.

Black Candle - First Sell/Buy Signalthis indicator is based on price action and moving averages. it will give you buy and sell indications with good accuracy

GM WeeklyThe GM Weekly indicator displays two key exponential moving averages — EMA 100 and EMA 200, both calculated from the daily (D) timeframe. These EMAs help traders identify long-term trend direction and potential support/resistance levels. The indicator plots both EMAs in purple to highlight key trend-following signals.

Ceres Trader Simple Trend & Momentum SignalsCeres Trader – Simple Trend & Momentum Signals
Description:
Cut through chart noise with a lightweight, two-factor signal system that combines a classic trend filter (200 EMA) with momentum confirmation (smoothed RSI as a QQE proxy). This indicator plots clean entry arrows—no background shading, no clutter—so you can trade only in the high-probability regime:
Trend Filter: 200-period exponential moving average
Momentum Filter: RSI(14) smoothed over N bars, offset by 50 to create a zero-line
Long Entry: Price above the 200 EMA and the smoothed RSI crosses up through zero → green up-arrow below bar
Short Entry: Price below the 200 EMA and the smoothed RSI crosses down through zero → red down-arrow above bar
Key Features:
Minimalist display: only the 200 EMA and entry arrows
Customizable inputs: EMA length, RSI length, RSI smoothing period
Ultra-low CPU load: suitable for lower timeframes (e.g. 1 min gold futures)
Yellow label text: for optimal visibility on dark or light chart backgrounds
How to Use:
Add the script to your TradingView chart.
Choose your timeframe and adjust inputs as needed.
Take only the long signals when price is above the EMA, and only the short signals when price is below.
Place stops just beyond the EMA; targets can be measured swings or fixed R-multiples.
Notes:
Designed as a regime-based entry filter—no exits or background fills included.
Feel free to combine with your own stop-loss, take-profit, and money-management rules.
Trade smarter, not harder—let the market tell you only when both trend and momentum align.

ZigZag PercentZigZag percentage is based on MT5 ZigZag indicator with the advantage of showing each move's percentage change.
Measuring the moves can help you predict future move sizes.

RSI + Price Cycle Predictor (Final Momentum Version)The RSI Cycle Predictor is a powerful indicator designed to help traders identify potential market reversals with precision.
How it works:
Detects confirmed swing highs and lows in the RSI, combined with price action.
Measures average time cycles between past reversals.
Uses momentum weakening as a filter to highlight only the strongest signals.
Displays a confidence score (σ) to show how reliable the timing is.
Trading logic:
Enter Buy (Long) when a green signal appears.
Exit Buy and Enter Sell (Short) when a red signal appears.
Alternate positions based on each signal, always holding one position.
Best for:
Swing traders
Cycle-based trading strategies
Enhancing timing precision in entries and exits

Risk Calculator (Correct % Based)This indicator helps you calculate how much you need to enter into a trade in order to have an accurate loss, i.e. your Risk management. After adding the indicator, click on it, a table opens where you need to enter arguments.
1. Position selection (long/short)
2. Entry point (the price of your entry into the transaction)
3. Stop loss (the point where your stop loss will be placed)
3. The risk of a trade (the amount of $ that you are willing to lose in case of a broken stop)
Click done and in the table you get the amount you need to enter into the transaction in order to get the desired loss...

GainzAlgo Standard// © GainzAlgo
//@version=5
indicator('GainzAlgo Standard', overlay=true, max_labels_count=500)
stable_candle = math.abs(close - open) / ta.tr > .5
rsi = ta.rsi(close, 14)
bullish_engulfing = close < open and close > open and close > open
rsi_below_50 = rsi < 50
decrease_over_5 = close < close
bull = bullish_engulfing and stable_candle and rsi_below_50 and decrease_over_5
bearish_engulfing = close > open and close < open and close < open
rsi_above_50 = rsi > 50
increase_over_5 = close > close
bear = bearish_engulfing and stable_candle and rsi_above_50 and increase_over_5
label.new(bull ? bar_index : na, low, 'BUY', color=color.rgb(0, 255, 8), style=label.style_label_up, textcolor=color.white, size=size.large)
label.new(bear ? bar_index : na, high, 'SELL', color=color.rgb(255, 0, 0), style=label.style_label_down, textcolor=color.white, size=size.large)


ADX Supertrend | [DeV]The "ADX Supertrend" indicator is a user-friendly tool that blends two popular trading indicators—the Supertrend and the Average Directional Index (ADX)—to help traders spot trends and make smarter trading decisions. By combining these two, it offers a clearer picture of when a market is trending strongly and in which direction, while cutting down on misleading signals. Here’s a straightforward explanation of how each part works, how they team up, the benefits of using them together, and why the ADX makes the Supertrend even better.
Supertrend:
It's like a guide that follows the market’s price movements to tell you whether prices are trending up or down. It creates two lines, one above and one below the price, based on how much the market is bouncing around (its volatility). When the price moves above the upper line, it signals an uptrend (a good time to buy), and the indicator draws a line below the price to show support. When the price drops below the lower line, it signals a downtrend (a potential time to sell), and the line appears above the price as resistance. The Supertrend is great because it adjusts to market conditions, widening the gap between lines in wild markets and tightening it in calm ones.
Average Directional Index:
The ADX is all about measuring how strong a trend is, without caring whether it’s going up or down. Think of it as a meter that tells you if the market is charging forward with purpose or just drifting aimlessly. It uses a scale from 0 to 100, where higher numbers mean a stronger trend. For example, an ADX above 25 often suggests a solid trend worth paying attention to, while a low ADX signals a sleepy, sideways market. The ADX also looks at whether buyers or sellers are in control to confirm the trend’s direction.
Confluence:
The Supertrend is great at spotting trends, but it can be a bit trigger-happy, giving signals in markets that aren’t really trending. That’s where the ADX shines. It acts like a quality control check, making sure the Supertrend’s signals only count when the market is moving with conviction. By filtering out weak or messy trends, the ADX helps you avoid wasting time on trades that fizzle out. It also double-checks the trend’s direction, so you’re not just guessing whether buyers or sellers are in charge. This teamwork means you get signals that are more reliable and less likely to lead you astray, especially in tricky markets where prices bounce around without a clear path.