Machine Learning: ARIMA + SARIMADescription
The ARIMA (Autoregressive Integrated Moving Average) and SARIMA (Seasonal ARIMA) are advanced statistical models that use machine learning to forecast future price movements. It uses autoregression to find the relationship between observed data and its lagged observations. The data is differenced to make it more predictable. The MA component creates a dependency between observations and residual errors. The parameters are automatically adjusted to market conditions.
Differences
ARIMA - This excels at identifying trends in the form of directions
SARIMA - Incorporates seasonality. It's better at capturing patterns previously seen
How To Use
1. Model: Determine if you want to use ARIMA (better for direction) or SARIMA (better for overall prediction). You can click on the 'Show Historic Prediction' to see the direction of the previous candles. Green = forecast ending up, red = forecast ending down
2. Metrics: The RMSE% and MAPE are 10 day moving averages of the first 10 predictions made at candle close. They're error metrics that compare the observed data with the predicted data. It is better to use them when they're below 8%. Higher timeframes will be higher, as these models are partly mean-reverting and higher TFs tend to trend more. Better to compare RMSE% and MAPE with similar timeframes. They naturally lag as data is being collected
3. Parameter selection: The simpler, the better. Both are used for ARIMA(1,1,1) and SARIMA(1,1,1)(1,1,1)5. Increasing may cause overfitting
4. Training period: Keep at 50. Because of limitations in pine, higher values do not make for more powerful forecasts. They will only criminally lag. So best to keep between 20 and 80
Statistics

Best SMA FinderThis script, Best SMA Finder, is a tool designed to identify the most robust simple moving average (SMA) length for a given chart, based on historical backtest performance. It evaluates hundreds of SMA values (from 10 to 1000) and selects the one that provides the best balance between profitability, consistency, and trade frequency.
What it does:
The script performs individual backtests for each SMA length using either "Long Only" or "Buy & Sell" logic, as selected by the user. For each tested SMA, it computes:
- Total number of trades
- Profit Factor (total profits / total losses)
- Win Rate
- A composite Robustness Score, which integrates Profit Factor, number of trades (log-scaled), and win rate.
Only SMA configurations that meet the user-defined minimum trade count are considered valid. Among all valid candidates, the script selects the SMA length with the highest robustness score and plots it on the chart.
How to use it:
- Choose the strategy type: "Long Only" or "Buy & Sell"
- Set the minimum trade count to filter out statistically irrelevant results
- Enable or disable the summary stats table (default: enabled)
The selected optimal SMA is plotted on the chart in blue. The optional table in the top-right corner shows the corresponding SMA length, trade count, Profit Factor, Win Rate, and Robustness Score for transparency.
Key Features:
- Exhaustive SMA optimization across 991 values
- Customizable trade direction and minimum trade filters
- In-chart visualization of results via table and plotted optimal SMA
- Uses a custom robustness formula to rank SMA lengths
Use cases:
Ideal for traders who want to backtest and auto-select a historically effective SMA without manual trial-and-error. Useful for swing and trend-following strategies across different timeframes.
📌 Limitations:
- Not a full trading strategy with position sizing or stop-loss logic
- Only one entry per direction at a time is allowed
- Designed for exploration and optimization, not as a ready-to-trade system
This script is open-source and built entirely from original code and logic. It does not replicate any closed-source script or reuse significant external open-source components.

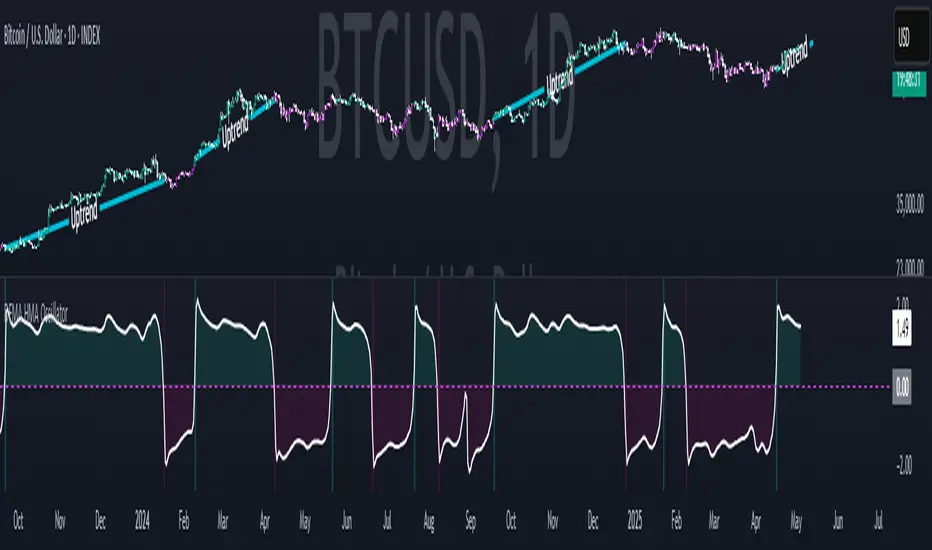
DEMA HMA Z-score OscillatorThis custom oscillator combines the power of the Hull Moving Average (HMA) with the Z-Score to identify momentum shifts and potential trend reversals. The Z-Score measures how far the current HMA is from its historical mean, helping to spot overbought or oversold conditions.
Uptrend: Long signals are generated when the Z-Score crosses above the defined Long Threshold.
Downtrend: Short signals are triggered when the Z-Score drops below the Short Threshold.
Visuals: The Z-Score is plotted along with background color changes and fills to clearly indicate trend strength. Green fills highlight uptrends, while pink fills indicate downtrends.
Alerts: Alerts are available for both long and short conditions based on Z-Score crossovers.
Customizable Inputs:
HMA Length
Smoothing Length (for DEMA)
Z-Score Length
Long and Short Thresholds
This indicator is ideal for detecting momentum shifts, confirming trend strength, and helping to time entry/exit points in your trading strategy.
Kassa Eröffnungskerze (z. B. DAX)This Pine Script automatically draws a horizontal line at the 09:00 CET open price every trading day. It’s designed for use on any timeframe – from 1-minute to daily – and is ideal for traders following European indices like the DAX (GER40) or EuroStoxx.
🛠 Features:
• Automatically detects the cash market open (09:00 CET)
• Works on all timeframes
• Uses Europe/Zurich timezone (CET/CEST)
• Draws a new line once per day at 09:00
• No repainting – consistent and reliable behavior
💡 Use Case:
Perfect for intraday and day traders who want to anchor their analysis to the official cash market open price. This level is often critical for observing volume spikes, trend initiations, or mean-reversion behavior during the European session.


The Echo System🔊 The Echo System – Trend + Momentum Trading Strategy
Overview:
The Echo System is a trend-following and momentum-based trading tool designed to identify high-probability buy and sell signals through a combination of market trend analysis, price movement strength, and candlestick validation.
Key Features:
📈 Trend Detection:
Uses a 30 EMA vs. 200 EMA crossover to confirm bullish or bearish trends.
Visual trend strength meter powered by percentile ranking of EMA distance.
🔄 Momentum Check:
Detects significant price moves over the past 6 bars, enhanced by ATR-based scaling to filter weak signals.
🕯️ Candle Confirmation:
Validates recent price action using the previous and current candle body direction.
✅ Smart Conditions Table:
A live dashboard showing all trade condition checks (Trend, Recent Price Move, Candlestick confirmations) in real-time with visual feedback.
📊 Backtesting & Stats:
Auto-calculates average win, average loss, risk-reward ratio (RRR), and win rate across historical signals.
Clean performance dashboard with color-coded metrics for easy reading.
🔔 Alerts:
Set alerts for trade signals or significant price movements to stay updated without monitoring the chart 24/7.
Visuals:
Trend markers and price movement flags plotted directly on the chart.
Dual tables:
📈 Conditions table (top-right): breaks down trade criteria status.
📊 Performance table (bottom-right): shows real-time stats on win/loss and RRR.🔊 The Echo System – Trend + Momentum Trading Strategy
Overview:
The Echo System is a trend-following and momentum-based trading tool designed to identify high-probability buy and sell signals through a combination of market trend analysis, price movement strength, and candlestick validation.
Key Features:
📈 Trend Detection:
Uses a 30 EMA vs. 200 EMA crossover to confirm bullish or bearish trends.
Visual trend strength meter powered by percentile ranking of EMA distance.
🔄 Momentum Check:
Detects significant price moves over the past 6 bars, enhanced by ATR-based scaling to filter weak signals.
🕯️ Candle Confirmation:
Validates recent price action using the previous and current candle body direction.
✅ Smart Conditions Table:
A live dashboard showing all trade condition checks (Trend, Recent Price Move, Candlestick confirmations) in real-time with visual feedback.
📊 Backtesting & Stats:
Auto-calculates average win, average loss, risk-reward ratio (RRR), and win rate across historical signals.
Clean performance dashboard with color-coded metrics for easy reading.
🔔 Alerts:
Set alerts for trade signals or significant price movements to stay updated without monitoring the chart 24/7.
Visuals:
Trend markers and price movement flags plotted directly on the chart.
Dual tables:
📈 Conditions table (top-right): breaks down trade criteria status.
📊 Performance table (bottom-right): shows real-time stats on win/loss and RRR.

Bitcoin Monthly Seasonality [Alpha Extract]The Bitcoin Monthly Seasonality indicator analyzes historical Bitcoin price performance across different months of the year, enabling traders to identify seasonal patterns and potential trading opportunities. This tool helps traders:
Visualize which months historically perform best and worst for Bitcoin.
Track average returns and win rates for each month of the year.
Identify seasonal patterns to enhance trading strategies.
Compare cumulative or individual monthly performance.
🔶 CALCULATION
The indicator processes historical Bitcoin price data to calculate monthly performance metrics
Monthly Return Calculation
Inputs:
Monthly open and close prices.
User-defined lookback period (1-15 years).
Return Types:
Percentage: (monthEndPrice / monthStartPrice - 1) × 100
Price: monthEndPrice - monthStartPrice
Statistical Measures
Monthly Averages: ◦ Average return for each month calculated from historical data.
Win Rate: ◦ Percentage of positive returns for each month.
Best/Worst Detection: ◦ Identifies months with highest and lowest average returns.
Cumulative Option
Standard View: Shows discrete monthly performance.
Cumulative View: Shows compounding effect of consecutive months.
Example Calculation (Pine Script):
monthReturn = returnType == "Percentage" ?
(monthEndPrice / monthStartPrice - 1) * 100 :
monthEndPrice - monthStartPrice
calcWinRate(arr) =>
winCount = 0
totalCount = array.size(arr)
if totalCount > 0
for i = 0 to totalCount - 1
if array.get(arr, i) > 0
winCount += 1
(winCount / totalCount) * 100
else
0.0
🔶 DETAILS
Visual Features
Monthly Performance Bars: ◦ Color-coded bars (teal for positive, red for negative returns). ◦ Special highlighting for best (yellow) and worst (fuchsia) months.
Optional Trend Line: ◦ Shows continuous performance across months.
Monthly Axis Labels: ◦ Clear month names for easy reference.
Statistics Table: ◦ Comprehensive view of monthly performance metrics. ◦ Color-coded rows based on performance.
Interpretation
Strong Positive Months: Historically bullish periods for Bitcoin.
Strong Negative Months: Historically bearish periods for Bitcoin.
Win Rate Analysis: Higher win rates indicate more consistently positive months.
Pattern Recognition: Identify recurring seasonal patterns across years.
Best/Worst Identification: Quickly spot the historically strongest and weakest months.
🔶 EXAMPLES
The indicator helps identify key seasonal patterns
Bullish Seasons: Visualize historically strong months where Bitcoin tends to perform well, allowing traders to align long positions with favorable seasonality.
Bearish Seasons: Identify historically weak months where Bitcoin tends to underperform, helping traders avoid unfavorable periods or consider short positions.
Seasonal Strategy Development: Create trading strategies that capitalize on recurring monthly patterns, such as entering positions in historically strong months and reducing exposure during weak months.
Year-to-Year Comparison: Assess how current year performance compares to historical seasonal patterns to identify anomalies or confirmation of trends.
🔶 SETTINGS
Customization Options
Lookback Period: Adjust the number of years (1-15) used for historical analysis.
Return Type: Choose between percentage returns or absolute price changes.
Cumulative Option: Toggle between discrete monthly performance or cumulative effect.
Visual Style Options: Bar Display: Enable/disable and customize colors for positive/negative bars, Line Display: Enable/disable and customize colors for trend line, Axes Display: Show/hide reference axes.
Visual Enhancement: Best/Worst Month Highlighting: Toggle special highlighting of extreme months, Custom highlight colors for best and worst performing months.
The Bitcoin Monthly Seasonality indicator provides traders with valuable insights into Bitcoin's historical performance patterns throughout the year, helping to identify potentially favorable and unfavorable trading periods based on seasonal tendencies.

BTC vs ALT Lag Detector [MEXC Overlay]This indicator monitors the price movement of Bitcoin (BTC) and compares it in real time to a customizable list of major altcoins on the MEXC exchange.
It helps you identify lagging altcoins — tokens that are underperforming or overperforming BTC’s price action over a selected timeframe. These temporary deviations can offer profitable entry or rotation opportunities, especially for scalpers, day traders, and arbitrage-style strategies.
Key Features:
- Real-time deviation detection between BTC and altcoins
- Customizable comparison timeframe: 1m, 6m, 12m, 30m, 1h, 4h, or 1d
- Deviation threshold alert: Highlights coins that lag BTC by more than 0.5%, 1%, 2%, or 3%
- Compact stats table embedded in the price chart
- Fully adjustable layout: Table position (Top/Bottom/Center + Left/Right), Font size (Tiny, Small, Medium)
- Built-in alert system when deviation exceeds your chosen threshold
How to Use It:
Set your desired timeframe for comparison (e.g., 1 hour).
Select a deviation threshold (e.g., 1.0%).
The table will show:
Each altcoin’s % change
BTC’s % change
The delta (deviation) vs BTC
Red highlights indicate alts whose deviation exceeded the threshold.
When at least one alt lags beyond your threshold, the indicator can trigger an alert — helping you capitalize on potential catch-up trades.
Please provide any feedback on it.

Morning & EOD ReportThis is not financial advice, nor meant to influence anyone's trading strategies.
Please use at your discretion and if you decide to give this indicator a shot, please leave some feedback if there could be changes made to the intervals or if there any other necessary changes to make
As you can see, this indicator provides a detailed morning report on all timeframes. Also, when you switch to the 15 minute time interval you are able to see an EOD report as well. These both print after collecting enough data based on key indicators within a designated time frame.
The reports will provide short-term data showing whether the stock price is above or below VWAP, as well as if the MACD and RSI are trending upwards or downwards. This is the code that builds the model and signal:
= ta.macd(close, 12, 26, 9)
rsiST = ta.rsi(close, 14)
vwapST = ta.vwap
priceAboveVWAP = close > vwapST
macdBullish = macdST > signalST
rsiBullish = rsiST > 50
The long-term uses a mid/daily time frame and analyzes key indicators like MACD, RSI, PMO, SMA on a 50 day moving average, and if price is above or below VWAP. These indicators allow the model to display BUY Signal Active, SELL Signal Active, or Neutral. Along with this, it also tracks price change percentage and can indicate whether volume is normal or if there has been a spike detected. The code that makes all this possible is listed below:
= request.security(syminfo.tickerid, "D", ta.macd(close, 12, 26, 9))
rsiD = request.security(syminfo.tickerid, "D", ta.rsi(close, 14))
pmo = request.security(syminfo.tickerid, "D", ta.ema(ta.roc(close, 1), 35))
pmoSMA = request.security(syminfo.tickerid, "D", ta.sma(ta.ema(ta.roc(close, 1), 35), 10))
priceAboveSMA50 = close > ta.sma(close, 50)
buySignalD = macdD > signalD and rsiD > 50 and pmo > pmoSMA and priceAboveSMA50
sellSignalD = macdD < signalD and rsiD < 50 and pmo < pmoSMA and not priceAboveSMA50
// --- % CHANGE FROM OPEN ---
sessionOpen = request.security(syminfo.tickerid, "D", open)
pctChange = ((close - sessionOpen) / sessionOpen) * 100
// --- Volume Spike Detection ---
avgVol = ta.sma(volume, 20)
volSpike = volume > avgVol * 1.5

Float LabelFloat label
Float label is simply a label that will display the float (number of shares that are publicly available for trading on the open market) for the ticker currently open in the chart.
Very handy for trading smaller cap names.
Currently working on a complete low float label to replace this.

Sessioni di Trading - Londra & New YorkIndicator for mechanics 3.0 marking the London and New York sessions with vertical dotted lines

Sessioni di Trading - Londra & New YorkMarks the London and New York trading sessions with vertical colored lines (Mechanics 3.0)

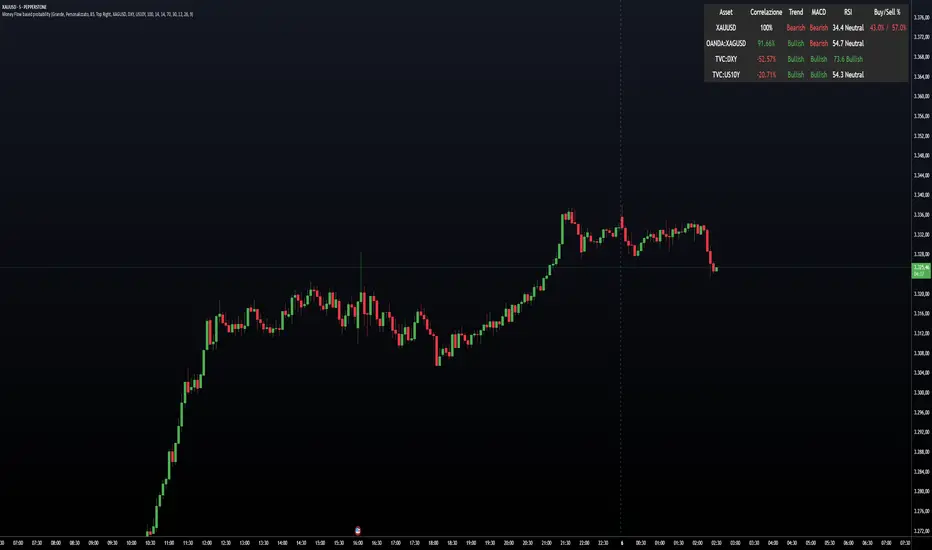
Money Flow based probabilityMoney Flow based probability
This indicator provides a comprehensive correlation and momentum analysis between your main asset and up to three selected correlated assets. It combines correlation, trend, momentum, and overbought/oversold signals into a single, easy-to-read table directly on your chart.
Correlated Asset Selection :
You can select up to three correlated assets (e.g., indices, currencies, bonds) to compare with your main chart symbol. Each asset can be toggled on or off.
Correlation Calculation :
The indicator uses the native Pine Script ta.correlation function to measure the statistical relationship between the closing prices of your asset and each selected pair over a user-defined period.
Technical Analysis Integration :
For each asset (including the main one), the indicator calculates:
Trend direction using EMA (Exponential Moving Average) – optional
Momentum using MACD – optional
Overbought/oversold status using RSI – optional
Probability Scoring :
A weighted scoring system combines correlation, trend, MACD, RSI, and trend exhaustion signals to produce buy and sell probabilities for the main asset.
Visual Table Output :
A customizable table is displayed on the chart, showing:
Asset name
Correlation (as a percentage, -100% to +100%)
Trend (Bullish/Bearish)
MACD status (Bullish/Bearish)
RSI value and status
Buy/Sell probability (with fixed-width formatting for stability)
User Customization :
You can adjust:
Table size, color, and position
Correlation period
EMA, MACD, and RSI parameters
Which assets to display
This indicator is ideal for traders who want to quickly assess the influence of major correlated markets and technical signals on their trading instrument, all in a single glance.
---
Example: Correlation Calculation
corrCurrentAsset1 = ta.correlation(close, asset1Data, correlationPeriod)
Example: Table Output (Buy/Sell %)
buyStr = f_formatPercent(buyProbability) + "%"
sellStr = f_formatPercent(sellProbability) + "%"
cellStr = buyStr + " / " + sellStr
SPY, NQ, SPX, ES Live Prices (Customizable)This indicator lets you see the most popular S&P tickers on any chart.
Currently shows SPY, NQ, SPX, and ES

ORB Strategy w/ Volume Confirmation & EMAsORB breakout within 15 minutes of the NY open. Uses EMA indicators to show strength in trend.

Ticker DataThis script mostly for Pine coders but may be useful for regular users too.
I often find myself needing quick access to certain information about a ticker — like its full ticker name, mintick, last bar index and so on. Usually, I write a few lines of code just to display this info and check it.
Today I got tired of doing that manually, so I created a small script that shows the most essential data in one place. I also added a few extra fields that might be useful or interesting to regular users.
Description for regular users (from Pine Script Reference Manual)
tickerid - full ticker name
description - description for the current symbol
industry - the industry of the symbol. Example: "Internet Software/Services", "Packaged software", "Integrated Oil", "Motor Vehicles", etc.
country - the two-letter code of the country where the symbol is traded
sector - the sector of the symbol. Example: "Electronic Technology", "Technology services", "Energy Minerals", "Consumer Durables", etc.
session - session type (regular or extended)
timezone - timezone of the exchange of the chart
type - the type of market the symbol belongs to. Example: "stock", "fund", "index", "forex", "futures", "spread", "economic", "fundamental", "crypto".
volumetype - volume type of the current symbol.
mincontract - the smallest amount of the current symbol that can be traded
mintick - min tick value for the current symbol (the smallest increment between a symbol's price movements)
pointvalue - point value for the current symbol
pricescale - a whole number used to calculate mintick (usually (when minmove is 1), it shows the resolution — how many decimal places the price has. For example, a pricescale 100 means the price will have two decimal places - 1 / 100 = 0.01)
bar index - last bar index (if add 1 (because indexes starts from 0) it will shows how many bars available to you on the chart)
If you need some more information at table feel free to leave a comment.

Reverse Keltner Channel StrategyReverse Keltner Channel Strategy
Overview
The Reverse Keltner Channel Strategy is a mean-reversion trading system that capitalizes on price movements between Keltner Channels. Unlike traditional Keltner Channel strategies that trade breakouts, this system takes the contrarian approach by entering positions when price returns to the channel after overextending.
Strategy Logic
Long Entry Conditions:
Price crosses above the lower Keltner Channel from below
This signals a potential reversal after an oversold condition
Position is entered at market price upon signal confirmation
Long Exit Conditions:
Take Profit: Price reaches the upper Keltner Channel
Stop Loss: Placed at half the channel width below entry price
Short Entry Conditions:
Price crosses below the upper Keltner Channel from above
This signals a potential reversal after an overbought condition
Position is entered at market price upon signal confirmation
Short Exit Conditions:
Take Profit: Price reaches the lower Keltner Channel
Stop Loss: Placed at half the channel width above entry price
Key Features
Mean Reversion Approach: Takes advantage of price tendency to return to mean after extreme moves
Adaptive Stop Loss: Stop loss dynamically adjusts based on market volatility via ATR
Visual Signals: Entry points clearly marked with directional triangles
Fully Customizable: All parameters can be adjusted to fit various market conditions
Customizable Parameters
Keltner EMA Length: Controls the responsiveness of the channel (default: 20)
ATR Multiplier: Determines channel width/sensitivity (default: 2.0)
ATR Length: Affects volatility calculation period (default: 10)
Stop Loss Factor: Adjusts risk management aggressiveness (default: 0.5)
Best Used On
This strategy performs well on:
Currency pairs with defined ranging behavior
Commodities that show cyclical price movements
Higher timeframes (4H, Daily) for more reliable signals
Markets with moderate volatility
Risk Management
The built-in stop loss mechanism automatically adjusts to market conditions by calculating position risk relative to the current channel width. This approach ensures that risk remains proportional to potential reward across varying market conditions.
Notes for Optimization
Consider adjusting the EMA length and ATR multiplier based on the specific asset and timeframe:
Lower values increase sensitivity and generate more signals
Higher values produce fewer but potentially more reliable signals
As with any trading strategy, thorough backtesting is recommended before live implementation.
Past performance is not indicative of future results. Always practice sound risk management.

Weekday Signal [QuantAlchemy]The modified "Weekday Signal " Pine Script enhances the original by expanding from one entry and one exit condition to six independent entry and six independent exit conditions, each with its own weekdays, trading session, and time zone. While the original used a single time zone and produced one enter and one exit signal, the updated script maintains single enter and exit outputs by combining the six conditions for each using logical OR, ensuring compatibility with automated strategies. It retains the original’s main chart overlay, green/red backgrounds for entry/exit signals, and signal exposure for external scripts, aligning with the initial visualization and integration capabilities.

Position Size Calculator with Compound EarningsContracts = (Account × Risk%) ÷ (Stop Distance × $2.00 for MNQ)
with compounddaily.org

Central Bank Assets YoY % with StdDev BandsCentral Bank Assets YoY % with StdDev Bands - Indicator Documentation
Overview
This indicator tracks the year-over-year (YoY) percentage change in combined central bank assets using a custom formula. It displays the annual growth rate along with statistical bands showing when the growth is significantly above or below historical norms.
Formula Components
The indicator is based on a custom symbol combining multiple central bank balance sheets:
Federal Reserve balance sheet (FRED)
Bank of Japan assets converted to USD (FX_IDC*FRED)
European Central Bank assets converted to USD (FX_IDC*FRED)
Subtracting Fed reverse repo operations (FRED)
Subtracting Treasury General Account (FRED)
Calculations
Year-over-Year Percentage Change: Calculates the percentage change between the current value and the value from exactly one year ago (252 trading days).
Formula: ((current - year_ago) / year_ago) * 100
Statistical Measures:
Mean (Average): The 252-day simple moving average of the YoY percentage changes
Standard Deviation: The 252-day standard deviation of YoY percentage changes
Display Components
The indicator displays:
Main Line: YoY percentage change (green when positive, red when negative)
Zero Line: Reference line at 0% (gray dashed)
Mean Line: Average YoY change over the past 252 days (blue)
Standard Deviation Bands: Shows +/- 1 standard deviation from the mean
Upper band (+1 StdDev): Green, line with breaks style
Lower band (-1 StdDev): Red, line with breaks style
Interpretation
Values above zero indicate YoY growth in central bank assets
Values below zero indicate YoY contraction
Values above the +1 StdDev line indicate unusually strong growth
Values below the -1 StdDev line indicate unusually severe contraction
Crossing above/below the mean line can signal shifts in central bank policy trends
Usage
This indicator is useful for:
Monitoring global central bank liquidity trends
Identifying unusual periods of balance sheet expansion/contraction
Analyzing correlations between central bank activity and market performance
Anticipating potential market impacts from changes in central bank policy
The 252-day lookback period (approximately one trading year) provides a balance between statistical stability and responsiveness to changing trends in central bank behavior.

Engulfing Bar Liquidity SweepIts an indicator that sweeps liquidity before going to the opposite direction.

Z-Score Trend Monitor [EdgeTerminal]The Z-Score Trend Monitor measures how far the short-term moving average deviates from the long-term moving average using the spread difference of the two — in standardized units. It’s designed to detect overextension, momentum exhaustion, and potential mean-reversion points by converting the spread between two moving averages into a normalized Z-score and tracking its change and direction over time.
The idea behind this is to catch the changes in the direction of a trend earlier than the usual and lagging moving average lines, allowing you to react faster.
The math behind the indicator itself is very simple. We take the simple moving average of the spread between a long term and short term moving average, and divide it by the difference between the spread and spread mean.
This results in a relatively accurate and early acting trend detector that can easily identify overbought and oversold levels in any timeframe. From our own testing, we recommend using this indicator as a trend confirmation tool.
How to Use It:
Keep an eye on the Z-Score or the blue line. When it goes over 2, it indicates an overbought or near top level, and when it goes below -2, it indicates an oversold or near bottom.
When Z-Score returns to zero or grey line, it suggests mean reversion is in progress.
You can also change the Z-Score criteria from 2 and -2 in the settings to any number you’d like for tighter or wider levels.
For scalping and fast trading setups, we recommend shorter SMAs, such as 5 and 20, and for longer trading setups such as swing trades, we recommend 20 and 100.
Settings:
Short SMA: Lookback period of short term simple moving average for the lower side of the SMA spread.
Short Term Weight: Additional weight or multiplier to suppress the short term SMA calculation. This is used to refine the SMA calculation for more granular and edge cases when needed, usually left at 1, meaning it will take the entire given value in the short SMA field.
Long SMA: Lookback period of long term simple moving average for the upper side of the SMA spread.
Long Term Weight: Additional weight or multiplier to suppress the long term SMA calculation. This is used to refine the long SMA calculation for more granular and edge cases when needed, usually left at 1, meaning it will take the entire given value in the long SMA field.
Z-Score Threshold: The threshold for upper (oversold) and lower (overbought) levels. This can also be set individually from the style page.
Z-Score Lookback Window: The lookback period to calculate spread mean and spread standard deviation

Position Size Calculator with Compound EarningsDoes compounddaily.org functions and calculates position sizing based on
Contracts = (Account × Risk%) ÷ (Stop Distance × $2.00 for MNQ)
