Position Size Calculator with Auto SymbolPosition sizing
Position Size = (Account × Risk%) ÷ (Stop Distance × $ Per Point)
Statistics

Daily Breakout + Daily Shadow By RouroThis script is a Pine v5 strategy designed to detect daily candle body breakouts and execute them on any intraday timeframe, while also providing:
Daily Data Retrieval
Using request.security(..., "D", ...) it fetches the OHLC and timestamp of the daily candle, regardless of the chart’s current timeframe.
Calculation of Yesterday’s and Day-Before-Yesterday’s Bodies
b1High and b1Low → the high/low of yesterday’s daily candle body
b2High and b2Low → the high/low of the previous day’s body
Detection of the First Intraday Bar After a New Day
By using ta.change(time("D")), it marks the start of each new trading day.
Drawing the Previous Day’s “Shadow” on the Chart
It overlays a box (box.new) and two wick lines (line.new) with configurable colors and transparency, so you can clearly see the full range of yesterday’s candle on any intraday chart.
Automatic End-of-Day Position Closure
It will automatically close any open position at the start of the next day to avoid unintended rollovers.
Entry Signals
On the very first intraday bar after the daily close:
Long if yesterday’s close broke above the body of the day before yesterday
Short if yesterday’s close broke below the body of the day before yesterday
…which triggers a strategy.entry at the intraday open.
Fully Customizable Stop-Loss and Take-Profit
SL options:
Opposite end of yesterday’s body
Fixed pips from entry
A risk-reward ratio on yesterday’s wick
Optional “safety SL” in fixed pips that overrides the above
TP options:
Fixed pips
Yesterday’s wick extreme (high/low)
Partial exit on the wick (TP1), then second exit (TP2) either:
At a multiplied RR
Or at the daily close (“Close of Day”)
You can also choose to move SL to breakeven after TP1 is hit.
Live Metrics Table
In the upper-right corner it displays in real time:
Start of backtest (date of first trade)
Number of ✅ Winning trades and ❌ Losing trades
Total number of trades
Win rate (%)
Profit Factor
All within a fixed table layout so it never runs out of rows or columns.

True Strength Index (TSI)%📌 Script Name: TSI Percentuale
This script is a custom True Strength Index (TSI) indicator that expresses momentum strength as a percentage from 0% to 100%, instead of the traditional TSI scale.
✅ What the Script Does
Calculates the standard TSI:
Uses double exponential smoothing of price changes and their absolute values.
Formula:
TSI_raw
=
100
×
DoubleSmoothed(ΔPrice)
DoubleSmoothed(|ΔPrice|)
TSI_raw=100×
DoubleSmoothed(|ΔPrice|)
DoubleSmoothed(ΔPrice)
Normalizes TSI to a percentile scale:
Over a user-defined lookback period, the script finds the lowest and highest TSI values.
It then rescales the current TSI to a value between 0% (minimum) and 100% (maximum).
50% represents neutral momentum (i.e., "flat").
Plots the result:
tsi_percent is plotted as a blue line.
Horizontal dashed/dotted lines are drawn at:
0% → strong downward momentum
50% → neutral
100% → strong upward momentum
⚙️ Inputs
Long Length: Long EMA smoothing period (default: 25)
Short Length: Short EMA smoothing period (default: 13)
Signal Length: (not used in this version, can be removed or extended)
Lookback Period: Number of bars to calculate min/max normalization (default: 100)
🧠 Why Use This Indicator
The classic TSI ranges around and can be hard to interpret.
This version makes TSI visually intuitive by converting it to percentile form, allowing easier comparison of momentum strength across time and instruments.
It’s particularly useful for defining zones like:
Above 70% = strong bullish
Below 30% = strong bearish

Daily ATR Bonanza: Expected Moves - Tr33man Daily ATR Bonanza: Expected Moves
Overview 🤷♂️
The Daily ATR Bonanza script is a powerful trading tool designed to help traders visualize and understand potential price movements using the Average True Range (ATR). It provides daily and weekly ATR levels, historical statistics, and conditional probability analysis to give traders actionable insights. The script also plots the daily Keltner channel. This script is ideal for traders who want to gauge volatility, identify key levels, and make data-driven decisions.
b]Key Features:
📈 1. Daily and Weekly ATR Levels
🔵ATR Levels: The script calculates and displays ATR-based levels for the day and week. These levels are derived from the previous day's or week's close price and are adjusted using customizable multipliers (0.5x, 1x, and 1.5x by default).
🔵You can choose the number of ATR levels (1, 2, or 3) and adjust the multipliers to suit your trading strategy.
🌐 2. ATR Bands (Keltner Channels)
🔵The script includes an option to display ATR Bands, which are volatility-based envelopes around a moving average. These bands help identify overbought and oversold conditions.
🔵You can adjust the ATR multiplier and the length of the moving average used for the bands.
🧮 3. Historical Statistics and Conditional Probability
🔵 Historical Analysis: The script analyzes historical price movements to calculate the likelihood of closing at certain ATR levels.
🔵 Conditional Probability: This feature shows the probability of the price reaching specific ATR levels given the current market conditions. The conditional matches historical data by an open in the same opening ATR bucket, as well as the current price bucket having been visited in the historical case. Conditional probabilities are just statistics, and do not predict anything.
Data Table: 📚
🔵 Historical Close Probability: The percentage of days the price closed within each ATR level.
🔵 Conditional Close Probability: The likelihood of the price closing within each ATR level today.
❓ What is Conditional Probability? ❓
Conditional probability is a statistical measure that calculates the likelihood of an event occurring given that another event has already occurred. In this script, it is used to determine the probability of the price reaching specific ATR levels based on the current opening range as well as current ATR distance from the previous close.
For example:
If the market opens near the lower end of the first ATR level, the script calculates the likelihood of the price reaching the upper end of the first, second, or third ATR level.
This analysis is based on historical data, making it a powerful tool for understanding potential price movements.
🌟 Understanding the Levels
🔵Daily Levels: These are based on the previous day's close price and ATR. They are updated at the start of each new day.
🔵Weekly Levels: These are based on the previous week's close price and ATR. They are updated at the start of each new week.
🔵ATR Bands: These are dynamic levels that adjust with market volatility.
🔬 Analyze the Statistics (Daily only for now, no weekly yet)
🔵Use the interactive table to understand historical probabilities and conditional probabilities.
🔵Focus on the current opening range and the likelihood of reaching specific levels.
🧠 Make Trading Decisions
🔵Use the ATR levels and bands to identify key support and resistance levels.
🔵Use the conditional probability table to gauge the likelihood of reaching specific targets.
🔵Adjust your strategy based on the historical performance of the market.
Example Use Cases
1. Day Trading
Use the daily ATR levels to set intraday targets and stop-loss levels.
Monitor the conditional probability table to adjust your expectations based on the opening range.
2. Swing Trading
Use the weekly ATR levels to identify longer-term support and resistance levels.
3. Scalping
Use the ATR bands to identify overbought and oversold conditions.
Use the conditional probability table to quickly assess the likelihood of price movements.

ETF Builder & Backtest System [TradeDots]Create, analyze, and monitor your own custom “ETF-like” portfolio directly on TradingView. This script merges up to 10 different assets with user-defined weightings into a single composite chart, allowing you to see how your personalized portfolio would have performed historically. It is an original tool designed to help traders and investors quickly gauge risk and return profiles without leaving the TradingView platform.
📝 HOW IT WORKS
1. Custom Portfolio Construction
Multiple Assets : Combine up to 10 different stocks, ETFs, cryptocurrencies, or other symbols.
User-Defined Weights : Allocate each asset a percentage weight (e.g., 15% in AAPL, 10% in MSFT, etc.).
Single Composite Value : The script calculates a weighted “ETF-style” price, effectively simulating a merged portfolio curve on your chart.
2. Performance Tracking & Return Analysis
Automatic History Capture : The indicator records each asset’s starting price when it first appears in your chosen date range.
Rolling Updates : As time progresses, all asset prices are continually evaluated and the portfolio value is updated in real time.
Buy & Hold Returns : See how each asset—and the overall portfolio—performed from the “start” date to the most recent bar.
Annualized Return : Automatically calculates CAGR (Compound Annual Growth Rate) to help visualize performance over varying timescales.
3. Table & Visual Output
Performance Table : A comprehensive table displays individual asset returns, annualized returns, and portfolio totals.
Normalized Chart Plot : The composite ETF value is scaled to 100 at the start date, making it easy to compare relative growth or decline.
Optional Time Filter : You can define a specific date range (Start/End Dates) to focus on a particular period or to limit historical data.
⚙️ KEY FEATURES
1. Flexible Asset Selection
Choose any symbols from multiple asset classes. The script will only run calculations when data is available—no need to worry about missing quotes.
2. Dynamic Table Reporting
Start Price for each asset
Percentage Weight in the portfolio
Total Return (%) and Annualized Return (%)
3. Simple Backtesting Logic
This script takes a straightforward Buy & Hold perspective. Once the start date is reached, the portfolio remains static until the end date, so you can quickly assess hypothetical growth.
4. Plot Customization
Toggle the main “ETF” plot on/off.
Alter the visual style for tables and text.
Adjust the time filter to limit or extend your performance measurement window.
🚀 HOW TO USE IT
1. Add the Script
Search for “ETF Builder & Backtest System ” in the Indicators & Strategies tab or manually add it to your chart after saving it in your Pine Editor.
2. Configure Inputs
Enable Time Filter : Choose whether to restrict the analysis to a particular date range.
Start & End Date : Define the period you want to measure performance over (e.g., from 2019-12-31 to 2025-01-01).
Assets & Weights : Enter each symbol and specify a percentage weight (up to 10 assets).
Display Options : Pick where you want the Table to appear and choose background/text colors.
3. Interpret the Table & Plots
Asset Rows : Each asset’s ticker, weighting, start price, and performance metrics.
ETF Total Row : Summarizes total weighting, composite starting value, and overall returns.
Normalized Plot : Tracks growth/decline of the combined portfolio, starting at 100 on the chart.
4. Refine Your Strategy
Compare how different weights or a new mix of assets would have performed over the same period.
Assess if certain assets contribute disproportionately to your returns or volatility.
Use the results to guide allocations in your real trading or paper trading accounts.
❗️LIMITATIONS
1. Buy & Hold Only
This script does not handle rebalancing or partial divestments. Once the portfolio starts, weights remain fixed throughout the chosen timeframe.
2. No Reinvestment Tracking
Dividends or other distributions are not factored into performance.
3. Data Availability
If historical data for a particular asset is unavailable on TradingView, related results may display as “N/A.”
4. Market Regimes & Volatility
Past performance does not guarantee similar future behavior. Markets can change rapidly, which may render historical backtests less predictive over time.
⚠️ RISK DISCLAIMER
Trading and investing carry significant risk and can result in financial loss. The “ETF Builder & Backtest System ” is provided for informational and educational purposes only. It does not constitute financial advice.
Always conduct your own research.
Use proper risk management and position sizing.
Past performance does not guarantee future results.
This script is an original creation by TradeDots, published under the Mozilla Public License 2.0.
Use this indicator as part of a broader trading or investment approach—consider fundamental and technical factors, overall market context, and personal risk tolerance. No trading tool can assure profits; exercise caution and responsibility in all financial decisions.

ICT Macro H1 v2"H1 Candle Time Box" is a custom TradingView indicator that highlights a configurable time window surrounding the close of each 1-hour (H1) candle. The indicator draws a transparent box 15 minutes before and after each H1 candle close (by default), helping traders visualize time-based reaction zones.
🔍 Features:
Custom time window: Users can set how many minutes before and after the H1 close the box should appear.
Dynamic positioning: Boxes are drawn slightly above the candles to avoid overlap with price bars.
Live time labels: Each box displays its time range (e.g., "08:45 - 09:15") based on the start and end time of the zone.
Auto-cleaning: Only a limited number of recent boxes (default: 5) are shown, keeping the chart clean.
Requires 1-minute chart for precise timing.
This tool is especially helpful for intraday traders to identify areas of interest or market reactions before and after key hourly closes.

ICT Macro H1"H1 Candle Time Box" is a custom TradingView indicator that highlights a configurable time window surrounding the close of each 1-hour (H1) candle. The indicator draws a transparent box 15 minutes before and after each H1 candle close (by default), helping traders visualize time-based reaction zones.
🔍 Features:
Custom time window: Users can set how many minutes before and after the H1 close the box should appear.
Dynamic positioning: Boxes are drawn slightly above the candles to avoid overlap with price bars.
Live time labels: Each box displays its time range (e.g., "08:45 - 09:15") based on the start and end time of the zone.
Auto-cleaning: Only a limited number of recent boxes (default: 5) are shown, keeping the chart clean.
Requires 1-minute chart for precise timing.
This tool is especially helpful for intraday traders to identify areas of interest or market reactions before and after key hourly closes.

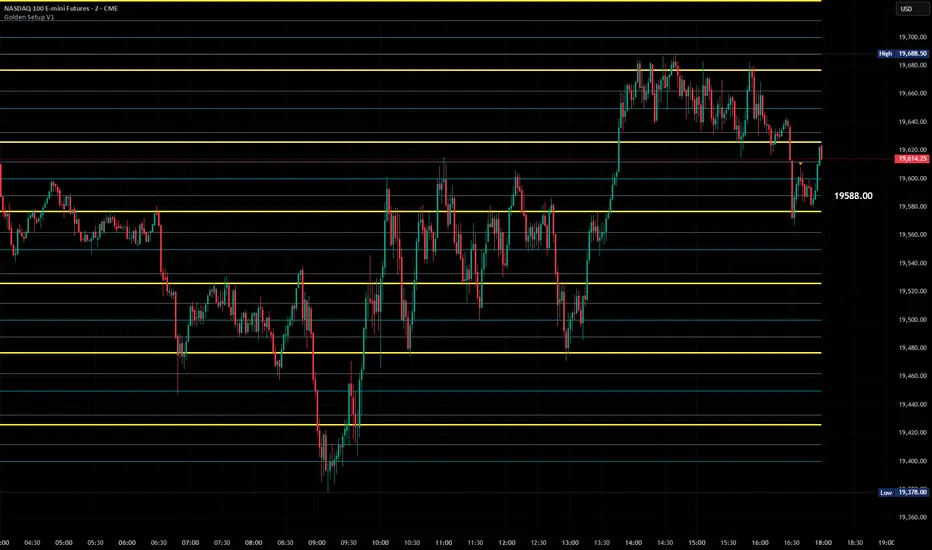
Golden Setup V1Golden Setup V1 is an overlay indicator that automates Tony Rago’s “Golden Setup” price-level framework. It divides the chart into fixed “blockSize” intervals (default 100 points) and plots a series of key horizontal levels within each block—levels at 00, 12, 26, 33, 50, 62, 77 and 88 offsets. These levels act as dynamic support and resistance grids that roll up or down as price moves between blocks.
Key Features
Customizable Offsets
Define eight offset levels corresponding to Rago’s Golden Setup:
00 (Round Number)
12 (Target 12)
26 (First “Golden” level)
33 (Target 33)
50 (Mid-block pivot)
62 (Target 62)
77 (Second “Golden” level)
88 (Target 88)
Multi-Block Coverage
Choose how many blocks above and below the current 100-point block you wish to display, so you always have levels drawn for the surrounding price range.
Golden-Only Filter
A handy toggle lets you show only the two “Golden” offsets (26 & 77), which many traders prioritize for high-probability bounce or breakout areas.
Dynamic Nearest-Level Label
Highlights the closest Golden Setup level (to the right edge of the chart) with a movable label, so you always know which level price is approaching.
Full Styling Control
Customize line colors, widths, block size, label fonts and opacity to suit your charting style.
How It Works
Block Calculation
On each bar, the indicator computes the “current block” by flooring (close / blockSize) and multiplying back by blockSize.
Level Offsets
It adds each of the eight user-defined offsets to that block base (and, if price has moved below the lowest offset, shifts the block down one interval).
Drawing
Each level is drawn as a horizontal line extending across the chart for as many blocks above/below as you select.
Nearest-Level Detection
Within the present block, it calculates which of the plotted levels is closest to price and displays that value on the right edge.
Usage Tips
Use the Golden-Only filter to declutter and focus solely on the 26 & 77 levels, which often act as strong intra-block pivot points.
Combine with volume or momentum indicators to confirm bounces at these levels.
Adjust blockSize (e.g. 50 or 200) if you wish to work in smaller or larger price increments.
⚠️ Disclaimer: This script is for educational and illustrative purposes only. Trading involves risk—always back-test and validate any strategy on a demo account before going live.
DECODE M2 Global Liquidity IndexThe most comprehensive M2 indicator on Trading View.
- Custom lead setting (days)
- Data sources for the 20 largest economies
- Only selected sources are loaded for efficiency
- Automatic multi-timeframe recalculation

DCA Strategy TesterBacktest DCA method. Choose start and end date, monthly amount and see graph, buys orders and stats.

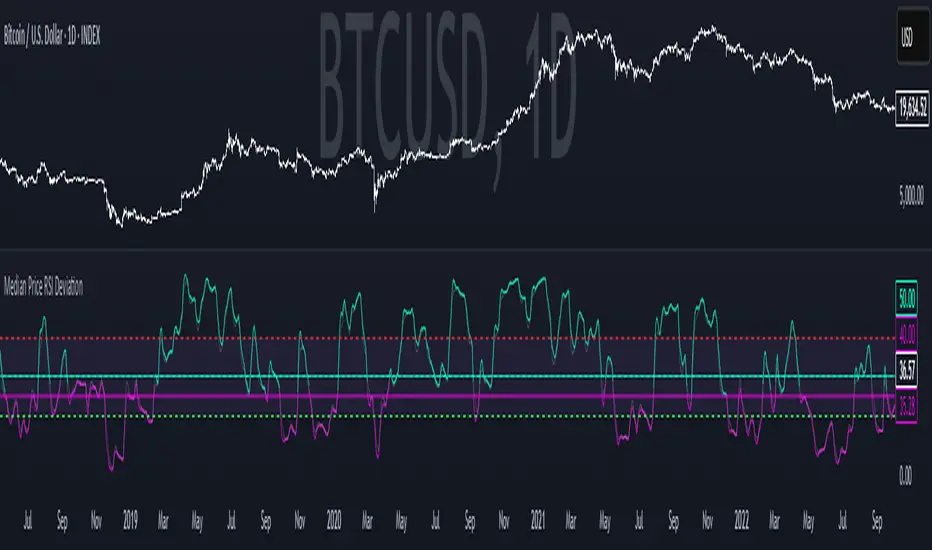
Median Price RSI DeviationThis indicator is a smoothed RSI-based trend filter that combines median price smoothing, customizable moving averages, and standard deviation bands to identify bullish or bearish conditions:
=> It first smooths price using a median filter.
=> Then it calculates RSI on that smoothed price.
=> The RSI is further smoothed using a selectable moving average (e.g., DEMA, EMA).
=> Standard deviation bands are applied around this smoothed RSI.
Signals:
=> A bullish signal is triggered when the upper band exceeds a long threshold (default 50).
=> A bearish signal occurs when the smoothed RSI drops below a short threshold (default 40).
Hippo Battlefield - Bulls VS Bears 20 bars## Hippo Battlefield – Bulls VS Bears (20 Bars)
**What it is**
A multi-dimensional momentum-and-sentiment oscillator that combines classic Bull/Bear Power with ATR- or peak-normalization, then layers on RSI and MACD-derived metrics into:
1. **A colored bar series** showing net Bull+Bear Power strength over the last 20 bars,
2. **A dynamic table** of each of those 20 BBP values (grouped into four 5-bar “quartals”), with symbols, per-bar change, and rolling averages, and
3. **A composite “Weighted BBP” histogram** blending normalized RSI, MACD, and BBP into a single view.
---
### Key Inputs
- **Length (EMA)** – look-back for the underlying EMA (default 60)
- **Normalization Length** – look-back window for peak-normalization (default 60)
- **Use ATR for Norm.** – toggle ATR-based normalization vs. highest-abs(BBP)
- **Show Tables** – toggle the bottom-right 21×11 grid of raw and average BBP values
---
### What You See
#### 1. Colored Bars (Overlay = false)
- Bars are colored by normalized BBP intensity:
- Extreme Bull (≥+10): deep blue
- Strong Bull (+5 to +10): green/yellow
- Weak Bull (+0 to +5): dark green
- Weak Bear (–0 to –5): dark red
- Strong Bear (–5 to –10): pink/red
- Extreme Bear (<–10): magenta
#### 2. Bottom-Right Table (20 Bars of Data)
- Divided into four columns (0–4, 5–9, 10–14, 15–19 bars ago) and one “average” row.
- Each cell shows:
1. Bar index (1–20),
2. Normalized BBP value (to four decimals),
3. Direction symbol (↑/↓/=),
4. Bar-to-bar change (± value),
5. A separator “|”.
- At the very bottom, each column’s 5-bar average is displayed as “Avg: X.XXXX” with a dot marker.
#### 3. Top-Center Mini-Table
- When ≥20 bars have elapsed, shows the date at 20 bars ago and the average BBP across the full 20-bar window.
#### 4. Normalized RSI Line
- Rescales the classic 14-period RSI into a –20…+20 band to align with BBP.
#### 5. MACD Lines (Hidden) & Composite Histogram
- MACD and signal lines are calculated but not plotted by default.
- A “Weighted BBP” histogram combines:
- 20% normalized RSI,
- 20% average of (MACD + signal + normalized BBP),
- 60% normalized BBP
- Plotted as columns, color-coded by strength using the same palette as the main bars.
#### 6. Middle Reference Line
- A horizontal zero line to anchor over/under-zero readings.
---
### How to Use It
- **Trend confirmation**: Strong blue/green bars alongside a rising histogram suggest bull conviction; strong reds/magentas signal bear dominance.
- **Divergence spotting**: Watch for price making new highs/lows while BBP or the histogram fails to follow.
- **Quartal analysis**: The 5-bar group averages can reveal whether recent momentum is accelerating or waning.
- **Cross-indicator weighting**: Because RSI, MACD, and raw BBP all feed into the final histogram, you get a smoothed, blended view of momentum shifts.
---
**Tip:** Tweak the EMA and normalization length to suit your preferred timeframe (e.g. shorter for intraday scalps, longer for swing trades). Enable/disable the table if you prefer a cleaner pane.

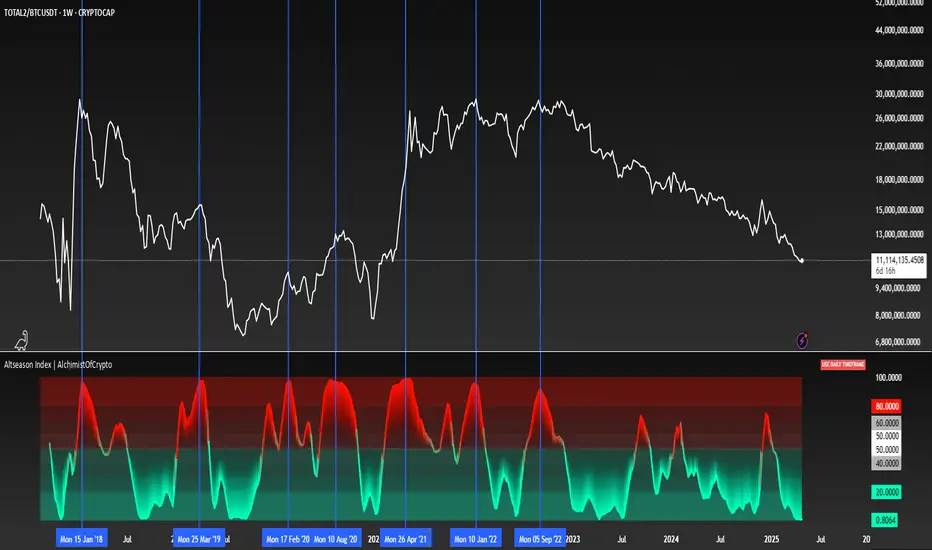
Altseason Index | AlchimistOfCrypto
🌈 Altseason Index | AlchimistOfCrypto – Revealing Bitcoin-Altcoin Dominance Cycles 🌈
"The Altseason Index, engineered through advanced mathematical methodology, visualizes the probabilistic distribution of capital flows between Bitcoin and altcoins within a multi-cycle paradigm. This indicator employs statistical normalization principles where ratio coefficients create mathematical boundaries that define dominance transitions between cryptographic asset classes. Our implementation features algorithmically enhanced rainbow visualization derived from extensive market cycle analysis, creating a dynamic representation of value flow with adaptive color gradients that highlight critical phase transitions in the cyclical evolution of the crypto market."
📊 Professional Trading Application
The Altseason Index transcends traditional sentiment models with a sophisticated multi-band illumination system that reveals the underlying structure of crypto sector rotation. Scientifically calibrated across different ratios (TOTAL2/BTC, OTHERS/BTC) and featuring seamless daily visualization, it enables investors to perceive capital transitions between Bitcoin and altcoins with unprecedented clarity.
- Visual Theming 🎨
Scientifically designed rainbow gradient optimized for market cycle recognition:
- Green-Blue: Altcoin accumulation zones with highest capital flow potential
- Neutral White: Market equilibrium zone representing balanced capital distribution
- Yellow-Red: Bitcoin dominance regions indicating defensive capital positioning
- Gradient Transitions: Mathematical inflection points for strategic reallocation
- Market Phase Detection 🔍
- Precise zone boundaries demarcating critical sentiment shifts in the crypto ecosystem
- Daily timeframe calculation ensuring consistent signal reliability
- Multiple ratio analysis revealing the probabilistic nature of market capital flows
🚀 How to Use
1. Identify Market Phase ⏰: Locate the current index relative to colored zones
2. Understand Capital Flow 🎚️: Monitor transitions between Bitcoin and altcoin dominance
3. Assess Mathematical Value 🌈: Determine optimal allocation based on zone location
4. Adjust Investment Strategy 🔎: Modulate position sizing based on dominance assessment
5. Prepare for Rotation ✅: Anticipate capital shifts when approaching extreme zones
6. Invest with Precision 🛡️: Accumulate altcoins in lower zones, reduce in upper zones
7. Manage Risk Dynamically 🔐: Scale portfolio allocations based on index positioning
TP/SL calcJust draw lines on top and bottom of entry price line.
-1% and +1%
-2% and +2%
-10% and +10%

Advance Trading StrategyStrategy Description: Advance Trading Strategy uses:
Fast (12) & Slow (21) EMAs for trend determination via crossovers.
ADX (14) with manual smoothing to confirm trend strength; threshold settable (default 20).
ATR-based stop-loss and take-profit levels (multipliers configurable).
Visual signals: BUY/SELL labels on crossover when ADX

Quarterly Fundamentals Table by GauravThis Pine Script v3 overlay paints a compact, six‐column table in the top‐right of your chart that begins with your stock’s market capitalization and sector/industry, then lays out quarterly fundamentals—Sales, Sales QoQ%, PAT, PAT QoQ% and OPM%—across the most recent four fiscal quarters (dynamically labeled by month and year). It pulls data via request.financial(), formats large numbers into lakhs/crores, calculates quarter‐over‐quarter growth, and sizes text for clarity, giving swing traders an at‐a‐glance view of key fundamental trends alongside price action.

Max RR CalculatorAutomatically calculates the maximum RR reached during trade. Entry is at the candle close. There is an option available that takes another trade after getting stopped out on the next candle that is in same bias as first trade.
(If the first trade is a long and gets stopped out, then the second trade will wait until the next up candle to enter long again)

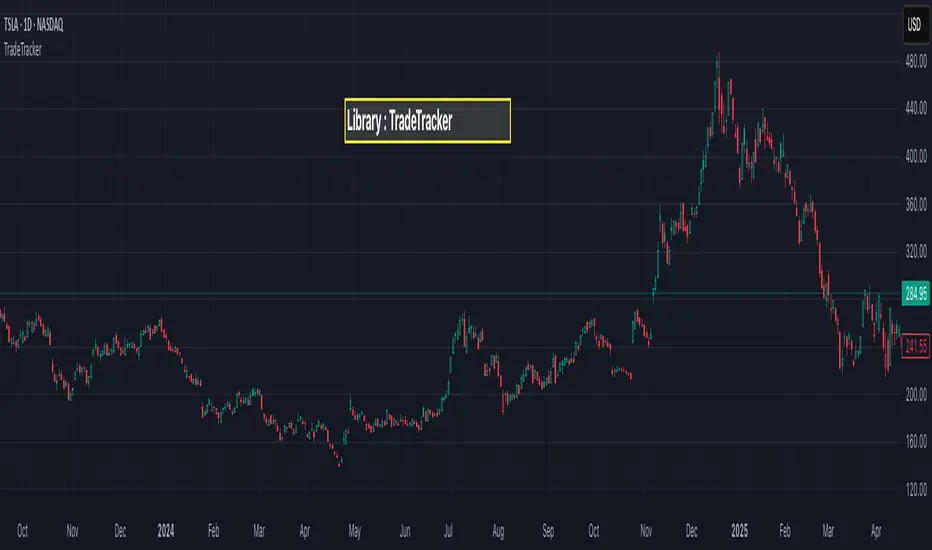
TradeTrackerLibrary "TradeTracker"
Simple Library for tracking trades
method track(this)
tracks trade when called on every bar
Namespace types: Trade
Parameters:
this (Trade) : Trade object
Returns: current Trade object
Trade
Has the constituents to track trades generated by any method.
Fields:
id (series int)
direction (series int) : Trade direction. Positive values for long and negative values for short trades
initialEntry (series float) : Initial entry price. This value will not change even if the entry is changed in the lifecycle of the trade
entry (series float) : Updated entry price. Allows variations to initial calculated entry. Useful in cases of trailing entry.
initialStop (series float) : Initial stop. Similar to initial entry, this is the first calculated stop for the lifecycle of trade.
stop (series float) : Trailing Stop. If there is no trailing, the value will be same as that of initial trade
targets (array) : array of target values.
startBar (series int) : bar index of starting bar. Set by default when object is created. No need to alter this after that.
endBar (series int) : bar index of last bar in trade. Set by tracker on each execution
startTime (series int) : time of the start bar. Set by default when object is created. No need to alter this after that.
endTime (series int) : time of the ending bar. Updated by tracking method.
status (series int) : Integer parameter to track the status of the trade
retest (series bool) : Boolean parameter to notify if there was retest of the entry price
[Stop!Loss] ADR Signal ADR Signal - a technical indicator located in a separate window, which displays by default the 80%-level , as well as the 100%-level of the average daily range (ADR) for the last 10 days and compares it with the current intraday range. The indicator helps not only with the use of a mathematical-statistical method to identify a potential reversal at the moment during intraday trading, but can also serves as an effective assistant in risk management.
👉 Basic mechanics of the indicator
Firstly, this indicator tracks the performance of the standard ATR indicator on the daily chart, in other words, ADR (Average Daily Range).
Important ❗️The ATR (Average True Range) indicator was created by J. Welles Wilder Jr. He first introduced ATR in his book "New Concepts in Technical Trading Systems", published in 1978. Wilder developed this indicator to measure market volatility to help traders estimate the range of price movements. This indicator is built into TradingView, more details can be found by link: www.tradingview.com
Like ATR , ADR calculates the average true range for a specified period. In this case, the distance in points from the maximum of each day to its minimum is calculated, after which the arithmetic mean is calculated - this is ADR .
👉 Visualization
ADR Signal is located in a separate window on the chart and has 3 levels:
1) "ADR level" (green line) - the same parameter, the calculations of which are briefly described above. There is 100%-level of ATR on the daily chart (ADR).
2) "Current level" (red line) - this is the current price passage within the day, calculated in points. At the start of a new day, this parameter is reset. Therefore, in the indicator window, this line has sharp drops at the start of a new trading day: "A new trading day - the instrument's power reserve is renewed again".
3) "Signal level" (blue line) - this is an individually customized value that demonstrates a certain part of the ADR parameter.
👉 Inputs
1) - is responsible for the ATR indicator period, the value of which will always be calculated on the daily chart. The default value is "10", that is, ATR is calculated for the last 10 days (not including the current one).
2) - signal level (in %). The default value is "0.8", that is, 80%-level of the ADR parameter (set earlier) is calculated.
👉 Style
1) - by default, this level is colored "blue".
2) - by default, this level is colored "red".
3) - by default, this level is colored "green".
👉 How to use this indicator
Important❗️ The two methods of the use of the ADR Signal indicator described below will be most effective when trading intraday (which is highlighted quite well below), so it is more logical to use the indicator information on time periods H1 and below.
1) Identifying potential reversals during intraday trading:
The ADR Signal indicator can be used as a potential individual reversal strategy.
Important ❗️It should be noted that using it in it without additional confirming analysis tools will be a rather aggressive trading approach. Therefore, it is best to support the entry point in particular with other methods.
In this case, the crossing of the red line (the number of points passed within the current day, that is, from the minimum of the current day to its maximum) and the blue line (color of the Signal level based on the default settings), indicates that the trading instrument has passed 80% (based on the default settings for the "Signal level") of its average distance from the maximum to the minimum over the past 10 days (based on the default settings for the "ADR Length"). Such a situation in the context of the mathematical-statistical approach indicates a probable reversal, since the "power reserve" of this instrument is mostly exhausted, so one can expect with a higher probability, at least, a price stop and possibly a reversal. In case of crossing of the red line and the green one (ADR level), it says again that based on the mathematical-statistical approach, this trading instrument has completely exhausted its intraday "power reserve". In this situation, a stop or reversal of the price will be even more likely.
Of course, using the "Signal level" parameter, one can filter out even more reliable situations for potential price reversals within a day, namely, by specifying, for example, 1.5 in the field of this parameter. Under such conditions, in the case of crossing the red and blue lines (based on the default style settings), to say that the trading instrument has passed 150% of its average distance over the last 10 days (based on the default style settings "ADR length"). In this case, the probability of a stop or reversal of the price increases even more.
2) Use in risk management:
In terms of risk management, this indicator is more applicable to open trades. For example, if one had an open Buy-position (especially if it is an intraday trade) and the price has raised significantly during the day, then the crossing of the red line with the blue line , and especially the red line with the green line , may indicate that the price will most likely stop growing, since the "power reserve" is almost or completely exhausted for this instrument within the current day. In this case, one can, at a minimum, move the trade to breakeven or even partially fix the profit.
We will continue to discuss the methods of using this indicator and strategies based on it here. And we are always waiting for your reactions and feedback on this topic 💬.
Thank you for your support 🚀

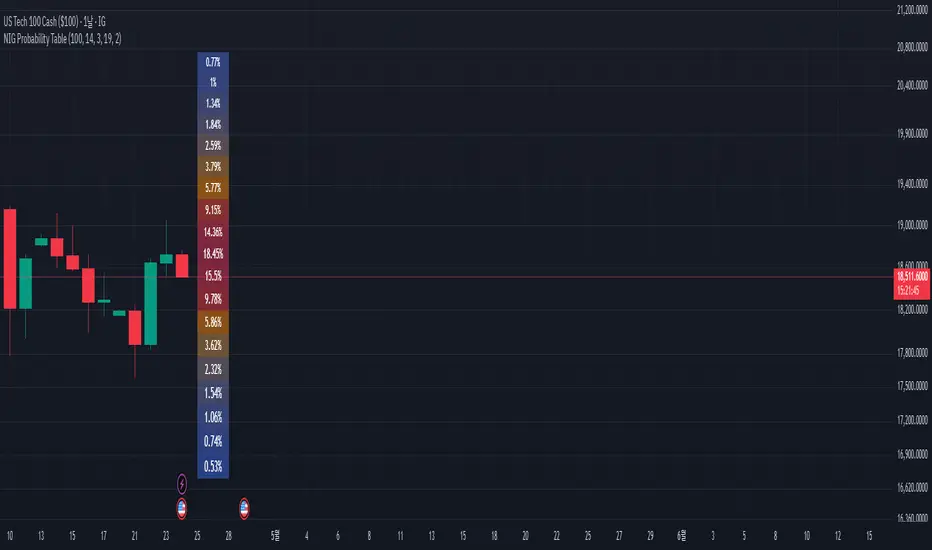
NIG Probability TableNormal-Inverse Gaussian Probability Table
This indicator implements the Normal-Inverse Gaussian (NIG) distribution to estimate the likelihood of future price based on recent market behavior.
📊 Key Features:
- Estimates the parameters (α: tail heaviness, β: skewness, δ: scale, μ: location)
of the NIG distribution using a sliding window over log returns.
- Uses a numerically approximated version of the modified Bessel function (K₁)
to calculate the NIG probability density function (PDF).
- Normalizes the total probability across all bins to ensure the values are interpretable.
- Displays a dynamic probability table showing the chance of future returns falling into each bin.
⚠️ Notes:
- This is a real-time approximation. The Bessel function and posterior inference are simplified.
- Tail probabilities and shape parameters are sensitive to the window size and input settings.
- Useful for risk analysis, option overlays, and strategy filters.
LAOS Gold Price in LAK By LSENMany people in Laos are confused about the actual price of Gold in local currency.
This script provides a simple and live updating way to convert the international gold price (XAU/USD) into Lao Kip Currency in BAHT-weight gold (15.244g).
By default, it uses an exchnage rte of 21,000 KIP = 1 USD, But you can easily customize the rate to fit your needs.
-See things as they truly are. Suffering arises when you try to resist reality. Don't let greed and FOMO fuel the fire.
ຂໍໃຫ້ທຸກທ່ານໂຊກດີ

Log-Normal Price ForecastLog-Normal Price Forecast
This Pine Script creates a log-normal forecast model of future price movements on a TradingView chart, based on historical log returns. It plots expected price trajectories and bands representing different levels of statistical deviation.
Parameters
Model Length – Number of bars used to calculate average and standard deviation of log returns (default: 100).
Forecast Length – Number of bars into the future for which the forecast is projected (default: 100, max: 500).
Volatility SMA Length – The smoothing length for the standard deviation (default: 20).
Confidence Intervals – Confidence intervals for price bands (default: 95%, 99%, 99.9%).
