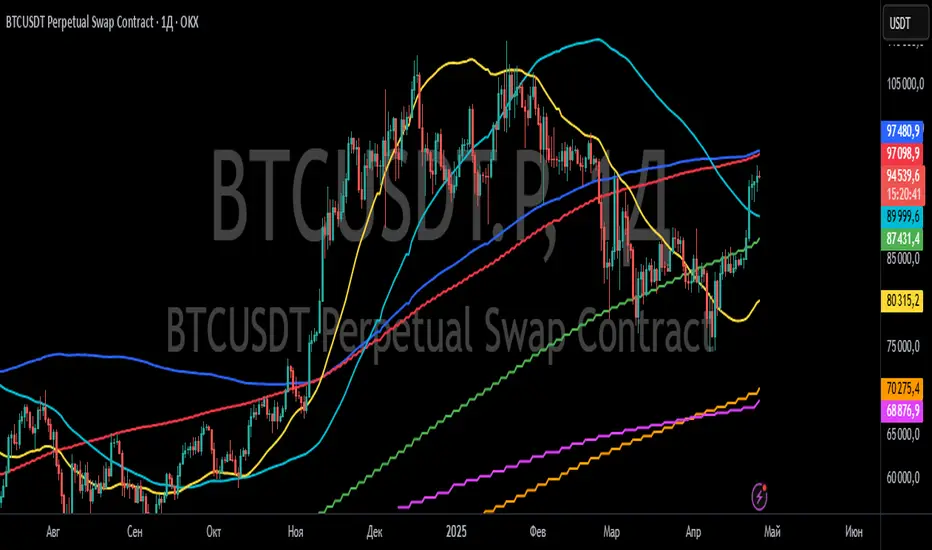
Real Relative Strength vs SPY (Clean Visual)This indicator plots Real Relative Strength/Weakness (RS/RW) of any stock relative to SPY, normalised by ATR. Designed to aid trading aligned to RDT philosophy.
Designed for intraday and swing traders to quickly identify stocks showing true institutional strength or weakness compared to the market.
Uses a clean, color-coded center-line display for fast reading of live RS/RW performance.
It automatically syncs to whatever timeframe you’re trading (5min, 15min, 1hr)
Default comparison ticker is SPY (you can easily swap if needed later)
Length = 12 by default → (rolling 1-hour window on M5 chart)
Clean green/red visual breakout = immediately obvious relative strength or weakness!
How to use
Strong Green move above zero ➔ RS developing ➔ Long bias
Strong Red move below zero ➔ RW developing ➔ Short bias
Choppy around zero ➔ No clear edge ➔ maybe avoid that stock
Trend Analysis

Quarterly Fundamentals Table by GauravThis Pine Script v3 overlay paints a compact, six‐column table in the top‐right of your chart that begins with your stock’s market capitalization and sector/industry, then lays out quarterly fundamentals—Sales, Sales QoQ%, PAT, PAT QoQ% and OPM%—across the most recent four fiscal quarters (dynamically labeled by month and year). It pulls data via request.financial(), formats large numbers into lakhs/crores, calculates quarter‐over‐quarter growth, and sizes text for clarity, giving swing traders an at‐a‐glance view of key fundamental trends alongside price action.

Scalping Supertrend + Stochastic RSIThe Scalping Supertrend + Stochastic RSI Indicator is designed for short-term trading and scalping on lower timeframes. It combines the Supertrend indicator to identify trend direction with the Stochastic RSI to pinpoint overbought/oversold conditions for precise entry and exit signals. The indicator generates buy and sell signals when the Stochastic RSI crosses predefined levels (oversold/overbought) while aligned with the Supertrend’s trend direction.

ICT Ultimate Checklist | MARKET MAVERISK MOHAMMAD ESMAILIIThis indicator serves as a checklist for ICT traders. It stays on the chart regularly because the ICT method has various components for confirmation needed to enter a trade, helping us not to get distracted and stay on our strategy.

Event-Based Multi MA v1.1📈 Event-Based Multi MA v1.1 — Smart Trading with Dynamic MA Updates
Overview
In a world where most moving averages blindly follow every candle, Event-Based Multi MA v1.1 introduces a smarter logic:
➡️ Update moving averages only when significant price movements occur.
Forget the noise. Focus on what's important.
This indicator recalculates your moving averages only after meaningful price shifts, allowing you to spot true trends and avoid market whipsaws.
Key Features
✅ Event-Driven Logic
Set events based on:
Points: Absolute price change
Percent: Relative price movement
ATR: Volatility-adjusted dynamic movement
✅ Seven Fully Customizable Moving Averages (MA1–MA7)
Each MA offers:
Custom timeframe
Selection of types (EMA, SMA, WMA, VWMA, HMA, LSMA, DEMA, TEMA, ALMA, RMA)
Adjustable lengths and colors
✅ Reduced Market Noise
MAs adjust only after important price actions — cutting down lag and false signals.
✅ Multi-Timeframe Analysis
You can blend moving averages from different timeframes (e.g., 15m, 1H, Daily) into a single chart — perfect for professional multi-frame strategy building.
Settings Explained
Event Trigger Type: Select Points, Percent, or ATR-based movement.
Event Threshold: The amount of price movement needed to trigger a new calculation.
ATR Length: If ATR mode is selected, this controls the sensitivity.
Each Moving Average (MA1 to MA7) has:
MA Type: Choose the smoothing method that suits your trading style.
Length: The number of bars used in the calculation.
Color: Customize visual styling.
Timeframe: Load MAs from different timeframes into your current chart.
How to Use It in Trading
🔹 Trend Confirmation
Wait for event-triggered updates. Fresh MAs after a significant move are much stronger signals than constantly refreshing MAs.
🔹 Momentum Breakouts
Combine short-term (e.g., MA1, MA2) and long-term (e.g., MA5, MA6) MAs. When short-term MAs cross above/below long-term after an event, it's a powerful breakout cue.
🔹 Dynamic Support/Resistance
Use slow-moving MAs like 100-200 length across different timeframes.
The event-based recalculation keeps them relevant to recent major price moves.
🔹 Volatility Filters
Switch to ATR-based events to adapt moving average updates during volatile periods and calm markets.
Why It Beats Traditional Moving Averages
🚀 No More Overfitting to Every Candle
You focus only on impactful price changes.
🚀 Multi-Timeframe Flexibility
Blend micro and macro views seamlessly in one chart.
🚀 Cleaner Signals, Less Noise
Event-triggered recalculations filter out useless minor price wobbles.
🚀 Customization Beyond Standard MAs
TEMA, HMA, ALMA, DEMA, VWMA — all included for ultra-fine-tuned strategies.
✨ Ready to Upgrade Your Trading?
Forget the old, slow MAs.
Use intelligence. Trade events, not noise.
→ Add Event-Based Multi MA v1.1 to your chart and experience true precision!
EMA Crossover BackgroundWhen the chart closes above or below the EMA, the background color changes.
"Useful if you want to trade in the trend direction but don't always want to look at the EMA. For example, in an aggressive up or down trend, the EMA is far away on lower time frames, but you can instantly see if it’s above or below, which makes backtesting easier too."

Institutional Composite Moving Average (ICMA) [Volume Vigilante]Institutional Composite Moving Average (ICMA)
The Next Evolution of Moving Averages — Built for Real Traders.
ICMA blends the strength of four powerful averages (SMA, EMA, WMA, HMA) into a single ultra-responsive, ultra-smooth signal.
It reacts faster than traditional MAs while filtering out noise, giving you clean trend direction with minimal lag.
🔹 Key Features:
• Faster reaction than SMA, EMA, or WMA individually
• Smoother and more stable than raw HMA
• Naturally adapts across trend, momentum, and consolidation conditions
• Zero gimmicks. Zero repainting. Full institutional quality.
🔹 Designed For:
• Scalping
• Swing trading
• Signal engines
• Algorithmic systems
📎 How to Use:
• Overlay it on any chart
• Fine-tune the length per timeframe
• Combine with your entries/exits for maximum edge
Created by Volume Vigilante 🧬 — Delivering Real-World Trading Tools.
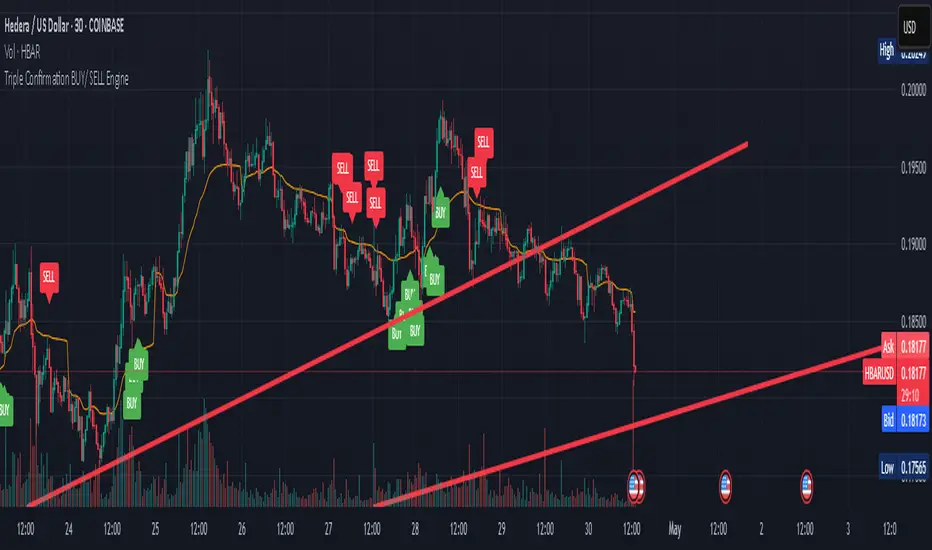
Triple Confirmation Buy/Sell Engine VWAP + MACD + RSIDescription:
This custom-built indicator generates high-confidence Buy/Sell signals using a powerful combination of MACD momentum, RSI strength, and VWAP trend confirmation — designed for cleaner entries and fewer false signals.
Unlike traditional scripts that rely on only one indicator (and produce noisy or early signals), this system requires triple confirmation, greatly increasing signal quality and reducing false trades.
✅ Buy Signal Conditions:
MACD histogram turns green (momentum shift positive)
RSI crosses above 50 (bullish strength confirmation)
Price closes above VWAP (trend confirmation)
🔻 Sell Signal Conditions:
MACD histogram turns red (momentum shift negative)
RSI crosses below 50 (weakening trend)
Price closes below VWAP (bearish confirmation)
🛠 Best For:
Trend traders seeking higher probability entries
Swing traders who want to catch bigger moves
Crypto, stocks, forex traders looking for simple, effective signals
Silver BulletSilver Bullet — A Strategic Approach
The Silver Bullet indicator simplifies trading by focusing on three core elements: Time Frame, Price Levels, and Optimal Trade Entries.
Time Frame
Silver Bullet targets a precise intraday window to capture key market moves. By zeroing in on specific time frames, it aligns trade setups with real-time momentum and dynamic price action.
Price Levels
Using Fibonacci-based levels, Fair Value Gaps (FVGs), and Volume Imbalances (VIs), Silver Bullet highlights high-probability zones for entries and exits.
Optimal Trade Entry
By combining strategic time windows with precise price zones, Silver Bullet pinpoints ideal trade moments — maximizing potential while keeping risk tightly controlled.
Included in the Silver Bullet TradingView Indicator
• Macro Time Highlight (09:50 - 10:10 EST)
• Fibonacci Levels
• Fair Value Gaps (FVGs)
• Volume Imbalances (VIs)
• Tweezer Candlestick Reversal Detection
⸻
Live Support & More
For live support, updates, and access to premium features, visit silverbullet.trade .


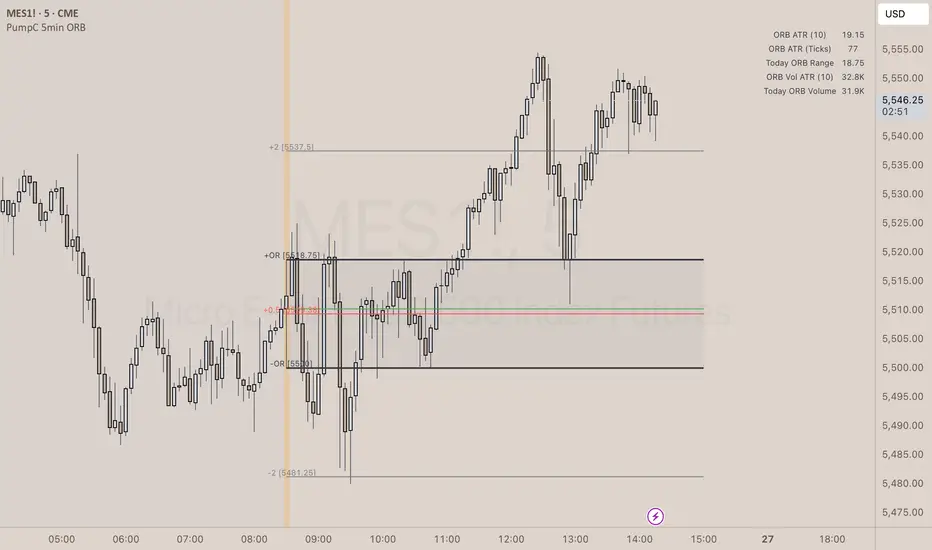
PumpC Opening Range Breakout (ORB) 5min Range📄 PumpC ORB 5-Minute Opening Range Breakout Indicator
✨ Overview
The PumpC ORB 5-Minute Opening Range Breakout indicator captures early session price action by tracking the high, low, and open of a defined 5-minute window at market open (customized for Futures or Stocks).
It plots breakout levels, extension targets, average range calculations, volume tracking, and provides visual and table-based data summaries.
This indicator is designed for traders seeking a complete, clean visualization of Opening Range Breakouts (ORB) with flexible customization.
⚙️ Main Features
Opening Range Box (ORB Box) Draws a box around the high and low of the first 5-minute session (8:30–8:35 ET for Futures, 9:30–9:35 ET for Stocks). Box extends from the session open to the session close (4:00 PM ET). Option to enable/disable historical boxes. Box color and opacity are customizable. Core ORB Levels Open Level: Plots the open price of the 5-minute ORB window. ORB Levels: Plots breakout levels at multiples: +0.5x the range +1.5x the range (customizable factor) Each level has independent color settings and visibility toggles. Option to show or hide historic extension levels. Table Display Compact table in the top-right corner showing: ORB ATR (average range) ORB ATR in ticks Today's ORB range ORB Volume ATR (average volume during ORB) Today's ORB Volume Volume is formatted automatically into "K" (thousands) or "M" (millions) for readability. Background Highlights After the ORB window closes: Blue highlight if today's ORB range is greater than the 10-day ATR average. Orange highlight if today's ORB range is smaller than the 10-day ATR average. Helps quickly assess relative strength or weakness compared to historical behavior. Alerts Breakout Confirmations: Fires when price closes above ORB High or below ORB Low. Fallout Traps: Alerts when price wick crosses ORB High/Low but closes back inside the range. Alerts use clean titles and simple messages for easy identification.
🔧 Inputs and Customization
Mode Toggle: Choose between Futures (8:30 ET open) or Stocks (9:30 ET open). Show/Hide Labels: Control label visibility for ORB and extension levels. Line Width Control: Customize thickness for ORB lines and extension levels. ORB Level Level Visibility: Independently enable or disable each extension line. Table Appearance: Customize table background color, font color, and padding. ORB Box Settings: Customize box color and control whether historical boxes are drawn.
📚 How to Use
Select Mode: Choose Futures or Stocks depending on your instrument. Observe the Opening Range: Focus on the ORB High and ORB Low during the first 5 minutes after the open. Monitor Breakouts: Breakout alerts will fire when price closes outside the ORB range, signaling potential continuation. Watch for Fallout Traps: Fallout alerts signal when price briefly wicks above/below but closes back inside the ORB range. Use Table Metrics: Instantly compare today's ORB range and volume versus historical averages to assess session strength or weakness.
🛡️ Notes
Best used on the 1-minute or 5-minute chart for intraday trading. Ensure your TradingView chart time zone is set to New York for correct functioning. Alerts must be manually configured after adding the indicator to your chart.
Neon HMANeon-HMA with Gradient Heat-Map
A simple, visually-rich trend ribbon that mixes a smooth Hull Moving Average with a fast “heat-map” colour-scale.
Perfect when you want to keep one clean line on the chart, but still see lower-time-frame momentum flashes.

Trend Direction on 1 Hour Timeframe1 Hour timeframe indicator of trend direction using EMA 9/21. Chart as background color indicating trend.

NR4/NR7 + Trend + MACD + VWAP FilterThe Ultimate Momentum-Compression Strategy
This strategy merges the power of price compression and trend confirmation, ensuring you're trading when the market is coiled and ready to move. By combining multiple filters—NR4/NR7, trend alignment, MACD momentum, and VWAP support—this setup identifies high-probability trade opportunities in dynamic, trending stocks. Here's how it works:
NR4/NR7 Patterns: These are narrow-range days where the current price range is smaller than the previous 4 or 7 days. This signals potential breakout or continuation setups, as the market is compressing before making a move.
Trend Confirmation: To ensure you're not trading against the current trend, the price must be above the 20 EMA, and the 10 EMA must be above the 20 EMA. This confirms a bullish structure, with the price trending in your favour.
MACD Momentum: The fast MACD line must be above the slow MACD line, confirming the trend is not only intact but also gaining momentum.
VWAP Filter: Price must be above the VWAP (Volume Weighted Average Price). This is the final confirmation that the market is in a strong, bullish phase, with buyers dominating the market.
By requiring all these conditions to align, this strategy takes the guesswork out of day trading. It ensures you're trading within a well-established trend, with compression patterns and momentum backing your trade. The result? You’re entering positions with confidence and clarity, poised to ride strong, sustained moves.
This strategy is for the trader who values both flexibility and discipline—able to capture dynamic moves while staying aligned with market structure and momentum. It’s a refined, systematic approach that makes decisions clear, without the emotional second-guessing.

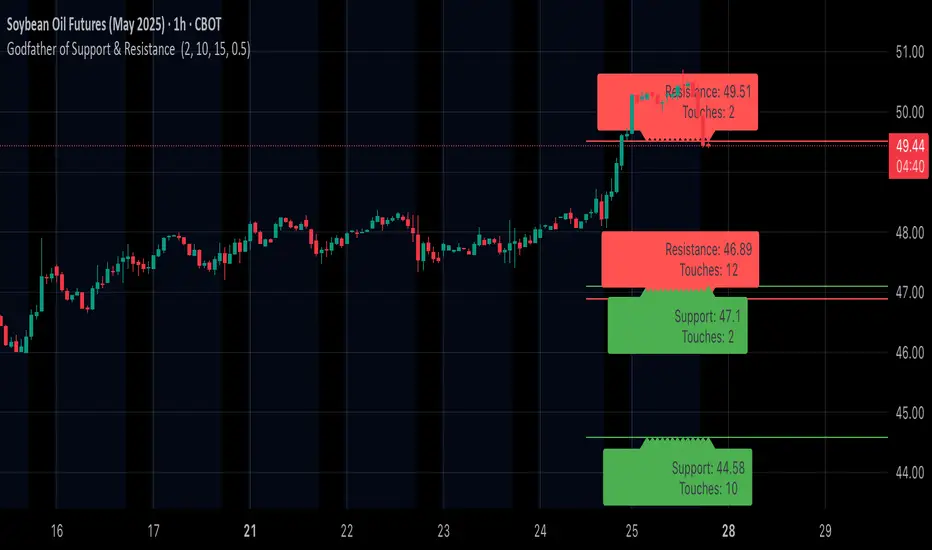
Godfather of Support & Resistance Godfather of Support & Resistance
Overview
The Godfather of Support & Resistance script is a powerful tool designed to help traders identify critical support and resistance levels on their charts. These price levels are vital for understanding market behavior, as they often act as turning points where prices reverse, consolidate, or break through. By automating the detection of these levels, this script simplifies your trading decisions and enhances your technical analysis.
How It Works
Pivot Points for Level Detection:
The script uses pivot points to identify potential support (lows) and resistance (highs) levels:
A pivot high is a local peak (a high surrounded by lower highs).
A pivot low is a local trough (a low surrounded by higher lows).
You can adjust the Pivot Length (pivotLen) input to control the sensitivity of detection. Smaller values detect more levels, while larger values focus on major levels.
Dynamic Grouping with Tolerance:
The script dynamically groups nearby price levels using a tolerance percentage. This tolerance is based on the level's price, making it adaptive to all types of assets (low- and high-priced).
For example, if the tolerance is set to 1% and a level is at $100, levels within $1 are grouped together.
Touch Count for Significance:
The script tracks how many times the price interacts with each level (touch count). Only levels that meet or exceed the Minimum Touches (minTouches) input are displayed on the chart. This ensures only meaningful levels are highlighted.
Clear Visual Representation:
Resistance Levels (Red Lines): Represent areas where the price tends to reverse downward.
Support Levels (Green Lines): Represent areas where the price tends to reverse upward.
Labels are added to each level (optional) to display the price and the number of touches for better decision-making.
Inputs You Can Customize
Minimum Touches to Show Level:
Set the minimum number of price interactions required for a level to be displayed.
Maximum Lines to Keep:
Limit the number of support and resistance lines displayed to keep your chart clean and focused.
Pivot Length:
Customize the sensitivity of pivot point detection. Smaller values detect more levels, while larger values focus on key levels.
Tolerance for Touch Detection (%):
Adjust the grouping tolerance as a percentage of the price. For example, 1% groups levels that are within 1% of each other.
How to Use
Apply the Script:
Add the script to your TradingView chart, and it will automatically detect and plot support and resistance levels.
Analyze the Levels:
Use Resistance Levels (red lines) as potential sell zones or areas to place stop-loss orders above.
Use Support Levels (green lines) as potential buy zones or areas to place stop-loss orders below.
Customize for Your Trading Style:
Adjust the inputs to match your preferred strategy and the timeframe or asset you're analyzing.
Example Use Case
Imagine you're analyzing a stock:
Resistance Level: The script identifies resistance at $150 with 3 touches. This might be a potential sell zone if the price struggles to break through.
Support Level: The script identifies support at $130 with 4 touches. This might be a potential buy zone if the price shows signs of bouncing upward.
Key Features
Automatically detects and plots support and resistance levels.
Tracks the number of price touches to filter out weak levels.
Adapts dynamically to price ranges using a percentage-based tolerance.
Fully customizable to suit different trading styles and assets.
Clean and professional chart display with a limit on the number of lines.
Notes
This script is for educational purposes only and should not be considered financial advice.
Always perform your own analysis and manage risk before making trading decisions.
Why Use This Script?
The Godfather of Support & Resistance script simplifies your trading decisions by automating the detection of critical price levels. Whether you're a beginner or an experienced trader, this script is designed to save you time and help you focus on making informed trades.
Start using it today to master the art of support and resistance trading!
Let me know if you need further refinements for this description!
Multi-Timeframe Support & Resistance - KSKClean Multi-Timeframe Support & Resistance (S&R) Tool
This indicator automatically plots previous period Highs and Lows for:
🟢 Daily
🔵 Weekly
🟣 Monthly
It provides a clean visual reference for key market levels, which can act as areas of:
Support & Resistance
Breakout or Rejection zones
Entry/Exit decision points
Table Summary:
Compact 2-column table showing all major levels
Can be positioned manually (Top Left, Top Right, etc.)
Auto-refreshes every few bars for performance

Machine Learning | Adaptive Trend Signals [Bitwardex]⚙️🧠Machine Learning | Adaptive Trend Signals
🔷Overview
Machine Learning | Adaptive Trend Signals is a Pine Script™ v6 indicator designed to visualize market trends and generate signals through a combination of volatility clustering, Gaussian smoothing, and adaptive trend calculations. Built as an overlay indicator, it integrates advanced techniques inspired by machine learning concepts, such as K-Means clustering, to adapt to changing market conditions. The script is highly customizable, includes a backtesting module, and supports alert conditions, making it suitable for traders exploring trend-based strategies and developers studying volatility-driven indicator design.
🔷Functionality
The indicator performs the following core functions:
• Volatility Clustering: Uses K-Means clustering to categorize market volatility into high, medium, and low states, adjusting trend sensitivity accordingly.
• Trend Calculation: Computes adaptive trend lines (SmartTrend) based on volatility-adjusted standard deviation, smoothed RSI, and ADX filters.
• Signal Generation: Identifies potential buy and sell points through trend line crossovers and directional confirmation.
• Backtesting Module: Tracks trade outcomes based on the SmartTrend3 value, displaying win rate and total trades.
• Visualization: Plots trend lines with gradient colors and optional signal markers (bullish 🐮 and bearish 🐻).
• Alerts: Provides configurable alerts for trend shifts and volatility state changes.
🔷Technical Methodology
Volatility Clustering with K-Means
The indicator employs a K-Means clustering algorithm to classify market volatility, measured via the Average True Range (ATR), into three distinct clusters:
• Data Collection: Gathers ATR values over a user-defined training period (default: 100 bars).
• Centroid Initialization: Sets initial centroids at the highest, lowest, and midpoint ATR values within the training period.
• Iterative Clustering: Assigns ATR data points to the nearest centroid, recalculates centroid means, and repeats until convergence.
• Dynamic Adjustment: Assigns a volatility state (high, medium, or low) based on the closest centroid, adjusting the trend factor (e.g., tighter for high volatility, wider for low volatility).
This approach allows the indicator to adapt its sensitivity to varying market conditions, providing a data-driven foundation for trend calculations.
🔷Gaussian Smoothing
To enhance signal clarity and reduce noise, the indicator applies Gaussian kernel smoothing to:
• RSI: Smooths the Relative Strength Index (calculated from OHLC4) to filter short-term fluctuations.
• SmartTrend: Smooths the primary trend line for a more stable output.
The Gaussian kernel uses a sigma value derived from the user-defined smoothing length, ensuring mathematically consistent noise reduction.
🔷SmartTrend Calculation
The pineSmartTrend function is the core of the indicator, producing three trend lines:
• SmartTrend: The primary trend line, calculated using a volatility-adjusted standard deviation, smoothed RSI, and ADX conditions.
• SmartTrend2: A secondary trend line with a wider factor (base factor * 1.382) for signal confirmation.
SmartTrend3: The average of SmartTrend and SmartTrend2, used for plotting and backtesting.
Key components of the calculation include:
• Dynamic Standard Deviation: Scales based on ATR relative to its 50-period smoothed average, with multipliers (1.0 to 1.4) applied according to volatility thresholds.
• RSI and ADX Filters: Requires RSI > 50 for bullish trends or < 50 for bearish trends, alongside ADX > 15 and rising to confirm trend strength.
Volatility-Adjusted Bands: Constructs upper and lower bands around price action, adjusted by the volatility cluster’s dynamic factor.
🔷Signal Generation
The generate_signals function generates signals as follows:
• Buy Signal: Triggered when SmartTrend crosses above SmartTrend2 and the price is above SmartTrend, with directional confirmation.
• Sell Signal: Triggered when SmartTrend crosses below SmartTrend2 and the price is below SmartTrend, with directional confirmation.
Directional Logic: Tracks trend direction to filter out conflicting signals, ensuring alignment with the broader market context.
Signals are visualized as small circles with bullish (🐮) or bearish (🐻) emojis, with an option to toggle visibility.
🔷Backtesting
The get_backtest function evaluates signal outcomes using the SmartTrend3 value (rather than closing prices) to align with the trend-based methodology.
It tracks:
• Total Trades: Counts completed long and short trades.
• Win Rate: Calculates the percentage of trades where SmartTrend3 moves favorably (higher for longs, lower for shorts).
Position Management: Closes opposite positions before opening new ones, simulating a single-position trading system.
Results are displayed in a table at the top-right of the chart, showing win rate and total trades. Note that backtest results reflect the indicator’s internal logic and should not be interpreted as predictive of real-world performance.
🔷Visualization and Alerts
• Trend Lines: SmartTrend3 is plotted with gradient colors reflecting trend direction and volatility cluster, accompanied by a secondary line for visual clarity.
• Signal Markers: Optional buy/sell signals are plotted as small circles with customizable colors.
• Alerts: Supports alerts for:
• Bullish and bearish trend shifts (confirmed on bar close).
Transitions to high, medium, or low volatility states.
🔷Input Parameters
• ATR Length (default: 14): Period for ATR calculation, used in volatility clustering.
• Period (default: 21): Common period for RSI, ADX, and standard deviation calculations.
• Base SmartTrend Factor (default: 2.0): Base multiplier for volatility-adjusted bands.
• SmartTrend Smoothing Length (default: 10): Length for Gaussian smoothing of the trend line.
• Show Buy/Sell Signals? (default: true): Enables/disables signal markers.
• Bullish/Bearish Color: Customizable colors for trend lines and signals.
🔷Usage Instructions
• Apply to Chart: Add the indicator to any TradingView chart.
• Configure Inputs: Adjust parameters to align with your trading style or market conditions (e.g., shorter ATR length for faster markets).
• Interpret Output:
• Trend Lines: Use SmartTrend3’s direction and color to gauge market bias.
• Signals: Monitor bullish (🐮) and bearish (🐻) markers for potential entry/exit points.
• Backtest Table: Review win rate and total trades to understand the indicator’s behavior in historical data.
• Set Alerts: Configure alerts for trend shifts or volatility changes to support manual or automated trading workflows.
• Combine with Analysis: Use the indicator alongside other tools or market context, as it is designed to complement, not replace, comprehensive analysis.
🔷Technical Notes
• Data Requirements: Requires at least 100 bars for accurate volatility clustering. Ensure sufficient historical data is loaded.
• Market Suitability: The indicator is designed for trend detection and may perform differently in ranging or volatile markets due to its reliance on RSI and ADX filters.
• Backtesting Scope: The backtest module uses SmartTrend3 values, which may differ from price-based outcomes. Results are for informational purposes only.
• Computational Intensity: The K-Means clustering and Gaussian smoothing may increase processing time on lower timeframes or with large datasets.
🔷For Developers
The script is modular, well-commented, encouraging reuse and modification with proper attribution.
Key functions include:
• gaussianSmooth: Applies Gaussian kernel smoothing to any data series.
• pineSmartTrend: Computes adaptive trend lines with volatility and momentum filters.
• getDynamicFactor: Adjusts trend sensitivity based on volatility clusters.
• get_backtest: Evaluates signal performance using SmartTrend3.
Developers can extend these functions for custom indicators or strategies, leveraging the volatility clustering and smoothing methodologies. The K-Means implementation is particularly useful for adaptive volatility analysis.
🔷Limitations
• The indicator is not predictive and should be used as part of a broader trading strategy.
• Performance varies by market, timeframe, and parameter settings, requiring user experimentation.
• Backtest results are based on historical data and internal logic, not real-world trading conditions.
• Volatility clustering assumes sufficient historical data; incomplete data may affect accuracy.
🔷Acknowledgments
Developed by Bitwardex, inspired by machine learning concepts and adaptive trading methodologies. Community feedback is welcome via TradingView’s platform.
🔷 Risk Disclaimer
Trading involves significant risks, and most traders may incur losses. Bitwardex AI Algo is provided for informational and educational purposes only and does not constitute financial advice or a recommendation to buy or sell any financial instrument . The signals, metrics, and features are tools for analysis and do not guarantee profits or specific outcomes. Past performance is not indicative of future results. Always conduct your own due diligence and consult a financial advisor before making trading decisions.

Supertrend X2 + CalcSize Calculator:
Size Calculator is a risk management tool that helps traders position themselves intelligently by calculating optimal position size, stop loss, and take profit levels based on account capital, ATR volatility, and personal risk tolerance. It takes the guesswork out of sizing so you can focus on execution.
Features:
✅ Risk-based position sizing
✅ ATR-based stop loss & take profit levels
✅ Dynamic leverage estimation
✅ Support for long and short positions
✅ Visual display of key levels and metrics via table
✅ Works across any timeframe with locked timeframe support
How It Works:
This tool computes the ideal position size as a % of account capital based on how much you're willing to risk per trade and how far your stop loss is (in ATR units). It calculates corresponding stop loss and take profit prices, and visually plots them along with a floating table of metrics. You can lock the timeframe used for ATR and price, keeping your risk logic stable even when changing chart views.
Customizable Inputs:
Account capital and risk tolerance
ATR-based stop loss & take profit multiples
Trade direction (Long or Short)
ATR period and locked timeframe
Optional detailed metrics display
Dual SuperTrend:
The Dual Supertrend indicator enhances the classic Supertrend strategy by layering two customizable Supertrend signals with independent ATR settings. This setup gives you a deeper, more nuanced read on trend strength and potential entry zones.
Features:
✅ Two Supertrend lines (each with adjustable ATR periods and multipliers)
✅ Optional Heikin Ashi candle smoothing for noise reduction
✅ Color-coded trend background for fast visual analysis
✅ Multi-timeframe trend table overlay (customizable)
✅ Built-in signal logic to identify "Long", "Short", or "N/A" zones
✅ Built-in alerts from Long and Short Entry Zones
How It Works:
The script calculates two Supertrend levels using separate ATR settings. Trend direction is derived from the relationship between price and each band. When the larger (slower) Supertrend flips and the smaller (faster) confirms, it signals a potential entry. The multi-timeframe table helps you align trades across different timeframes.
Customizable Inputs:
ATR Periods & Multipliers for both Supertrends
Timeframes for entry zone detection (up to 4)
Enable/disable Heikin Ashi candles for smoother trend detection

Wyckoff Accumulation Distribution Wyckoff Accumulation & Distribution Indicator (RSI-Based)
This Pine Script is a technical analysis indicator built around the Wyckoff Method, designed to detect accumulation and distribution phases using RSI (Relative Strength Index) and pivot points. It automatically marks key structural turning points on the chart and highlights relevant zones with colored boxes.
What Does It Do?
Draws accumulation and distribution boxes based on RSI behavior.
Automatically detects Wyckoff structural signals:
SC (Selling Climax)
AR (Automatic Rally)
ST (Secondary Test)
BC (Buying Climax)
DAR (Automatic Reaction)
DST (Secondary Test - Distribution)
Identifies trend transitions by detecting sideways RSI movement.
Attempts to detect spring and UTAD-like deviations based on RSI reversals.
Uses RSI extremes in conjunction with pivot points to generate Wyckoff signals.
How Does It Work?
RSI Zone: It identifies sideways markets when RSI stays within ±20 of the 50 level (this range is configurable).
Pivot Points: It detects pivot highs/lows that sync with RSI values (pivotLen is adjustable).
Trend Box Drawing:
When RSI exits the sideways zone, the script draws a gray box between the highest high and lowest low within that range.
If RSI breaks upward, the box becomes green (Accumulation); if downward, it becomes red (Distribution).
Wyckoff Structural Points:
SC/BC: Detected when a pivot occurs with RSI below/above a threshold.
AR/DAR: The next opposite pivot after SC or BC.
ST/DST: The next same-direction pivot after AR or DAR.
How to Use It
Works best on 4H or daily charts for more reliable signals. Shorter timeframes may generate noise.
Primarily used for interpreting RSI structures through the lens of Wyckoff methodology.
Box colors help quickly identify market phase:
Green box: Likely Accumulation
Red box: Likely Distribution
Triangular markers show key signals:
SC, AR, ST: Accumulation points
BC, DAR, DST: Distribution points
Use these signals alongside price action to manually interpret Wyckoff phases.
image.binance.vision
image.binance.vision
What Is the Wyckoff Method?
The Wyckoff Method, developed in the 1930s by Richard Wyckoff, is a market analysis approach that focuses on supply and demand dynamics behind price movements.
Wyckoff’s 5 Phases:
Accumulation: Smart money gradually buying at low prices.
Markup: Price begins trending upwards.
Distribution: Smart money selling to retail traders.
Markdown: Downtrend begins as supply outweighs demand.
Re-accumulation / Re-distribution: Trend-continuation phases with consolidations.
This indicator is specifically designed to detect phase 1 (Accumulation) and phase 3 (Distribution).
Extra Notes
Repainting is minimal, as pivots are confirmed using historical candles.
Labels use plotshape for a clean, minimalist visual style.
Other Wyckoff events (like SOS, LPS, UT, UTAD) could be added in future updates.
This script does not generate buy/sell signals; it is meant for structural interpretation.

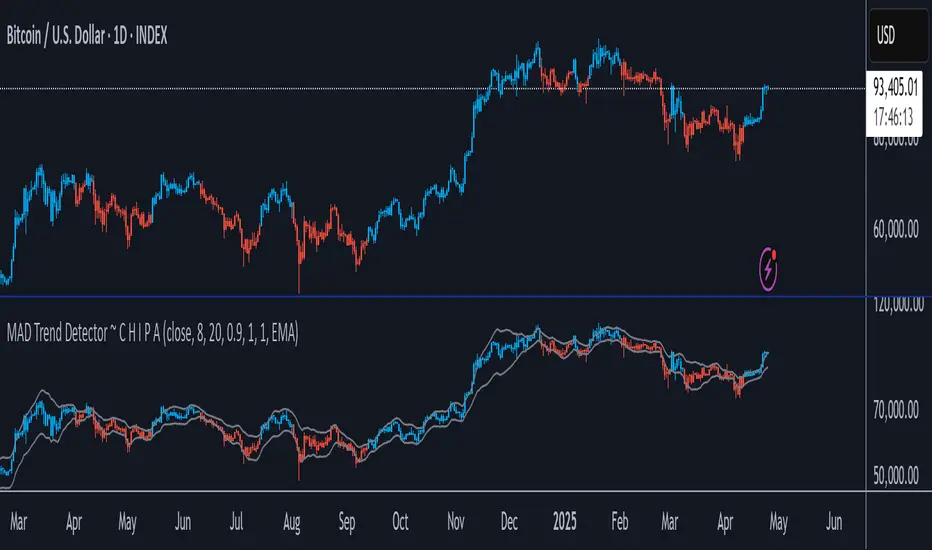
MAD Trend Detector ~ C H I P AMAD Trend Detector ~ C H I P A is a custom trend detection tool designed to identify meaningful price deviations using Median Absolute Deviation (MAD) logic layered over a smoothed price baseline.
It uses:
A user-selectable source (Close, High, Low, etc.)
A configurable EMA or SMA as the core smoothing layer
Median Absolute Deviation (MAD) to measure typical price dispersion
A user-adjustable MAD multiplier to fine-tune trend sensitivity
Trend bands that expand dynamically based on local volatility
This setup highlights breakout conditions when price detaches meaningfully from its typical behavior — helping traders detect trend acceleration, volatility breakouts, and directional shifts with minimal lag and reduced noise.
Candle coloring responds directly to trend status, with electric blue and red visuals for clear on-chart recognition.
Anchored Darvas Box## ANCHORED DARVAS BOX
---
### OVERVIEW
**Anchored Darvas Box** lets you drop a single timestamp on your chart and build a Darvas-style consolidation zone forward from that exact candle. The indicator freezes the first user-defined number of bars to establish the range, verifies that price respects that range for another user-defined number of bars, then waits for the first decisive breakout. The resulting rectangle captures every tick of the accumulation phase and the exact moment of expansion—no manual drawing, complete timestamp precision.
---
### HISTORICAL BACKGROUND
Nicolas Darvas’s 1950s box theory tracked institutional accumulation by hand-drawing rectangles around tight price ranges. A trade was triggered only when price escaped the rectangle.
The anchored version preserves Darvas’s logic but pins the entire sequence to a user-chosen candle: perfect for analysing a market open, an earnings release, FOMC minute, or any other catalytic bar.
---
### ALGORITHM DETAIL
1. **ANCHOR BAR**
*You provide a timestamp via the settings panel.* The script waits until the chart reaches that bar and records its index as **startBar**.
2. **RANGE DEFINITION — BARS 1-7**
• `rangeHigh` = highest high of bars 1-7 plus optional tolerance.
• `rangeLow` = lowest low of bars 1-7 minus optional tolerance.
3. **RANGE VALIDATION — BARS 8-14**
• Price must stay inside ` `.
• Any violation aborts the test; no box is created.
4. **ARMED STATE**
• If bars 8-14 hold the range, two live guide-lines appear:
– **Green** at `rangeHigh`
– **Red** at `rangeLow`
• The script is now “armed,” waiting indefinitely for the first true breakout.
5. **BREAKOUT & BOX CREATION**
• **Up breakout** =`high > rangeHigh` → rectangle drawn in **green**.
• **Down breakout**=`low < rangeLow` → rectangle drawn in **red**.
• Box extends from **startBar** to the breakout bar and never updates again.
• Optional labels print the dollar and percentage height of the box at its left edge.
6. **OPTIONAL COOLDOWN**
• After the box is painted the script can stay silent for a user-defined number of bars, letting you study the fallout without another range immediately arming on top of it.
---
### INPUT PARAMETERS
• **ANCHOR TIME** – Precise yyyy-mm-dd HH:MM:SS that seeds the sequence.
• **BARS TO DEFINE RANGE** – Default 7; affects both definition and validation windows.
• **OPTIONAL TOLERANCE** – Absolute price buffer to ignore micro-wicks.
• **COOLDOWN BARS AFTER BREAKOUT** – Pause length before the indicator is allowed to re-anchor (set to zero to disable).
• **SHOW BOX DISTANCE LABELS** – Toggle to print Δ\$ and Δ% on every completed box.
---
### USER WORKFLOW
1. Add the indicator, open settings, and set **ANCHOR TIME** to the candle you care about (e.g., “2025-04-23 09:30:00” for NYSE open).
2. Watch live as the script:
– Paints the seven-bar range.
– Draws validation lines.
– Locks in the box on breakout.
3. Use the box boundaries as structural stops, targets, or context for further trades.
---
### PRACTICAL APPLICATIONS
• **OPENING RANGE BREAKOUTS** – Anchor at the first second of the session; capture the initial 7-bar range and trade the first clean break.
• **EVENT STUDIES** – Anchor at a news candle to measure immediate post-event volatility.
• **VOLUME PROFILE FUSION** – Combine the anchored box with VPVR to see if the breakout occurs at a high-volume node or a low-liquidity pocket.
• **RISK DISCIPLINE** – Stop-loss can sit just inside the opposite edge of the anchored range, enforcing objective risk.
---
### ADVANCED CUSTOMISATION IDEAS
• **MULTIPLE ANCHORS** – Clone the indicator and anchor several boxes (e.g., London open, New York open).
• **DYNAMIC WINDOW** – Switch the 7-bar fixed length to a volatility-scaled length (ATR percentile).
• **STRATEGY WRAPPER** – Turn the indicator into a `strategy{}` script and back-test anchored boxes on decades of data.
---
### FINAL THOUGHTS
Anchored Darvas Boxes give you Darvas’s timeless range-break methodology anchored to any candle of interest—perfect for dissecting openings, economic releases, or your own bespoke “important” bars with laboratory precision.

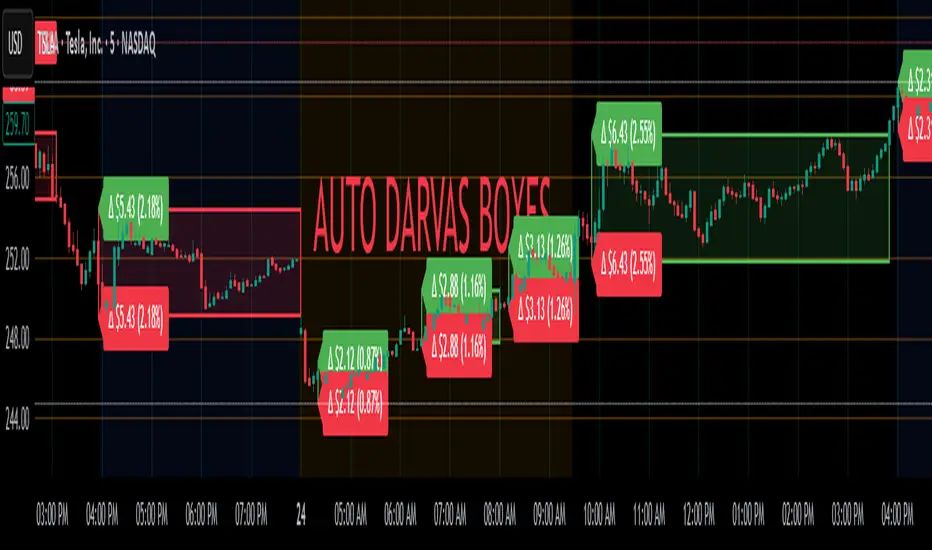
Auto Darvas Boxes## AUTO DARVAS BOXES
---
### OVERVIEW
**Auto Darvas Boxes** is a fully-automated, event-driven implementation of Nicolas Darvas’s 1950s box methodology.
The script tracks consolidation zones in real time, verifies that price truly “respects” those zones for a fixed validation window, then waits for the first decisive range violation to mark a directional breakout.
Every box is plotted end-to-end—from the first candle of the sideways range to the exact candle that ruptures it—giving you an on-chart, visually precise record of accumulation or distribution and the expansion that follows.
---
### HISTORICAL BACKGROUND
* Nicolas Darvas was a professional ballroom dancer who traded U.S. equities by telegram while touring the world.
* Without live news or Level II, he relied exclusively on **price** to infer institutional intent.
* His core insight: true market-moving entities leave footprints in the form of tight ranges; once their buying (or selling) is complete, price erupts out of the “box.”
* Darvas’s original procedure was manual—he kept notebooks, drew rectangles around highs and lows, and entered only when price punched out of the roof of a valid box.
* This indicator distills that logic into a rolling, self-resetting state machine so you never miss a box or breakout on any timeframe.
---
### ALGORITHM DETAIL (FOUR-STATE MACHINE)
**STATE 0 – RANGE DEFINITION**
• Examine the last *N* candles (default 7).
• Record `rangeHigh = highest(high, N) + tolerance`.
• Record `rangeLow = lowest(low, N) – tolerance`.
• Remember the index of the earliest bar in this window (`startBar`).
• Immediately transition to STATE 1.
**STATE 1 – RANGE VALIDATION**
• Observe the next *N* candles (again default 7).
• If **any** candle prints `high > rangeHigh` or `low < rangeLow`, the validation fails and the engine resets to STATE 0 **beginning at the violating candle**—no halfway boxes, no overlap.
• If all *N* candles remain inside the range, the box becomes **armed** and we transition to STATE 2.
**STATE 2 – ARMED (LIVE VISUAL FEEDBACK)**
• Draw a **green horizontal line** at `rangeHigh`.
• Draw a **red horizontal line** at `rangeLow`.
• Lines are extended in real time so the user can see the “live” Darvas ceiling and floor.
• Engine waits indefinitely for a breakout candle:
– **Up-Breakout** if `high > rangeHigh`.
– **Down-Breakout** if `low < rangeLow`.
**STATE 3 – BREAKOUT & COOLDOWN**
• Upon breakout the script:
1. Deletes the live range lines.
2. Draws a **filled rectangle (box)** from `startBar` to the breakout bar.
◦ **Green fill** when price exits above the ceiling.
◦ **Red fill** when price exits below the floor.
3. Optionally prints two labels at the left edge of the box:
◦ Dollar distance = `rangeHigh − rangeLow`.
◦ Percentage distance = `(rangeHigh − rangeLow) / rangeLow × 100 %`.
• After painting, the script waits a **user-defined cooldown** (default = 7 bars) before reverting to STATE 0. The cooldown guarantees separation between consecutive tests and prevents overlapping rectangles.
---
### INPUT PARAMETERS (ALL ADJUSTABLE FROM THE SETTINGS PANEL)
* **BARS TO DEFINE RANGE** – Number of candles used for both the definition and validation windows. Classic Darvas logic uses 7 but feel free to raise it on higher timeframes or volatile instruments.
* **OPTIONAL TOLERANCE** – Absolute price buffer added above the ceiling and below the floor. Use a small tolerance to ignore single-tick spikes or data-feed noise.
* **COOLDOWN BARS AFTER BREAKOUT** – How long the engine pauses before hunting for the next consolidation. Setting this equal to the range length produces non-overlapping, evenly spaced boxes.
* **SHOW BOX DISTANCE LABELS** – Toggle on/off. When on, each completed box displays its vertical size in both dollars and percentage, anchored at the box’s left edge.
---
### REAL-TIME VISUALISATION
* During the **armed** phase you see two extended, colour-coded guide-lines showing the exact high/low that must hold.
* When the breakout finally occurs, those lines vanish and the rectangle instantly appears, coloured to match the breakout direction.
* This immediate visual feedback turns any chart into a live Darvas tape—no manual drawing, no lag.
---
### PRACTICAL USE-CASES & BEST-PRACTICE WORKFLOWS
* **INTRADAY MOMENTUM** – Drop the script on 1- to 15-minute charts to catch tight coils before they explode. The coloured box marks the precise origin of the expansion; stops can sit just inside the opposite side of the box.
* **SWING & POSITION TRADING** – On 4-hour or daily charts, boxes often correspond to accumulation bases or volatility squeezes. Waiting for the box-validated breakout filters many false signals.
* **MEAN-REVERSION OR “FADE” STRATEGIES** – If a breakout immediately fails and price re-enters the box, you may have trapped momentum traders; fading that failure can be lucrative.
* **RISK MANAGEMENT** – Box extremes provide objective, structure-based stop levels rather than arbitrary ATR multiples.
* **BACK-TEST RESEARCH** – Because each box is plotted from first range candle to breakout candle, you can programmatically measure hold time, range height, and post-breakout expectancy for any asset.
---
### CUSTOMISATION IDEAS FOR POWER USERS
* **VOLATILITY-ADAPTIVE WINDOW** – Replace the fixed 7-bar length with a dynamic value tied to ATR percentile so the consolidation window stretches or compresses with volatility.
* **MULTI-TIMEFRAME LOGIC** – Only arm a 5-minute box if the 1-hour trend is aligned.
* **STRATEGY WRAPPER** – Convert the indicator to a full `strategy{}` script, automate entries on breakouts, and benchmark performance across assets.
* **ALERTS** – Create TradingView alerts on both up-breakout and down-breakout conditions; route them to webhook for broker automation.
---
### FINAL THOUGHTS
**Auto Darvas Boxes** packages one of the market’s oldest yet still potent price-action frameworks into a modern, self-resetting indicator. Whether you trade equities, futures, crypto, or forex, the script highlights genuine contraction-expansion sequences—Darvas’s original “boxes”—with zero manual effort, letting you focus solely on execution and risk.
Custom Performance TableThis script generates a table designed to provide a concise yet highly customizable overview of the performance of multiple financial instruments, displayed directly on the chart. The table can include up to 40 tickers, each individually configurable, with values updated in real time based on either the current chart timeframe or a specific user-selected timeframe.
NOTE : The update frequency of the table values depends on the refresh rate of the chart's main ticker to which the indicator is applied. To ensure a consistent and reliable data feed, especially when monitoring heterogeneous instruments, it is recommended to apply the indicator to a highly liquid and continuously traded asset, such as BTCUSD.
PERFORMANCE CALCULATION MODES
You can choose from three different performance calculation modes:
1) Change % (Percentage Change)
Displays the percentage change of the current price compared to the previous candle within the selected timeframe.
(Current Price - Previous Price) / Previous Price * 100
This mode provides an immediate and straightforward measure of each instrument's percentage movement, useful for quick visual comparisons of relative strength among assets.
2) Z-Score
The Z-Score measures how much the current price variation deviates from the historical average variation, relative to the standard deviation of those variations.
(Current Variation - Average Variation) / Standard Deviation of Variations
The result indicates how statistically unusual a movement is:
- Values near 0 suggest normal variations.
- Values above ±2 indicate statistically significant deviations.
This is a valuable tool for identifying overbought/oversold conditions or market stress events and is often used in mean reversion strategies.
NOTE : Due to technical constraints, Z-Score can only be calculated when the selected timeframe matches the chart's timeframe exactly.
3) RAROC (Risk-Adjusted Return on Capital)
RAROC expresses an asset's performance in relation to the risk taken, measured through its volatility (standard deviation of price).
Percentage Change / Standard Deviation of Price
It allows for an assessment of return efficiency in relation to volatility.
A high RAROC value indicates a high return relative to the risk, making it a useful tool for comparing assets with different risk profiles. It is especially suitable for portfolio selection and allocation purposes.
TABLE CONFIGURATION
Each ticker can be customized with its own label, colors, and position in the table.
Each row can display the ticker name or a custom label, which, at the user's discretion, can either replace the name or be shown as an informational tooltip.
The table can be placed anywhere on the chart using horizontal and vertical offset parameters. Thanks to offset support, you can, for example, create financial market overview layouts. This can be done by completely “cleaning” the chart from price and indicators using TradingView settings, and then displaying multiple tables simultaneously (see the example chart published here).
Advanced customization options are also available for the table's appearance, including font settings, colors, borders, and more.
CALCULATION TIMEFRAME
The indicator allows the user to force a specific timeframe (Daily, Weekly, Monthly, Yearly) when applied to intraday charts.
However, for Z-Score mode, the selected timeframe must match the chart's timeframe exactly to ensure correct computation. Otherwise, the script will halt until settings are properly adjusted.
USAGE NOTES
Custom Performance Table is a flexible and adaptable tool, suitable for both intraday operations and medium- to long-term analysis. It is designed for traders and analysts who need to compare assets based on quantitative metrics, whether simple (like percentage change) or more advanced and risk-adjusted (such as Z-Score and RAROC).
