Altcoin Reversal or Correction DetectionINDICATOR OVERVIEW: Altcoin Reversal or Correction Detection
Altcoin Reversal or Correction Detection is a powerful crypto-specific indicator designed exclusively for altcoins by analyzing their RSI values across multiple timeframes alongside Bitcoin’s RSI. Since BTC's price movements have a strong influence on altcoins, this tool helps traders better understand whether a reversal or correction signal is truly reliable or just noise. Even if an altcoin appears oversold or overbought, it may continue trending with BTC—so this indicator gives you the full picture.
The indicator is optimized for CRYPTO MARKETS only. Not suitable for BTC itself—this is a precision tool built only for ALTCOINS only.
This indicator is not only for signals but also serves as a tool for observing all the information from different timeframes of BTC and altcoins collectively.
How the Calculation Works: Algorithm Overview
The Altcoin Reversal or Correction Detection indicator relies on an algorithm that compares the RSI values of the altcoin across multiple timeframes with Bitcoin's RSI values. This allows the indicator to identify key market moments where a reversal or correction might occur.
BTC-Altcoin RSI Correlation: The algorithm looks for the correlation between Bitcoin's price movements and the altcoin's price actions, as BTC often influences the direction of altcoins. When both Bitcoin and the altcoin show either overbought or oversold conditions in a significant number of timeframes, the indicator signals the potential for a reversal or correction.
Multi-Timeframe Confirmation: Unlike traditional indicators that may focus on a single timeframe, this tool checks multiple timeframes for both BTC and the altcoin. When the same overbought/oversold conditions are met across multiple timeframes, it confirms the likelihood of a trend reversal or correction, providing a more reliable signal. The more timeframes that align with this pattern, the stronger the signal becomes.
Overbought/Oversold Conditions & Extreme RSI Values: The algorithm also takes into account the size of the RSI values, especially focusing on extreme overbought and oversold levels. The greater the RSI values are in these extreme regions, the stronger the potential reversal or correction signal. This means that not only do multiple timeframes need to confirm the condition, but the magnitude of the overbought or oversold RSI level plays a crucial role in determining the strength of the signal.
Signal Strength Levels: The signals are classified into three levels:
Early Signal
Strong Signal
Very Strong Signal
By taking into account the multi-timeframe analysis of both BTC and the altcoin RSI values, along with the magnitude of these RSI values, the indicator offers a highly reliable method for detecting potential reversals and corrections.
Who Is This Indicator Suitable For?
This indicator can also be used to detect reversal points, but it is especially effective for scalping. It highlights potential correction points, making it perfect for quick entries during smaller market pullbacks or short-term trend shifts, which is more suitable for scalpers looking to capitalize on short-term movements
Integration with other tools
Use this tool alongside key Support and Resistance zones to further enhance your trade by filtering for even better quality entries and focusing only on high-quality reversal or correction setups. It can be also used with other indicators and suitable with other personalised strategies.
Trend Analysis

Parabolic RSI [ChartPrime]The Parabolic RSI indicator applies the Parabolic SAR directly to the Relative Strength Index (RSI) . This combination helps traders identify trend shifts and potential reversal points within the RSI framework. The indicator provides both regular and strong signals based on whether the Parabolic SAR crosses above or below key RSI thresholds.
⯁ KEY FEATURES
Parabolic SAR Applied to RSI – Tracks momentum shifts within the RSI indicator.
Dynamic SAR Dots – Plots SAR levels directly on the RSI for visual clarity.
Threshold-Based Signal Filtering – Uses upper (70) and lower (30) RSI levels to determine strong signals.
Simple and Strong Signal System :
Big Diamonds (Strong Signals) – Appear when Parabolic SAR crosses above 70 or below 30 RSI, indicating potential reversals.
Small Diamonds (Regular Signals) – Appear when Parabolic SAR flips inside the RSI range, signaling weaker trend shifts.
Chart Overlay Signals – Highlights strong RSI-based trend shifts directly on the price chart.
Fully Customizable – Modify RSI length, SAR parameters, colors, and signal displays.
⯁ HOW TO USE
Look for strong signals (big diamonds) when SAR flips above 70 RSI (overbought) or below 30 RSI (oversold) for potential reversals.
Use regular signals (small diamonds) for minor trend shifts within the RSI range.
Combine with price action and other indicators to confirm entry and exit points.
Adjust the SAR acceleration factors to fine-tune sensitivity based on market conditions.
⯁ CONCLUSION
The Parabolic RSI indicator merges trend-following and momentum-based analysis by applying the Parabolic SAR to RSI. This allows traders to detect trend shifts inside the RSI space with an intuitive diamond-based signal system . Whether used alone or as part of a broader trading strategy, this indicator provides a clear and structured approach to identifying momentum reversals and potential trading opportunities.

Gradient Range [BigBeluga]
This indicator highlights range-bound market conditions by dynamically plotting gradient-colored candlesticks within a defined price box. It detects whether the market is ranging or trending using ADX and can identify mean reversion points when price steps outside the established range.
🔵KEY FEATURES:
Range Detection Box:
➣ A transparent box is drawn based on the highest and lowest price close over a user-defined period.
➣ Helps visualize range boundaries and the midline for support/resistance reference.
Gradient Candlestick Coloring:
➣ Candles inside the range are colored with a gradient from top to bottom based on proximity to the midline.
➣ Top range candles are shaded with bearish tones, while bottom range candles use bullish tones.
Ranging/Trending State Detection:
➣ Uses ADX to determine if the market is currently in a ranging or trending state.
➣ A label in the bottom right corner shows a real-time status (🟢 Ranging / 🟡 Trending).
Mean Reversion Signal Circles:
➣ When the market is ranging, white circles are plotted at highs/lows that breach the box boundary, indicating potential mean reversion points.
➣ These levels can act as fade trade setups or exhaustion markers.
🔵USAGE:
Range Trading: Trade between the upper and lower boundaries during range-bound conditions with clearer visual feedback.
Mean Reversion Plays: Use circle signals as early alerts to identify when price extends beyond the range and may revert to the mean.
Visual Trend Strength: Instantly recognize where price is concentrated inside the range via the color gradient system.
Ranging Filter: Use the ADX label to avoid false setups during strong trending periods.
Gradient Range provides an elegant and data-driven approach to range-bound market analysis. With its gradient visualization and smart reversion detection, it empowers traders to better time entries and exits within consolidation zones.

Constance Brown RSI with Composite IndexConstance Brown RSI with Composite Index
Overview
This indicator combines Constance Brown's RSI interpretation methodology with a Composite Index and ATR Distance to VWAP measurement to provide a comprehensive trading tool. It helps identify trends, momentum shifts, overbought/oversold conditions, and potential reversal points.
Key Features
Color-coded RSI zones for immediate trend identification
Composite Index for momentum analysis and divergence detection
ATR Distance to VWAP for identifying extreme price deviations
Automatic divergence detection for early reversal warnings
Pre-configured alerts for key trading signals
How to Use This Indicator
Trend Identification
The RSI line changes color based on its position:
Blue zone (RSI > 50): Bullish trend - look for buying opportunities
Purple zone (RSI < 50): Bearish trend - look for selling opportunities
Gray zone (RSI 40-60): Neutral/transitional market - prepare for potential breakout
The 40-50 area (light blue fill) acts as support during uptrends, while the 50-60 area (light purple fill) acts as resistance during downtrends.
// From the code:
upTrendZone = rsiValue > 50 and rsiValue <= 90
downTrendZone = rsiValue < 50 and rsiValue >= 10
neutralZone = rsiValue > 40 and rsiValue < 60
rsiColor = neutralZone ? neutralRSI : upTrendZone ? upTrendRSI : downTrendRSI
Momentum Analysis
The Composite Index (fuchsia line) provides momentum confirmation:
Values above 50 indicate positive momentum
Values below 40 indicate negative momentum
Crossing above/below these thresholds signals potential momentum shifts
// From the code:
compositeIndexRaw = rsiChange / ta.stdev(rsiValue, rsiLength)
compositeIndex = ta.sma(compositeIndexRaw, compositeSmoothing)
compositeScaled = compositeIndex * 10 + 50 // Scaled to fit 0-100 range
Overbought/Oversold Detection
The ATR Distance to VWAP table in the top-right corner shows how far price has moved from VWAP in terms of ATR units:
Extreme positive values (orange/red): Potentially overbought
Extreme negative values (purple/red): Potentially oversold
Near zero (gray): Price near average value
// From the code:
priceDistance = (close - vwapValue) / ta.atr(atrPeriod)
// Color coding based on distance value
Divergence Trading
The indicator automatically detects divergences between the Composite Index and price:
Bullish divergence: Price makes lower low but Composite Index makes higher low
Bearish divergence: Price makes higher high but Composite Index makes lower high
// From the code:
divergenceBullish = ta.lowest(compositeIndex, rsiLength) > ta.lowest(close, rsiLength)
divergenceBearish = ta.highest(compositeIndex, rsiLength) < ta.highest(close, rsiLength)
Trading Strategies
Trend Following
1. Identify the trend using RSI color:
Blue = Uptrend, Purple = Downtrend
2. Wait for pullbacks to support/resistance zones:
In uptrends: Buy when RSI pulls back to 40-50 zone and bounces
In downtrends: Sell when RSI rallies to 50-60 zone and rejects
3. Confirm with Composite Index:
Uptrends: Composite Index stays above 50 or quickly returns above it
Downtrends: Composite Index stays below 50 or quickly returns below it
4. Manage risk using ATR Distance:
Take profits when ATR Distance reaches extreme values
Place stops beyond recent swing points
Reversal Trading
1. Look for divergences
Bullish: Price makes lower low but Composite Index makes higher low
Bearish: Price makes higher high but Composite Index makes lower high
2. Confirm with ATR Distance:
Extreme readings suggest potential reversals
3. Wait for RSI zone transition:
Bullish: RSI crosses above 40 (purple to neutral/blue)
Bearish: RSI crosses below 60 (blue to neutral/purple)
4. Enter after confirmation:
Use candlestick patterns for precise entry
Place stops beyond the divergence point
Four pre-configured alerts are available:
Momentum High: Composite Index above 50
Momentum Low: Composite Index below 40
Bullish Divergence: Composite Index higher low
Bearish Divergence: Composite Index lower high
Customization
Adjust these parameters to optimize for your trading style:
RSI Length: Default 14, lower for more sensitivity, higher for fewer signals
Composite Index Smoothing: Default 10, lower for quicker signals, higher for less noise
ATR Period: Default 14, affects the ATR Distance to VWAP calculation
This indicator works well across various markets and timeframes, though the default settings are optimized for daily charts. Adjust parameters for shorter or longer timeframes as needed.
Happy trading!

Quarters Theory Levels (Yotov Style)John Alex Sagwe's Quarters Theory Levels Script
This Pine Script, developed by John Alex Sagwe, is based on the concept of the "Quarters Theory" popularized by Illan Yotov. It aims to help traders identify key levels in the market using whole, half, and quarter-level calculations. The script plots major whole levels, half levels, and quarter levels above and below the current price, allowing traders to visualize potential price points where significant market action might occur.
The customizable parameters allow you to:
Set the base level and step size (for quarter levels),
Adjust the number of levels above and below the current price to be displayed,
Toggle between showing whole, half, or quarter levels,
Use price alerts when the market price nears these levels.
Whether you’re a novice or an experienced trader, this script can help you integrate the Quarters Theory into your trading strategy. It’s designed to be flexible and user-friendly, helping you visualize key market levels with ease.
Developed by: John Alex Sagwe, an avid trader and Pine Script enthusiast.

Session extensions [dani]Session Extension
Indicator Description
The Session Extensions indicator is a customizable tool designed to visually represent key price levels during a specified trading session. It calculates and displays the high, low, and midpoints of the session, along with extension levels based on user-defined multipliers. These extensions help traders identify potential support and resistance zones beyond the initial session range.
This indicator is particularly useful for intraday traders who rely on session-based analysis to make informed decisions. It overlays directly on the chart, ensuring seamless integration with price action.
Key Features
Session-Based Analysis : Tracks and highlights key price levels (high, low, midpoint) during a specific trading session.
Customizable Extension Levels : Allows users to define up to six extension levels (both above and below the session range) with unique multipliers, colors, styles, and widths.
Real-Time Updates : Automatically updates during the active session and resets at the start of a new session.
Usage Guidelines
Add the Indicator to Your Chart : Apply the Session Extensions indicator to your chart to visualize key session-based levels.
Intraday Focus : This indicator is optimized for intraday trading. Ensure that the chart's timeframe is set to an intraday interval (e.g., 1-minute, 5-minute).
Session Alignment : Verify that the session time aligns with your trading schedule and timezone. Misalignment may result in incorrect session detection. (This indicator use America - New York timezone)
Avoid Overcrowding : While the indicator supports multiple extension levels, enabling too many levels simultaneously may clutter the chart. Use discretion when configuring extension levels.
Customize Line Styles and Colors : Tailor the appearance of lines and labels to align with your trading style. Use solid, dashed, or dotted lines, and choose colors that enhance visibility without cluttering the chart.
Combine with Other Tools : Pair this indicator with other technical analysis tools (e.g., moving averages, volume profiles) to enhance decision-making.
Disclaimer & Chat
The Session Extensions indicator is intended for educational and analytical purposes only. It does not provide financial advice or guarantee trading success. Users are responsible for verifying the accuracy of session times and ensuring proper configuration before using the indicator in live trading. This indicator is not a trading signal generator.
Thank you for choosing this indicator! I hope it becomes a valuable part of your trading toolkit. Remember, trading is a journey, and having the right tools can make all the difference. Whether you're a seasoned trader or just starting out, this indicator is designed to help you stay organized and focused on what matters most—price action. Happy trading, and may your charts be ever in your favor! 😊
From, Dani.

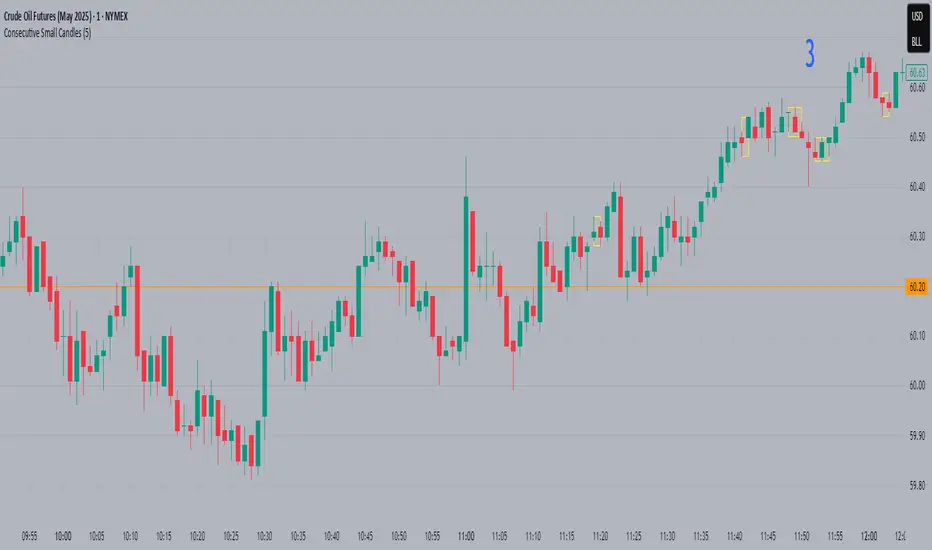
Consecutive Small CandlesThis script identifies relatively "small" candles based on their being smaller than a maximum size you set based on the instrument and your own criteria. Default is 5, as I use this indicator largely on CL which rarely has candles smaller than 3 ticks but frequently greater than 5.
It identifies 2 or more consecutive candles to help identify patterns similar to Bob Volman's Double Doji Break methodolgy. Written by Grok 3.
Candlestick Pattern Indicator – Doji, Harami, More [algo_aakash]This Candlestick Pattern Indicator is designed to help traders identify key price action patterns like Bullish Engulfing, Bearish Engulfing, Doji, Hammer, Morning Star, Evening Star, and many more directly on your TradingView chart. With customizable options to display both bullish and bearish patterns , this indicator provides real-time visual markers and labels, helping you make informed trading decisions.
Key features of the indicator include:
Detects popular candlestick patterns such as Bullish Engulfing, Bearish Engulfing, Hammer, Morning Star, Tweezer Tops, and more.
Customizable settings for displaying pattern shapes, labels, and opacity, tailored to your trading preferences.
Option to plot signals only after a candle closes, ensuring accuracy.
Alerts for immediate notification of detected patterns.
Visual markers on the chart, including arrows and labels, for quick recognition of potential trade setups.
This indicator is ideal for traders who rely on candlestick patterns for technical analysis and want an automated tool to highlight these setups for easier decision-making.
Whether you're a beginner or an experienced trader, this tool will help you spot important patterns in real-time without cluttering your chart.

ES1! vs ZB1! Exponentially Weighted CorrelationES1! vs ZB1! Exponentially Weighted Correlation
This indicator calculates and visualizes the exponentially weighted correlation between the S&P 500 E-mini futures (ES1!) and the 30-Year U.S. Treasury Bond futures (ZB1!) over a user-defined lookback period. By using an exponential moving average (EMA) approach, it emphasizes recent price movements, providing a dynamic view of the relationship between these two key financial instruments.
Features:
- Customizable Inputs: Adjust the lookback length (default: 60) and alpha (default: 0.1) to fine-tune the sensitivity of the correlation calculation.
- Exponentially Weighted Correlation: Measures the strength and direction of the relationship between ES1! and ZB1! prices, with more weight given to recent data.
- Visual Clarity: Displays correlation as colored bars (green for positive, red for negative) for quick interpretation, with reference lines at 0, +1, and -1 for context.
- Non-Overlay Design: Plotted in a separate panel below the chart to avoid cluttering price data.
How It Works:
The indicator fetches closing prices for ES1! and ZB1!, applies an EMA to smooth the data, and computes the exponentially weighted covariance and variances. The correlation is then derived and plotted as a histogram, helping traders identify whether the two markets are moving together (positive correlation), in opposite directions (negative correlation), or independently.
Use Cases:
- Market Analysis: Gauge the relationship between equity and bond markets to inform trading strategies.
- Risk Management: Monitor correlation shifts to adjust portfolio exposure.
- Intermarket Insights: Identify trends or divergences in the stock-bond dynamic for macroeconomic analysis.
Ideal for traders and analysts tracking intermarket relationships, this indicator offers a clear, responsive tool for understanding ES1! and ZB1! correlation in real-time.

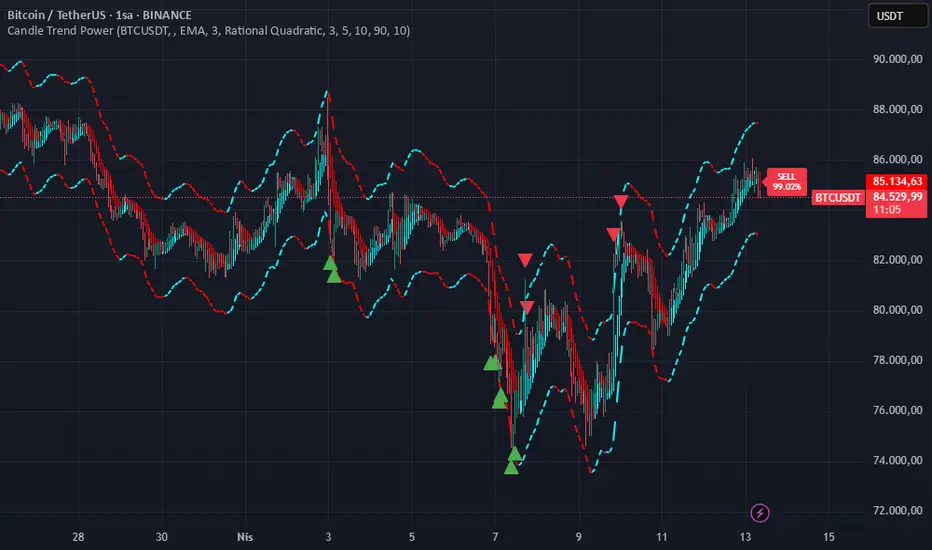
Candle Trend PowerThe Candle Trend Power is a custom technical indicator designed for advanced trend analysis and entry signal generation. It combines multiple smoothing methods, candle transformations, and volatility bands to visually and analytically enhance your trading decisions.
🔧 Main Features:
📉 Custom Candle Types
It transforms standard OHLC candles into one of several advanced types:
Normal Candles, Heikin-Ashi, Linear Regression, Rational Quadratic (via kernel filtering), McGinley Dynamic Candles
These transformations help traders better see trend continuations and reversals by smoothing out market noise.
🧮 Smoothing Method for Candle Data
Each OHLC value can be optionally smoothed using:
EMA, SMA, SMMA (RMA), WMA, VWMA, HMA, Mode (Statistical mode) Or no smoothing at all.
This flexibility is useful for customizing to different market conditions.
📊 Volatility Bands
Volatility-based upper and lower bands are calculated using:
Band = price ± (price% + ATR * multiplier)
They help identify overbought/oversold zones and potential reversal points.
📍 Candle Color Logic
Each candle is colored:
Cyan (#00ffff) if it's bullish and stronger than the previous candle
Red (#fd0000) if it's bearish and weaker
Alternating bar index coloring improves visual clarity.
📈 Trend Momentum Labels
The script includes a trend strength estimation using a smoothed RSI:
If the candle is bullish, it shows a BUY label with the overbought offset.
If bearish, it shows a SELL label with the oversold offset.
These labels are dynamic and placed next to the bar.
📍 Signal Markers
It also plots triangles when the price crosses the volatility bands:
Triangle up for potential long
Triangle down for potential short
✅ Use Case Summary
This script is mainly used for:
Visual trend confirmation with enhanced candles
Volatility-based entry signals
RSI-based trend momentum suggestions
Integrating different smoothing & transformation methods to fine-tune your strategy
It’s a flexible tool for both manual traders and automated system developers who want clear, adaptive signals across different market conditions.
💡 What's Different
🔄 Candle Type Transformations
⚙️ Custom Candle Smoothing
📉 Candle's Multi-level Volatility Bands
🔺 Dynamic Entry Signals (Buy/Sell Labels)
❗Important Note:
This script is provided for educational purposes and does not constitute financial advice. Traders and investors should conduct their research and analysis before making any trading decisions.
Candle vs 8 SMA - Red & Green📈 Script Name: Candle vs 8 SMA – Red & Green
This TradingView Pine Script visually compares each candle's close price to the 8-period Simple Moving Average (SMA) and highlights the chart accordingly:
🔍 What It Does:
Calculates the 8-period SMA
sma8 = ta.sma(close, 8)
This line computes the average of the last 8 closing prices to smooth out short-term fluctuations.
Plots the SMA Line
Orange line shown on the chart.
Helps you visually track the short-term trend.
Identifies Candle Position
candleAbove: true if the candle’s close is above the SMA
candleBelow: true if the candle’s close is below the SMA
Highlights Background
If the close is above the 8 SMA → Green background (indicating bullish behavior)
If the close is below the 8 SMA → Red background (indicating bearish behavior)
Plots Triangle Shapes
Green triangle below candle when above the SMA
Red triangle above candle when below the SMA
Helps quickly identify conditions at a glance
🧠 Why Use It?
This script is useful for:
Intraday trend confirmation
Spotting momentum shifts
Visual clarity on how price reacts to a dynamic support/resistance (SMA)
Aiding quick decisions for scalping or intraday trades

Green*DiamondGreen*Diamond (GD1)
Unleash Dynamic Trading Signals with Volatility and Momentum
Overview
GreenDiamond is a versatile overlay indicator designed for traders seeking actionable buy and sell signals across various markets and timeframes. Combining Volatility Bands (VB) bands, Consolidation Detection, MACD, RSI, and a unique Ribbon Wave, it highlights high-probability setups while filtering out noise. With customizable signals like Green-Yellow Buy, Pullback Sell, and Inverse Pullback Buy, plus vibrant candle and volume visuals, GreenDiamond adapts to your trading style—whether you’re scalping, day trading, or swing trading.
Key Features
Volatility Bands (VB): Plots dynamic upper and lower bands to identify breakouts or reversals, with toggleable buy/sell signals outside consolidation zones.
Consolidation Detection: Marks low-range periods to avoid choppy markets, ensuring signals fire during trending conditions.
MACD Signals: Offers flexible buy/sell conditions (e.g., cross above signal, above zero, histogram up) with RSI divergence integration for precision.
RSI Filter: Enhances signals with customizable levels (midline, oversold/overbought) and bullish divergence detection.
Ribbon Wave: Visualizes trend strength using three EMAs, colored by MACD and RSI for intuitive momentum cues.
Custom Signals: Includes Green-Yellow Buy, Pullback Sell, and Inverse Pullback Buy, with limits on consecutive signals to prevent overtrading.
Candle & Volume Styling: Blends MACD/RSI colors on candles and scales volume bars to highlight momentum spikes.
Alerts: Set up alerts for VB signals, MACD crosses, Green*Diamond signals, and custom conditions to stay on top of opportunities.
How It Works
Green*Diamond integrates multiple indicators to generate signals:
Volatility Bands: Calculates bands using a pivot SMA and standard deviation. Buy signals trigger on crossovers above the lower band, sell signals on crossunders below the upper band (if enabled).
Consolidation Filter: Suppresses signals when candle ranges are below a threshold, keeping you out of flat markets.
MACD & RSI: Combines MACD conditions (e.g., cross above signal) with RSI filters (e.g., above midline) and optional volume spikes for robust signals.
Custom Logic: Green-Yellow Buy uses MACD bullishness, Pullback Sell targets retracements, and Inverse Pullback Buy catches reversals after downmoves—all filtered to avoid consolidation.
Visuals: Ribbon Wave shows trend direction, candles blend momentum colors, and volume bars scale dynamically to confirm signals.
Settings
Volatility Bands Settings:
VB Lookback Period (20): Adjust to 10–15 for faster markets (e.g., 1-minute scalping) or 25–30 for daily charts.
Upper/Lower Band Multiplier (1.0): Increase to 1.5–2.0 for wider bands in volatile stocks like AEHL; decrease to 0.5 for calmer markets.
Show Volatility Bands: Toggle off to reduce chart clutter.
Use VB Signals: Enable for breakout-focused trades; disable to focus on Green*Diamond signals.
Consolidation Settings:
Consolidation Lookback (14): Set to 5–10 for small caps (e.g., AEHL) to catch quick consolidations; 20 for higher timeframes.
Range Threshold (0.5): Lower to 0.3 for stricter filtering in choppy markets; raise to 0.7 for looser signals.
MACD Settings:
Fast/Slow Length (12/26): Shorten to 8/21 for scalping; extend to 15/34 for swing trading.
Signal Smoothing (9): Reduce to 5 for faster signals; increase to 12 for smoother trends.
Buy/Sell Signal Options: Choose “Cross Above Signal” for classic MACD; “Histogram Up” for momentum plays.
Use RSI Div + MACD Cross: Enable for high-probability reversal signals.
RSI Settings:
RSI Period (14): Drop to 10 for 1-minute charts; raise to 20 for daily.
Filter Level (50): Set to 55 for stricter buys; 45 for sells.
Overbought/Oversold (70/30): Tighten to 65/35 for small caps; widen to 75/25 for indices.
RSI Buy/Sell Options: Select “Bullish Divergence” for reversals; “Cross Above Oversold” for momentum.
Color Settings:
Adjust bullish/bearish colors for visibility (e.g., brighter green/red for dark themes).
Border Thickness (1): Increase to 2–3 for clearer candle outlines.
Volume Settings:
Volume Average Length (20): Shorten to 10 for scalping; extend to 30 for swing trades.
Volume Multiplier (2.0): Raise to 3.0 for AEHL’s volume surges; lower to 1.5 for steady stocks.
Bar Height (10%): Increase to 15% for prominent bars; decrease to 5% to reduce clutter.
Ribbon Settings:
EMA Periods (10/20/30): Tighten to 5/10/15 for scalping; widen to 20/40/60 for trends.
Color by MACD/RSI: Disable for simpler visuals; enable for dynamic momentum cues.
Gradient Fill: Toggle on for trend clarity; off for minimalism.
Custom Signals:
Enable Green-Yellow Buy: Use for momentum confirmation; limit to 1–2 signals to avoid spam.
Pullback/Inverse Pullback % (50): Set to 30–40% for small caps; 60–70% for indices.
Max Buy Signals (1): Increase to 2–3 for active markets; keep at 1 for discipline.
Tips and Tricks
Scalping Small Caps (e.g., AEHL):
Use 1-minute charts with VB Lookback = 10, Consolidation Lookback = 5, and Volume Multiplier = 3.0 to catch $0.10–$0.20 moves.
Enable Green-Yellow Buy and Inverse Pullback Buy for quick entries; disable VB Signals to focus on Green*Diamond logic.
Pair with SMC+ green boxes (if you use them) for reversal confirmation.
Day Trading:
Try 5-minute charts with MACD Fast/Slow = 8/21 and RSI Period = 10.
Enable RSI Divergence + MACD Cross for high-probability setups; set Max Buy Signals = 2.
Watch for volume bars turning yellow to confirm entries.
Swing Trading:
Use daily charts with VB Lookback = 30, Ribbon EMAs = 20/40/60.
Enable Pullback Sell (60%) to exit after rallies; disable RSI Color for cleaner candles.
Check Ribbon Wave gradient for trend strength—bright green signals strong bulls.
Avoiding Noise:
Increase Consolidation Threshold to 0.7 on volatile days to skip false breakouts.
Disable Ribbon Wave or Volume Bars if the chart feels crowded.
Limit Max Buy Signals to 1 for disciplined trading.
Alert Setup:
In TradingView’s Alerts panel, select:
“GD Buy Signal” for standard entries.
“RSI Div + MACD Cross Buy” for reversals.
“VB Buy Signal” for breakout plays.
Set to “Once Per Bar Close” for confirmed signals; “Once Per Bar” for scalping.
Backtesting:
Replay on small caps ( Float < 5M, Price $0.50–$5) to test signals.
Focus on “GD Buy Signal” with yellow volume bars and green Ribbon Wave.
Avoid signals during gray consolidation squares unless paired with RSI Divergence.
Usage Notes
Markets: Works on stocks, forex, crypto, and indices. Best for volatile assets (e.g., small-cap stocks, BTCUSD).
Timeframes: Scalping (1–5 minutes), day trading (15–60 minutes), or swing trading (daily). Adjust settings per timeframe.
Risk Management: Combine with stop-losses (e.g., 1% risk, $0.05 below AEHL entry) and take-profits (3–5%).
Customization: Tweak inputs to match your strategy—experiment in replay to find your sweet spot.
Disclaimer
Green*Diamond is a technical tool to assist with trade identification, not a guarantee of profits. Trading involves risks, and past performance doesn’t predict future results. Always conduct your own analysis, manage risk, and test settings before live trading.
Feedback
Love Green*Diamond? Found a killer setup?

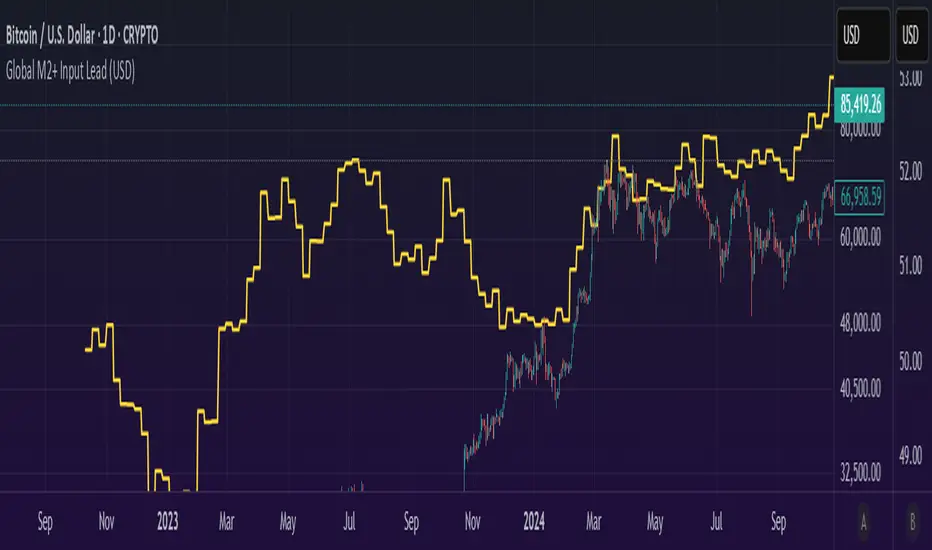
Global M2 Money+ Supply Input Lead (USD)Global M2 Money Supply + INR+CAD Input Lead (USD)
This indicator calculates the global M2 money supply in USD by aggregating M2 data from multiple economies, converted to USD using their respective exchange rates. It overlays the scaled M2 data on the chart with a user-defined time shift to analyze potential correlations with asset prices, such as Bitcoin. The indicator is designed to help traders assess global liquidity trends with a customizable lead or lag.
Countries Included:
Eurozone (EUM2)
North America: United States (USM2), Canada (CAM2)
Non-EU Europe: Switzerland (CHM2), United Kingdom (GBM2), Finland (FIM2), Russia (RUM2)
Pacific: New Zealand (NZM2)
Asia: China (CNM2), Taiwan (TWM2), Hong Kong (HKM2), India (INM2), Japan (JPM2), Philippines (PHM2), Singapore (SGM2)
Latin America: Brazil (BRM2), Colombia (COM2), Mexico (MXM2)
Middle East: United Arab Emirates (AEM2), Turkey (TRM2)
Africa: South Africa (ZAM2)
Input for Lead/Lag:
Time Shift (days): Adjust this input to shift the M2 data forward (positive values) or backward (negative values) on the chart. For example, setting a lead of 85 days shifts the M2 data 85 days into the future, helping traders analyze potential leading indicators for price movements.
Triple Confirmation Scalper v2 - Alarm CompatibleTriple Confirmation Scalper Strategy
A high-probability scalping strategy combining trend momentum, overbought/sold conditions, and volume confirmation to filter low-noise signals.
📊 Strategy Logic
Trend Direction
Dual EMA crossover (9 & 21 periods) for momentum and trend bias.
Overbought/Oversold Zones
RSI (14-period) to avoid entries at extremes.
Volume Spike Filter
OBV + 20-period volume average to confirm breakout validity.
Dynamic Risk Management
Stop-loss: Adaptive to recent price action (5-candle low/high ±1%).
Take-profit: 1.5% target (1.5:1 risk/reward).
🔍 Advanced Features
Precision VWAP (20-period, HLC3-based) for dynamic S/R levels.
Visual Aids:
EMA/VWAP bands + trend-colored background.
Volume spike alerts.
TradingView Alerts pre-configured for long/short signals.
⚙️ Default Settings
Commission: 0.1% factored into backtests.
Mode: Supports both long/short positions.
⚠️ Disclaimer
This is a technical analysis tool, not financial advice.
Past performance ≠ future results. Test thoroughly in a demo account.
Adjust parameters (e.g., EMA periods, RSI thresholds) to match your risk tolerance.
✅ TradingView Compliance Notes:
No exaggerated claims (e.g., "100% win rate").
Clear disclaimer included.
Focus on objective strategy logic (no promotional language).

Weekly Open (Current Week Only)📘 Indicator Name: Weekly Open (Current Week Only)
📝 Description:
This indicator plots a horizontal line representing the weekly open price, visible only during the current trading week. At the beginning of each new week (based on TradingView’s weekly time segmentation), the indicator captures the open price of the first candle and draws a constant line across the chart until the week ends. Once the new week begins, the line resets and updates with the new weekly open.
🎯 How to Use – ICT Concepts Integration (Weekly Profile):
This tool is designed to complement ICT (Inner Circle Trader) trading strategies, particularly within the weekly profile framework, by offering a clear and persistent visual of the weekly open, which is a critical reference point in ICT’s market structure theory.
✅ Use Cases:
Directional Bias:
According to ICT concepts, price trading above the weekly open suggests a bullish bias for the week, while trading below it implies bearish conditions.
Traders can use the weekly open line to align their intraweek trades with higher timeframe directional bias.
Dealing Ranges:
Weekly open helps frame the weekly dealing range, especially when combined with other levels like weekly high/low or previous week’s range.
It allows traders to identify potential liquidity pools or areas where price may seek to rebalance.
Mean Reversion Entries:
Price often reverts to or reacts from the weekly open. Traders may use this as a target or entry level, particularly during Monday/Tuesday setups.
Works well in conjunction with concepts like OTE (Optimal Trade Entry) and Judas Swings.
Risk Management:
Acts as a clean and visual anchor to structure stop losses or take-profits based on weekly bias shifts.

Moving Average Shift WaveTrend StrategyMoving Average Shift WaveTrend Strategy
🧭 Overview
The Moving Average Shift WaveTrend Strategy is a trend-following and momentum-based trading system designed to be overlayed on TradingView charts. It executes trades based on the confluence of multiple technical conditions—volatility, session timing, trend direction, and oscillator momentum—to deliver logical and systematic trade entries and exits.
🎯 Strategy Objectives
Enter trades aligned with the prevailing long-term trend
Exit trades on confirmed momentum reversals
Avoid false signals using session timing and volatility filters
Apply structured risk management with automatic TP, SL, and trailing stops
⚙️ Key Features
Selectable MA types: SMA, EMA, SMMA (RMA), WMA, VWMA
Dual-filter logic using a custom oscillator and moving averages
Session and volatility filters to eliminate low-quality setups
Trailing stop, configurable Take Profit / Stop Loss logic
“In-wave flag” prevents overtrading within the same trend wave
Visual clarity with color-shifting candles and entry/exit markers
📈 Trading Rules
✅ Long Entry Conditions:
Price is above the selected MA
Oscillator is positive and rising
200-period EMA indicates an uptrend
ATR exceeds its median value (sufficient volatility)
Entry occurs between 09:00–17:00 (exchange time)
Not currently in an active wave
🔻 Short Entry Conditions:
Price is below the selected MA
Oscillator is negative and falling
200-period EMA indicates a downtrend
All other long-entry conditions are inverted
❌ Exit Conditions:
Take Profit or Stop Loss is hit
Opposing signals from oscillator and MA
Trailing stop is triggered
🛡️ Risk Management Parameters
Pair: ETH/USD
Timeframe: 4H
Starting Capital: $3,000
Commission: 0.02%
Slippage: 2 pips
Risk per Trade: 2% of account equity (adjustable)
Total Trades: 224
Backtest Period: May 24, 2016 — April 7, 2025
Note: Risk parameters are fully customizable to suit your trading style and broker conditions.
🔧 Trading Parameters & Filters
Time Filter: Trades allowed only between 09:00–17:00 (exchange time)
Volatility Filter: ATR must be above its median value
Trend Filter: Long-term 200-period EMA
📊 Technical Settings
Moving Average
Type: SMA
Length: 40
Source: hl2
Oscillator
Length: 15
Threshold: 0.5
Risk Management
Take Profit: 1.5%
Stop Loss: 1.0%
Trailing Stop: 1.0%
👁️ Visual Support
MA and oscillator color changes indicate directional bias
Clear chart markers show entry and exit points
Trailing stops and risk controls are transparently managed
🚀 Strategy Improvements & Uniqueness
In-wave flag avoids repeated entries within the same trend phase
Filtering based on time, volatility, and trend ensures higher-quality trades
Dynamic high/low tracking allows precise trailing stop placement
Fully rule-based execution reduces emotional decision-making
💡 Inspirations & Attribution
This strategy is inspired by the excellent concept from:
ChartPrime – “Moving Average Shift”
It expands on the original idea with advanced trade filters and trailing logic.
Source reference:
📌 Summary
The Moving Average Shift WaveTrend Strategy offers a rule-based, reliable approach to trend trading. By combining trend and momentum filters with robust risk controls, it provides a consistent framework suitable for various market conditions and trading styles.
⚠️ Disclaimer
This script is for educational purposes only. Trading involves risk. Always use proper backtesting and risk evaluation before applying in live markets.

RTH and ETH RangesKey Functions :
Visualizes Regular Trading Hours (RTH) and Extended Trading Hours (ETH) price ranges
Tracks session highs, lows, and 50% levels where significant market reactions occur
Detects breakouts beyond previous session extremes
Trading Applications :
Exposes potential liquidity raids at session boundaries where smart money targets stop orders
Identifies critical price thresholds where institutional activity concentrates
Highlights divergences between RTH and ETH behavior that precede directional moves
Provides measurement of session volatility differences
Maps key price levels for objective entry and exit parameters
Reveals market dynamics at session transitions where institutional positioning changes

Machine Learning RSI ║ BullVisionOverview:
Introducing the Machine Learning RSI with KNN Adaptation – a cutting-edge momentum indicator that blends the classic Relative Strength Index (RSI) with machine learning principles. By leveraging K-Nearest Neighbors (KNN), this indicator aims at identifying historical patterns that resemble current market behavior and uses this context to refine RSI readings with enhanced sensitivity and responsiveness.
Unlike traditional RSI models, which treat every market environment the same, this version adapts in real-time based on how similar past conditions evolved, offering an analytical edge without relying on predictive assumptions.
Key Features:
🔁 KNN-Based RSI Refinement
This indicator uses a machine learning algorithm (K-Nearest Neighbors) to compare current RSI and price action characteristics to similar historical conditions. The resulting RSI is weighted accordingly, producing a dynamically adjusted value that reflects historical context.
📈 Multi-Feature Similarity Analysis
Pattern similarity is calculated using up to five customizable features:
RSI level
RSI momentum
Volatility
Linear regression slope
Price momentum
Users can adjust how many features are used to tailor the behavior of the KNN logic.
🧠 Machine Learning Weight Control
The influence of the machine learning model on the final RSI output can be fine-tuned using a simple slider. This lets you blend traditional RSI and machine learning-enhanced RSI to suit your preferred level of adaptation.
🎛️ Adaptive Filtering
Additional smoothing options (Kalman Filter, ALMA, Double EMA) can be applied to the RSI, offering better visual clarity and helping to reduce noise in high-frequency environments.
🎨 Visual & Accessibility Settings
Custom color palettes, including support for color vision deficiencies, ensure that trend coloring remains readable for all users. A built-in neon mode adds high-contrast visuals to improve RSI visibility across dark or light themes.
How It Works:
Similarity Matching with KNN:
At each candle, the current RSI and optional market characteristics are compared to historical bars using a KNN search. The algorithm selects the closest matches and averages their RSI values, weighted by similarity. The more similar the pattern, the greater its influence.
Feature-Based Weighting:
Similarity is determined using normalized values of the selected features, which gives a more refined result than RSI alone. You can choose to use only 1 (RSI) or up to all 5 features for deeper analysis.
Filtering & Blending:
After the machine learning-enhanced RSI is calculated, it can be optionally smoothed using advanced filters to suppress short-term noise or sharp spikes. This makes it easier to evaluate RSI signals in different volatility regimes.
Parameters Explained:
📊 RSI Settings:
Set the base RSI length and select your preferred smoothing method from 10+ moving average types (e.g., EMA, ALMA, TEMA).
🧠 Machine Learning Controls:
Enable or disable the KNN engine
Select how many nearest neighbors to compare (K)
Choose the number of features used in similarity detection
Control how much the machine learning engine affects the RSI calculation
🔍 Filtering Options:
Enable one of several advanced smoothing techniques (Kalman Filter, ALMA, Double EMA) to adjust the indicator’s reactivity and stability.
📏 Threshold Levels:
Define static overbought/oversold boundaries or reference dynamically adjusted thresholds based on historical context identified by the KNN algorithm.
🎨 Visual Enhancements:
Select between trend-following or impulse coloring styles. Customize color palettes to accommodate different types of color blindness. Enable neon-style effects for visual clarity.
Use Cases:
Swing & Trend Traders
Can use the indicator to explore how current RSI readings compare to similar market phases, helping to assess trend strength or potential turning points.
Intraday Traders
Benefit from adjustable filters and fast-reacting smoothing to reduce noise in shorter timeframes while retaining contextual relevance.
Discretionary Analysts
Use the adaptive OB/OS thresholds and visual cues to supplement broader confluence zones or market structure analysis.
Customization Tips:
Higher Volatility Periods: Use more neighbors and enable filtering to reduce noise.
Lower Volatility Markets: Use fewer features and disable filtering for quicker RSI adaptation.
Deeper Contextual Analysis: Increase KNN lookback and raise the feature count to refine pattern recognition.
Accessibility Needs: Switch to Deuteranopia or Monochrome mode for clearer visuals in specific color vision conditions.
Final Thoughts:
The Machine Learning RSI combines familiar momentum logic with statistical context derived from historical similarity analysis. It does not attempt to predict price action but rather contextualizes RSI behavior with added nuance. This makes it a valuable tool for those looking to elevate traditional RSI workflows with adaptive, research-driven enhancements.

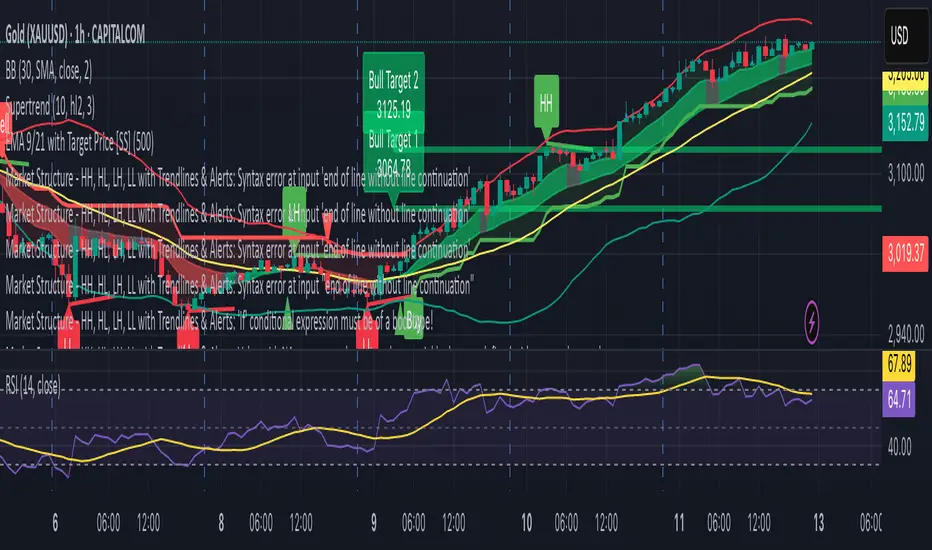
Market Structure - HH, HL, LH, LL with Trendlines & AlertsMarket Structure Script – HH, HL, LH, LL with Trendlines & Alerts
This Pine Script is designed to help identify key market structure patterns such as Higher Highs (HH), Higher Lows (HL), Lower Highs (LH), and Lower Lows (LL) on price charts. It also draws trendlines connecting the respective swing points and provides alerts when these important price patterns occur.
Key Features:
Swing High and Low Detection:
The script uses the ta.pivothigh and ta.pivotlow functions to identify significant swing highs and swing lows based on the pivot length (pivotLen). These points mark local peaks and troughs in the price action.
Dynamic Pivot Length:
The script adjusts the pivotLen (which defines the number of bars used to calculate swing points) based on the current timeframe of the chart. For example, for a 15-minute chart, it uses a pivot length of 5 bars, while for a daily chart, it uses 10 bars. This dynamic adjustment ensures that the script works across different timeframes.
Higher Highs (HH), Higher Lows (HL), Lower Highs (LH), Lower Lows (LL):
Higher High (HH): Identifies a price peak that is higher than the previous swing high, indicating an uptrend.
Higher Low (HL): Identifies a price trough that is higher than the previous swing low, supporting the idea of an ongoing uptrend.
Lower High (LH): Identifies a price peak that is lower than the previous swing high, suggesting a potential reversal or downtrend.
Lower Low (LL): Identifies a price trough that is lower than the previous swing low, indicating a downtrend.
Trendlines:
For each identified Higher High, Higher Low, Lower High, or Lower Low, the script automatically draws a trendline connecting the corresponding swing points. These trendlines provide a visual representation of the market’s price structure, showing support and resistance levels.
Labels:
The script places labels on the chart next to the respective swing points. These labels mark whether the point is a Higher High (HH), Higher Low (HL), Lower High (LH), or Lower Low (LL). This helps traders easily visualize the price pattern at a glance.
Alerts:
Alert conditions are set for when a Higher High (HH), Higher Low (HL), Lower High (LH), or Lower Low (LL) is detected. Users can set up alerts to be notified whenever one of these key market structure patterns forms. Alerts are an essential feature for traders who want to act quickly when important trend changes are happening.
Dskyz (DAFE) MAtrix with ATR-Powered Precision Dskyz (DAFE) MAtrix with ATR-Powered Precision
This cutting‐edge futures trading strategy built to thrive in rapidly changing market conditions. Developed for high-frequency futures trading on instruments such as the CME Mini MNQ, this strategy leverages a matrix of sophisticated moving averages combined with ATR-based filters to pinpoint high-probability entries and exits. Its unique combination of adaptable technical indicators and multi-timeframe trend filtering sets it apart from standard strategies, providing enhanced precision and dynamic responsiveness.
imgur.com
Core Functional Components
1. Advanced Moving Averages
A distinguishing feature of the DAFE strategy is its robust, multi-choice moving averages (MAs). Clients can choose from a wide array of MAs—each with specific strengths—in order to fine-tune their trading signals. The code includes user-defined functions for the following MAs:
imgur.com
Hull Moving Average (HMA):
The hma(src, len) function calculates the HMA by using weighted moving averages (WMAs) to reduce lag considerably while smoothing price data. This function computes an intermediate WMA of half the specified length, then a full-length WMA, and finally applies a further WMA over the square root of the length. This design allows for rapid adaptation to price changes without the typical delays of traditional moving averages.
Triple Exponential Moving Average (TEMA):
Implemented via tema(src, len), TEMA uses three consecutive exponential moving averages (EMAs) to effectively cancel out lag and capture price momentum. The final formula—3 * (ema1 - ema2) + ema3—produces a highly responsive indicator that filters out short-term noise.
Double Exponential Moving Average (DEMA):
Through the dema(src, len) function, DEMA calculates an EMA and then a second EMA on top of it. Its simplified formula of 2 * ema1 - ema2 provides a smoother curve than a single EMA while maintaining enhanced responsiveness.
Volume Weighted Moving Average (VWMA):
With vwma(src, len), this MA accounts for trading volume by weighting the price, thereby offering a more contextual picture of market activity. This is crucial when volume spikes indicate significant moves.
Zero Lag EMA (ZLEMA):
The zlema(src, len) function applies a correction to reduce the inherent lag found in EMAs. By subtracting a calculated lag (based on half the moving average window), ZLEMA is exceptionally attuned to recent price movements.
Arnaud Legoux Moving Average (ALMA):
The alma(src, len, offset, sigma) function introduces ALMA—a type of moving average designed to be less affected by outliers. With parameters for offset and sigma, it allows customization of the degree to which the MA reacts to market noise.
Kaufman Adaptive Moving Average (KAMA):
The custom kama(src, len) function is noteworthy for its adaptive nature. It computes an efficiency ratio by comparing price change against volatility, then dynamically adjusts its smoothing constant. This results in an MA that quickly responds during trending periods while remaining smoothed during consolidation.
Each of these functions—integrated into the strategy—is selectable by the trader (via the fastMAType and slowMAType inputs). This flexibility permits the tailored application of the MA most suited to current market dynamics and individual risk management preferences.
2. ATR-Based Filters and Risk Controls
ATR Calculation and Volatility Filter:
The strategy computes the Average True Range (ATR) over a user-defined period (atrPeriod). ATR is then used to derive both:
Volatility Assessment: Expressed as a ratio of ATR to closing price, ensuring that trades are taken only when volatility remains within a safe, predefined threshold (volatilityThreshold).
ATR-Based Entry Filters: Implemented as atrFilterLong and atrFilterShort, these conditions ensure that for long entries the price is sufficiently above the slow MA and vice versa for shorts. This acts as an additional confirmation filter.
Dynamic Exit Management:
The exit logic employs a dual approach:
Fixed Stop and Profit Target: Stops and targets are set at multiples of ATR (fixedStopMultiplier and profitTargetATRMult), helping manage risk in volatile markets.
Trailing Stop Adjustments: A trailing stop is calculated using the ATR multiplied by a user-defined offset (trailOffset), which captures additional profits as the trade moves favorably while protecting against reversals.
3. Multi-Timeframe Trend Filtering
The strategy enhances its signal reliability by leveraging a secondary, higher timeframe analysis:
15-Minute Trend Analysis:
By retrieving 15-minute moving averages (fastMA15m and slowMA15m) via request.security, the strategy determines the broader market trend. This secondary filter (enabled or disabled through useTrendFilter) ensures that entries are aligned with the prevailing market direction, thereby reducing the incidence of false signals.
4. Signal and Execution Logic
Combined MA Alignment:
The entry conditions are based primarily on the alignment of the fast and slow MAs. A long condition is triggered when the current price is above both MAs and the fast MA is above the slow MA—complemented by the ATR filter and volume conditions. The reverse applies for a short condition.
Volume and Time Window Validation:
Trades are permitted only if the current volume exceeds a minimum (minVolume) and the current hour falls within the predefined trading window (tradingStartHour to tradingEndHour). An additional volume spike check (comparing current volume to a moving average of past volumes) further filters for optimal market conditions.
Comprehensive Order Execution:
The strategy utilizes flexible order execution functions that allow pyramiding (up to 10 positions), ensuring that it can scale into positions as favorable conditions persist. The use of both market entries and automated exits (with profit targets, stop-losses, and trailing stops) ensures that risk is managed at every step.
5. Integrated Dashboard and Metrics
For transparency and real-time analysis, the strategy includes:
On-Chart Visualizations:
Both fast and slow MAs are plotted on the chart, making it easy to see the market’s technical foundation.
Dynamic Metrics Dashboard:
A built-in table displays crucial performance statistics—including current profit/loss, equity, ATR (both raw and as a percentage), and the percentage gap between the moving averages. These metrics offer immediate insight into the health and performance of the strategy.
Input Parameters: Detailed Breakdown
Every input is meticulously designed to offer granular control:
Fast & Slow Lengths:
Determine the window size for the fast and slow moving averages. Smaller values yield more sensitivity, while larger values provide a smoother, delayed response.
Fast/Slow MA Types:
Choose the type of moving average for fast and slow signals. The versatility—from basic SMA and EMA to more complex ones like HMA, TEMA, ZLEMA, ALMA, and KAMA—allows customization to fit different market scenarios.
ATR Parameters:
atrPeriod and atrMultiplier shape the volatility assessment, directly affecting entry filters and risk management through stop-loss and profit target levels.
Trend and Volume Filters:
Inputs such as useTrendFilter, minVolume, and the volume spike condition help confirm that a trade occurs in active, trending markets rather than during periods of low liquidity or market noise.
Trading Hours:
Restricting trade execution to specific hours (tradingStartHour and tradingEndHour) helps avoid illiquid or choppy markets outside of prime trading sessions.
Exit Strategies:
Parameters like trailOffset, profitTargetATRMult, and fixedStopMultiplier provide multiple layers of risk management and profit protection by tailoring how exits are generated relative to current market conditions.
Pyramiding and Fixed Trade Quantity:
The strategy supports multiple entries within a trend (up to 10 positions) and sets a predefined trade quantity (fixedQuantity) to maintain consistent exposure and risk per trade.
Dashboard Controls:
The resetDashboard input allows for on-the-fly resetting of performance metrics, keeping the strategy’s performance dashboard accurate and up-to-date.
Why This Strategy is Truly Exceptional
Multi-Faceted Adaptability:
The ability to switch seamlessly between various moving average types—each suited to particular market conditions—enables the strategy to adapt dynamically. This is a testament to the high level of coding sophistication and market insight infused within the system.
Robust Risk Management:
The integration of ATR-based stops, profit targets, and trailing stops ensures that every trade is executed with well-defined risk parameters. The system is designed to mitigate unexpected market swings while optimizing profit capture.
Comprehensive Market Filtering:
By combining moving average crossovers with volume analysis, volatility thresholds, and multi-timeframe trend filters, the strategy only enters trades under the most favorable conditions. This multi-layered filtering reduces noise and enhances signal quality.
-Final Thoughts-
The Dskyz Adaptive Futures Elite (DAFE) MAtrix with ATR-Powered Precision strategy is not just another trading algorithm—it is a multi-dimensional, fully customizable system built on advanced technical principles and sophisticated risk management techniques. Every function and input parameter has been carefully engineered to provide traders with a system that is both powerful and transparent.
For clients seeking a state-of-the-art trading solution that adapts dynamically to market conditions while maintaining strict discipline in risk management, this strategy truly stands in a class of its own.
****Please show support if you enjoyed this strategy. I'll have more coming out in the near future!!
-Dskyz
Caution
DAFE is experimental, not a profit guarantee. Futures trading risks significant losses due to leverage. Backtest, simulate, and monitor actively before live use. All trading decisions are your responsibility.

PBOC Balance Sheet (Approx USD Trillions)This indicator displays the People's Bank of China (PBOC) Balance Sheet in approximate USD trillions, converted from CNY data (ECONOMICS:CNCBBS) using a fixed exchange rate of 1 USD ≈ 7 CNY. The data is smoothed with a 3-month SMA and plotted as a black line in a separate pane, with a reference line at 6.0 USD trillions. Ideal for analyzing long-term macroeconomic trends and correlations with other financial metrics like bond yields or asset prices, it includes error handling for missing data to ensure reliable visualization.
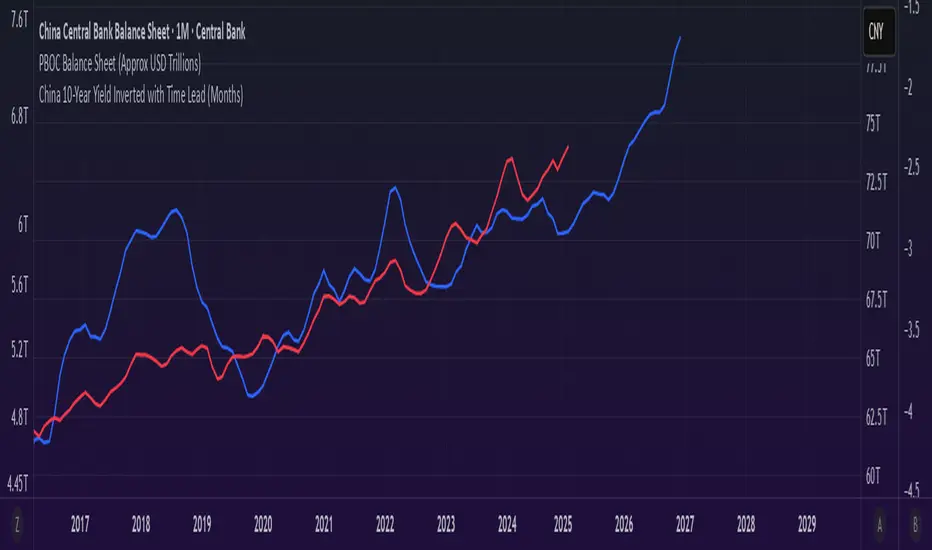
China 10-Year Yield Inverted with Time Lead (Months)The "China 10-Year Yield Inverted with Time Lead (Months)" indicator is a Pine Script tool for TradingView that displays the inverted China 10-Year Government Bond Yield (sourced from TVC:CN10Y) with a user-defined time lead or lag in months. The yield is inverted by multiplying it by -1, making a rising yield appear as a downward movement and vice versa, which helps visualize inverse correlations with other assets. Users can input the number of months to shift the yield forward (lead) or backward (lag), with the shift calculated based on the chart’s timeframe (e.g., 20 bars per month on daily charts). The indicator plots the shifted, inverted yield as a blue line in a separate pane, with a zero line for reference, enabling traders to analyze leading or lagging relationships with other financial data, such as the PBOC Balance Sheet or Bitcoin price.

ICT MACRO MAX RETRI ( ALERT )🖤 ICT Reversal Detector – Minimalist Edition
This indicator is designed for traders who follow Inner Circle Trader (ICT) concepts, particularly focused on liquidity sweeps and displacement reversals.
It detects:
• Swing Highs & Lows that occur during the most reactive windows of each hour
→ Specifically the last 20 minutes and first 15 minutes
(ICT teaches these moments often reveal macro-level reversals. I’ve expanded the window slightly to give the indicator more room to catch valid setups.)
• Liquidity Sweeps of previous highs/lows
• Displacement (State Change): defined as a manipulation wick followed by 1–3 strong candles closing in the opposite direction
Visually:
• Clean black lines pointing right from the liquidity sweep wick
• White triangle markers inside black label boxes only when valid displacement occurs
• No clutter, no unnecessary shapes — just focused signal
Built for:
• 5-minute charts, especially NASDAQ (NAS100) and S&P 500 (SPX500)
• Confirm setups manually on the 15-minute chart for extra precision
This is a partial automation tool for ICT-style reversal traders who prefer clarity, minimalism, and sharp intuition over noise.
Let it alert you to setups — then decide like a sniper.
