Seekho roj kamaoVery accurate buy and sell entries.This custom trading indicator delivers powerful market insights by combining price action, volume trends, and momentum shifts. Designed for precision, it identifies high-probability entry and exit points, minimizing noise and maximizing clarity. Whether you're day trading or swing trading, it enhances decision-making and adapts seamlessly to various market conditions
Trend Analysis

[blackcat] L3 Twin Range Filter ProOVERVIEW
The L3 Twin Range Filter Pro indicator enhances trading strategies by filtering out market noise through a sophisticated dual-range approach. Unlike previous versions, this script not only provides clear visual indications of buy/sell signals but also incorporates a dynamic trend range filter line. By averaging two smoothed exponential moving averages—one fast and one slow—the indicator generates upper and lower range boundaries that adapt to changing market conditions. Traders can easily spot buy/sell opportunities when the closing price crosses these boundaries, supported by configurable alerts for real-time notifications.
FEATURES
Dual-Range Calculation: Combines fast and slow moving averages to create adaptive range boundaries.
Customizable Parameters:
Periods: Adjustable lengths for fast (default 9 bars) and slow (default 34 bars) moving averages.
Multipliers: Coefficients to modify the distance of the trailing lines from the price.
Dynamic Trend Range Filter Line: Visually displays buy/sell signals directly on the chart.
Trailing Stop Loss Logic: Automatically follows price movements to act as a trailing stop loss indicator.
Trade Signals: Clearly indicates buy/sell points with labeled signals.
Alerts: Configurable notifications for buy/sell signals to keep traders informed.
Visual Enhancements: Colored fills and dynamic boundary lines for easy interpretation.
HOW TO USE
Add the L3 Twin Range Filter Pro indicator to your TradingView chart.
Customize the input parameters:
Price Source: Choose the desired price source (e.g., Close).
Show Trade Signals: Toggle on/off for displaying buy/sell labels.
Fast Period: Set the period for the fast moving average (default 9 bars).
Slow Period: Set the period for the slow moving average (default 34 bars).
Fast Range Multiplier: Adjust the multiplier for the fast moving average.
Slow Range Multiplier: Adjust the multiplier for the slow moving average.
Monitor the plotted trend range filter and dynamic boundaries on the chart.
Identify buy/sell signals based on the crossing of price and range boundaries.
Configure alerts for real-time notifications when signals are triggered.
TRADE LOGIC
BUY Signal: Triggered when the price is higher than or equal to the upper range level. The indicator line will trail just below the price, acting as a trailing stop loss.
SELL Signal: Triggered when the price is lower than or equal to the lower range level. The indicator line will trail just above the price, serving as a trailing stop loss.
LIMITATIONS
The performance of this indicator relies on the selected periods and multipliers.
Market volatility can impact the accuracy of the signals.
Always complement this indicator with other analytical tools for robust decision-making.
NOTES
Experiment with different parameter settings to optimize the indicator for various market conditions.
Thoroughly backtest the indicator using historical data to ensure its compatibility with your trading strategy.
THANKS
A big thank you to Colin McKee for his foundational work on the Twin Range Filter! Your contributions have paved the way for enhanced trading tools. 🙏📈🔍

Heikin Ashi Colored Regular OHLC CandlesHeikin Ashi Colored Regular OHLC Candles
In the world of trading, Heikin Ashi candles are a popular tool for smoothing out price action and identifying trends more clearly. However, Heikin Ashi candles do not reflect the actual open, high, low, and close prices of a market. They are calculated values that change the chart’s structure. This can make it harder to see precise price levels or use standard price-based tools effectively.
To get the best of both worlds, we can apply the color logic of Heikin Ashi candles to regular OHLC candles. This means we keep the true market data, but show the trend visually in the same smooth way Heikin Ashi candles do.
Why use this approach
Heikin Ashi color logic filters out noise and helps provide a clearer view of the current trend direction. Since we are still plotting real OHLC candles, we do not lose important price information such as actual highs, lows, or closing prices. This method offers a hybrid view that combines the accuracy of real price levels with the visual benefits of Heikin Ashi trend coloring. It also helps maintain visual consistency for traders who are used to Heikin Ashi signals but want to see real price action.
Advantages for scalping
Scalping requires fast decisions. Even small price noise can lead to hesitation or bad entries. Coloring regular candles based on Heikin Ashi direction helps reduce that noise and makes short-term trends easier to read. It allows for faster confirmation of momentum without switching away from real prices. Since the candles are not modified, scalpers can still place tight stop-losses and targets based on actual price structure. This approach also avoids clutter, keeping the chart clean and focused.
How it works
We calculate the Heikin Ashi values in the background. If the Heikin Ashi close is higher than the Heikin Ashi open, the trend is considered bullish and the candle is colored green. If the close is lower than the open, it is bearish and the candle is red. If they are equal, the candle is gray or neutral. We then use these colors to paint the real OHLC candles, which are unchanged in shape or position.
RSI Crosses SMA Buy/Sell Strategy-R-AlgoAIDisclaimer:
// This script is for educational and informational purposes only.
// It does not constitute financial or investment advice.
// Trading involves substantial risk and may not be suitable for all investors.
// Always do your own research or consult with a licensed financial advisor
// before making any trading or investment decisions.
// The author is not responsible for any losses incurred using this script
Key Changes:
Buy at High of the Signal Candle:
The strategy.entry("Buy", strategy.long, limit=high, comment="Buy at High of Signal Candle") line places a buy order at the high of the candle that triggered the signal (i.e., the candle where the RSI crosses above the SMA).
How it works:
When the RSI crosses above the SMA and the buy condition is true, the strategy will place a buy order at the high of that candle.
Exit:
The strategy will exit the position if the RSI crosses below the SMA as usual using strategy.close("Buy").
Example:
If the RSI crosses above the SMA at a specific candle, the strategy will enter a buy order at the high of that candle.
When the RSI crosses below the SMA, it will close the long position.
This should now execute a buy order at the high of the signal candle when the RSI crosses above the SMA, as requested.

Fair Value Gap Retest DetectorFair Value Gaps (FVGs) represent price inefficiencies where buying and selling volumes are imbalanced, creating gaps between the wicks of consecutive candles. These gaps often act as magnets for price, as markets tend to "fill" these gaps before resuming their trend.
FVGs can signal potential entry or exit points, making them a valuable tool for traders looking to exploit these price inefficiencies.

Burr ORB RSIRSI To monitor overbought or oversold conditions. Prevents staying in a trade when price is likely to reverse.

Burr ORB MomentumShows momentum in seperate pane. Useful when trading ORB breakout to determine strength of trend and probability of continuation or reversal.

Burr Orb VolumeVolume Histogram used to confirm strong Breakouts of the ORB. Highlights Volume Spikes for added confirmation.

Burr ORBMarks the ORB on desired timeframe. Also marks the previous days High and Low for reference during Session

Kijun-Sen Filter for ScalpingThis is designed to assist lower time framed trading strategies with general trend sentiment. The baseline indicator used in this script is the trust Kijun-Sen. The baseline is best to be used on the daily timeframe however you can select whichever you prefer the same applies to the period as well.
You will see a table in the top right of the screen letting you know the trend direction.
Bullish
Bearish

Vortex SMA StrategyThere are two components to this script:
- Vortex Indicator (This will signal the long and short entries)
- SMA (This acts as a filter when price is above the SMA it only signals longs, when the price is below the SMA it only signals shorts)
Examples of longs and shorts
It's best to use a volume indicator paired with this to further filter losing trades.
If you have any ideas send me a message please!

Marubozu + Clean Wick Edge (Toggleable)📊 Marubozu + Wickless Edge Highlighter (w/ Toggles & Alerts)
This indicator identifies and visually highlights strong momentum candles using a combination of classic candlestick logic and precision wick analysis:
🔹 Features:
✅ Bullish Marubozu (green): Candles that open near their low and close near their high, indicating strong buying pressure
✅ Bearish Marubozu (red): Candles that open near their high and close near their low, signaling aggressive selling
🟪 Wickless Edge Candles (purple): Any candle with a flat top or bottom (no wick on at least one end), often representing clean institutional activity or high conviction
🛠️ Fully Customizable:
Toggle each candle type on/off (Bullish, Bearish, Wickless)
Adjust detection tolerances for wick length precision
Color-coded bars for easy visual scanning
🔔 Built-In Alerts:
Receive alerts the moment a Bullish or Bearish Marubozu prints
📈 Ideal For:
Momentum traders
Breakout or breakdown entries
Spotting institutional-style candles with clean conviction

FVG Alerts (Vortus)Fair Value Gaps (FVGs) represent price inefficiencies where buying and selling volumes are imbalanced, creating gaps between the wicks of consecutive candles. These gaps often act as magnets for price, as markets tend to "fill" these gaps before resuming their trend.
FVGs can signal potential entry or exit points, making them a valuable tool for traders looking to exploit these price inefficiencies.

Volume Peak Bars 3.0Indicator highlights the range starting at the highest volume bar. Customizable to your desired time frame. High volume bars tend to give good levels of liquidity ie. Support/Resistance. This indicator follows the same idea as Opening Range Breakout theories - Break Outs of this area with retests or entries into this range tend to give good trade ideas.

ConeCastConeCast is a forward-looking projection indicator that visualizes a future price range (or "cone") based on recent trend momentum and adaptive volatility. Unlike lagging bands or reactive channels, this tool plots a predictive zone 3–50 bars ahead, allowing traders to anticipate potential price behavior rather than merely react to it.
How It Works
The core of ConeCast is a dynamic trend-slope engine derived from a Linear Regression line fitted over a user-defined lookback window. The slope of this trend is projected forward, and the cone’s width adapts based on real-time market volatility. In calm markets, the cone is narrow and focused. In volatile regimes, it expands proportionally, using an ATR-based % of price to scale.
Key Features
📈 Predictive Cone Zone: Visualizes a forward range using trend slope × volatility width.
🔄 Auto-Adaptive Volatility Scaling: Expands or contracts based on market quiet/chaotic states.
📊 Regime Detection: Identifies Bull, Bear, or Neutral states using a tunable slope threshold.
🧭 Multi-Timeframe Compatible: Slope and volatility can be calculated from higher timeframes.
🔔 Smart Alerts: Detects price entering the cone, and signals trend regime changes in real time.
🖼️ Clean Visual Output: Optionally includes outer cones, trend-trail marker, and dashboard label.
How to Use It
Use on 15m–4H charts for best forward visibility.
Look for price entering the cone as a potential trend continuation setup.
Monitor regime changes and volatility expansion to filter choppy market zones.
Tune the slope sensitivity and ATR multiplier to match your symbol's behavior.
Use outer cones to anticipate aggressive swings and wick traps.
What Makes It Unique
ConeCast doesn’t follow price — it predicts a possible future price envelope using trend + volatility math, without relying on lagging indicators or repainting logic. It's a hybrid of regression-based forecasting and dynamic risk zoning, designed for swing traders, scalpers, and algo developers alike.
Limitations
ConeCast projects based on current trend and volatility — it does not "know" future price. Like all projection tools, accuracy depends on trend persistence and market conditions. Use this in combination with confirmation signals and risk management.

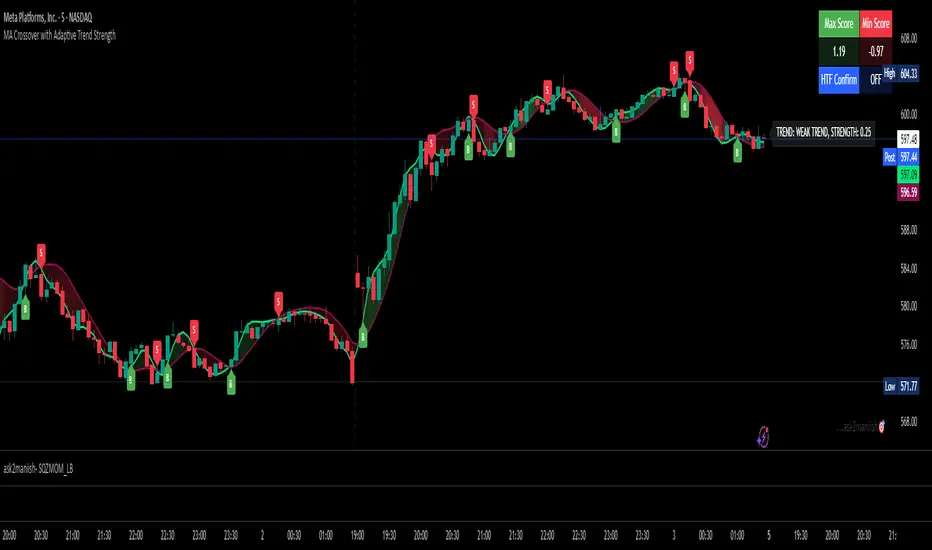
MA Crossover with Adaptive Trend Strength📘 MA Crossover with Adaptive Trend Strength —
📌 Overview
This TradingView indicator plots two moving averages (Fast & Slow) with user-selected types (T3, EMA, SMA, HMA), visual crossovers, and dynamically calculates an adaptive trend strength score using Z-scores of multiple features. Optional higher timeframe (HTF) confirmation is supported. A color-filled region between the MAs visually indicates momentum direction.
⚙️ Inputs & Controls
📈 Moving Average Settings
Fast MA Length: Length of the fast-moving average (default: 9).
Slow MA Length: Length of the slow-moving average (default: 21).
MA Type: Type of moving average used (T3, EMA, SMA, HMA).
Source: Input data source (default: close).
T3 Volume Factor: Only used when T3 is selected, controls smoothing (range: 0–1).
🎨 Visual Controls
Bullish Fill Color: Fill color when Fast MA is above Slow MA.
Bearish Fill Color: Fill color when Fast MA is below Slow MA.
Show Gradient Fill: Enable or disable the colored area between Fast & Slow MAs.
Trend Label Position: Choose where the trend strength label appears (top or bottom).
Label Update Interval: Number of bars between label updates (reduces clutter).
⏱ Multi-Timeframe Support
Higher Timeframe: Timeframe used for confirmation (default: 60 min).
Use HTF Confirmation: Enables filtering of trend score by higher timeframe trend direction.
📊 Lookback Configuration
Auto Lookback Based on Timeframe: Dynamically adapts scoring lookback period per chart timeframe.
Manual Lookback: Manual fallback lookback length when auto is off.
🧮 MA Calculation Options
T3 MA: Custom T3 function with exponential moving averages and volume factor.
EMA/SMA: Built-in Pine functions (ta.ema, ta.sma).
HMA: Hull Moving Average using WMA calculations.
📉 Trend Strength Calculation
🧠 Z-Score Inputs
Distance between MAs (zDist)
Slope of the Fast MA (zSlope)
Volume (zVol)
ATR (zATR)
📏 Choppiness & Adaptive Weighting
A Choppiness Index (based on ATR & price range) reduces score impact in sideways markets.
Dynamically adjusts Z-score weights:
W1: Distance
W2: Slope
W3: Volume
W4: ATR
🔁 HTF Confirmation
Optionally multiplies the trend score by the direction of the higher timeframe trend to filter noise.
🟩 Plot & Visual Elements
📊 MA Lines
Plots Fast and Slow MA lines in colors based on selected MA type.
🌈 Gradient Fill
Fills the area between Fast and Slow MAs with opacity proportional to their difference.
Colors based on bullish/bearish condition.
🏷️ Trend Strength Label
Updates every n bars (Label Update Interval).
Shows:
Trend Classification: Weak, Moderate, Strong
Numerical Score
Label position (top or bottom) is configurable.
🔔 Crossover Signals
Bullish Crossover ("B"): Fast MA crosses above Slow MA.
Bearish Crossover ("S"): Fast MA crosses below Slow MA.
Labels are plotted at crossover points.
Old labels are removed after a threshold (100) to reduce chart clutter.
📋 Score Summary Table
A table showing:
Max Score within the lookback period
Min Score
HTF Confirmation Status (ON / OFF)
Updates on the same user-defined interval as the trend label.
🚨 Alerts
Condition Description
Bullish MA Cross Fast MA crosses above Slow MA
Bearish MA Cross Fast MA crosses below Slow MA
These are provided via alertcondition() for use in alert creation.
📌 Customization Tips
Turn off the gradient fill for a cleaner chart.
Use HTF confirmation to reduce false positives in ranging markets.
Adjust label update frequency to prevent visual clutter on faster timeframes.
Use T3 MA with volume factor for smoother signals in volatile markets.
MA Trendline with Angle LockThis indicator is just white line in screenshot (and will show the MA it is using).... This grabs the slope of the MA and makes a trendline out of it until the angle changes by x percentage then it recalculates. Mimics what a 2x sma envelope does to a smaller sma envelope... carves out the impulses just with straight rather than curved edges if that makes sense. Envelopes are shown as an example.

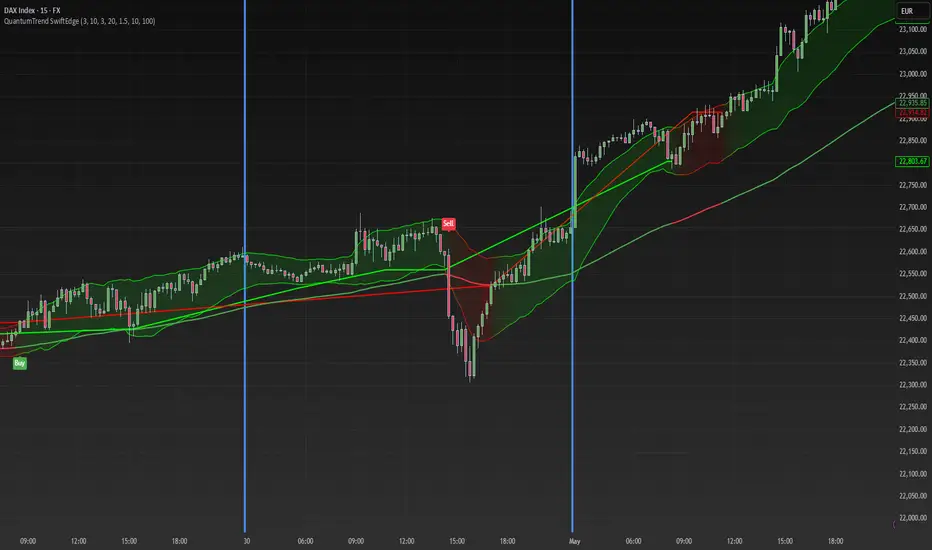
QuantumTrend SwiftEdgeQuantumTrend SwiftEdge - A Trend-Following Indicator for TradingView
Overview:
QuantumTrend SwiftEdge is a visually engaging and customizable trend-following indicator that combines the power of Supertrend, Keltner Channels, and a 100-period EMA to generate precise buy and sell signals. Designed to help traders identify trends and breakouts, this indicator offers a unique blend of technical tools with a modern gradient color effect, making it both functional and visually appealing.
What It Does:
This indicator identifies trend directions and potential entry/exit points:
- Supertrend determines the overall trend direction, showing a green line below the price during uptrends and a red line above the price during downtrends. The line only appears when the price is close to it, indicating an active trend.
- Keltner Channels highlight volatility and breakouts, with the upper and lower bands dynamically adjusting to market conditions.
- A 100-period EMA provides a longer-term trend perspective, helping to filter out noise.
- Buy and sell signals are generated when specific conditions align across these indicators, ensuring robust trade setups.
How It Works:
The indicator uses three components to generate signals:
1. **Supertrend**: Calculates trend direction using the Average True Range (ATR) and a multiplier. It switches between uptrend (green) and downtrend (red) based on price movements relative to the Supertrend line.
2. **Keltner Channels**: Consists of an EMA (default 20 periods) with upper and lower bands based on ATR. A breakout above the upper band signals potential buying opportunities, while a breakout below the lower band signals potential selling opportunities.
3. **100-period EMA**: Acts as a trend filter, ensuring signals align with the broader market direction.
**Buy Signal**:
- Price is above the 100-period EMA (bullish market).
- Price breaks above the Keltner Channel upper band (indicating a breakout).
- Supertrend switches to an uptrend (trend changes from down to up).
**Sell Signal**:
- Price is below the 100-period EMA (bearish market).
- Price breaks below the Keltner Channel lower band (indicating a breakout).
- Supertrend switches to a downtrend (trend changes from up to down).
Visual Features:
- **Gradient Colors**: Supertrend lines and Keltner Channels use a smooth gradient color transition between green (uptrend) and red (downtrend), reflecting the trend's strength. The gradient is based on a smoothed trend value, creating a visually appealing effect.
- **Keltner Channel Fill**: The area between the upper and lower Keltner Channels is filled with a transparent gradient, enhancing the trend visualization.
- **Dynamic Supertrend Visibility**: Supertrend lines only appear when the price is close to the line (within an ATR-based threshold), indicating an active trend.
How to Use:
1. Add the "QuantumTrend SwiftEdge" indicator to your chart in TradingView.
2. Customize the settings:
- **Signal Sensitivity (1=Low, 5=High)**: Default is 3. Lower values (e.g., 1) make signals less frequent by using wider parameters, while higher values (e.g., 5) make signals more frequent by tightening parameters.
- **Use Manual Settings**: If enabled, you can manually adjust all parameters (ATR Period, ATR Multiplier, Keltner Channel Length, Keltner Channel Multiplier, Keltner ATR Length, EMA Length) to fine-tune the indicator.
- **Change ATR Calculation Method**: Toggle between standard ATR calculation and a simple moving average of true range.
- **Show Buy/Sell Signals**: Toggle to show or hide buy (green "Buy" label) and sell (red "Sell" label) signals.
- **Highlighter On/Off**: Toggle to show or hide the gradient fill between the price and Supertrend line when the line is visible.
3. Interpret the signals:
- A green "Buy" label below the price indicates a potential buying opportunity.
- A red "Sell" label above the price indicates a potential selling opportunity.
- Use the Keltner Channel gradient fill and Supertrend lines to confirm the trend direction and strength.
Why This Combination?
- **Supertrend** provides a robust trend-following mechanism, ensuring signals align with the market direction.
- **Keltner Channels** add a volatility component, identifying breakouts that often precede significant price movements.
- **100-period EMA** filters out noise, ensuring signals are generated in the context of the broader trend.
Together, these indicators create a balanced approach: Supertrend and EMA confirm the trend, while Keltner Channels pinpoint actionable entry and exit points. The gradient visuals and dynamic visibility make it easier to focus on active trends.
Originality:
QuantumTrend SwiftEdge stands out with its unique features:
- Gradient color transitions for a modern, dynamic look.
- A filled gradient between Keltner Channels, visually emphasizing the trend.
- Supertrend lines that only appear when the price is close, reducing clutter and focusing on active trends.
- Flexible settings with both sensitivity-based and manual adjustments for maximum customization.
Default Settings:
The default sensitivity is set to 3, providing a balanced approach for most markets and timeframes (e.g., 5-minute charts for crypto like BTC/USD). This setting uses moderate parameters (ATR Period=10, ATR Multiplier=3.0, Keltner Channel Length=20, Keltner Channel Multiplier=1.5, Keltner ATR Length=10, EMA Length=100). Users can adjust the sensitivity or switch to manual settings for more control.
Important Notes:
- This indicator is a tool to assist in identifying trends and potential entry/exit points. It does not guarantee profits and should be used in conjunction with other analysis and risk management practices.
- The signals are based on historical price data and do not predict future performance. Always test the indicator on a demo account before using it in live trading.
- The gradient effect is purely visual and does not affect the signal logic.
Candle Crossing 9 & 20 SMAdouble cross on both 9 and 20 sma, red arrow when crossing down, green arrow when crossing up

XAU Master Scalper [Modular]Built for XAUUSD (Gold) scalpers who demand precision and speed, this modular scalping indicator analyzes real-time price behavior using 12 powerful price-action and volume-based filters—with no moving averages, no repainting, and no lag.
What Makes This Indicator Elite:
🔹 12 Smart Filters Combined
From body strength to volatility bursts, micro breakouts to wick traps—each candle is scored live using institutional-grade logic.
🔹 Pure Price Action Based
No EMA, no SMA, no smoothing tricks. Just raw, real-time data intelligently interpreted for scalping.
🔹 Buy/Sell Decision Engine
Each candle gets a "score" from 0–12. If conditions align, it instantly triggers a BUY (green) or SELL (red) signal — visible on chart.
🔹 Custom Scoring Thresholds
Use inputs to fine-tune your edge: Minimum BUY score, Maximum SELL score, and visual toggle options.
🔹 Alerts Ready
Set TradingView alerts to get BUY/SELL push notifications in real time — no need to stare at the chart.
Best Used On:
XAUUSD (Gold) on Lower Timeframes (e.g. 30s, 2M, 5m)
Scalpers and aggressive intraday traders

SMC Structures and FVG📌 SMC Structures + FVG + Trend Viewer Pro
This advanced indicator helps traders visualize market structure with key tools:
✅ Break of Structure (BOS)
✅ Change of Character (CHoCH)
✅ Current Structure
✅ Fair Value Gaps (FVG)
✅ Automatic Fibonacci Levels
✅ Fixed Top-Right Trend Viewer (Bullish, Bearish, Sideways)
Designed for Smart Money Traders, this tool combines multiple key elements into one easy-to-use package. Perfect for day trading, swing trading, and spotting key zones.
⚡ Disclaimer:
This indicator is for educational purposes only. It is not financial advice. Please trade responsibly and use proper risk management.
📌 SMC Structures + FVG + Trend Viewer Pro
อินดิเคเตอร์ที่ออกแบบมาเพื่อช่วยให้นักเทรดมองเห็นโครงสร้างตลาดอย่างชัดเจนด้วยเครื่องมือสำคัญ:
✅ Break of Structure (BOS)
✅ Change of Character (CHoCH)
✅ โครงสร้างปัจจุบัน
✅ Fair Value Gaps (FVG)
✅ เส้น Fibonacci อัตโนมัติ
✅ ตัวบอกแนวโน้มค้างมุมขวาบน (Bullish, Bearish, Sideways)
เหมาะสำหรับสาย Smart Money, Day Trade, Swing Trade และผู้ที่เน้นหาจุดเข้าออกในโซนสำคัญ
⚡ คำเตือน:
อินดิเคเตอร์นี้ใช้เพื่อการศึกษาเท่านั้น ไม่ใช่คำแนะนำทางการเงิน โปรดบริหารจัดการความเสี่ยงอย่างเหมาะสม

Volume fightThe Volume fight indicator looks for the predominance of bullish or bearish trading volume on the chart by dividing the trading volume in the bar into 2 parts - "bullish volume" and "bearish volume", and comparing the weighted average values by volume with each other at a given distance.
This indicator is suitable for any instrument (cryptocurrency, Forex, stocks) and is able to work on any TF.
The Volume fight indicator should be used as an auxiliary indicator that tells you who is currently prevailing in the market - " bulls "or"bears".
To configure the indicator, it is necessary to set the range of evaluation of the predominance of bullish or bearish volume (the number of bars, by default-24 bars for TF=1H). The smaller the TF, the higher the range value should be used to filter out false signals.
When there is a predominance of "bulls" on the chart, a green triangle appears (relevant at the close of the bar) and the histogram is highlighted in green, when "bears" appear on the chart, a red triangle appears (relevant at the close of the bar) and the histogram is highlighted in red.
In the indicator settings, there is smoothing to reduce false signals and highlight the flat zone by specifying a percentage, at least which should be the difference between the forces of the "bullish" and "bearish" volume. If the difference between the volume forces is less than the specified one (by default-15%), the zone is considered flat and is displayed in gray on the histogram.
If you set the percentage to zero, the flat zones will not be highlighted, but there will be much more false signals, since the indicator becomes very sensitive when the smoothing percentage decreases.
There is a function-to show the color background of the current trading zone. For" bullish "- green, for" bearish " - red.
In the settings, you can enable the display and use of each signal in the trading zone, not only the initial one, but also each after the flat zone. By default, only the signal of the beginning of the ascending/descending zone is used.
The indicator has alerts for "bullish" and "bearish" movements. Use alerts - "Once per bar close".
If you have any questions, you can write to me in private messages or by using the contacts in my signature.
We are publishing this script anew, it is included in the review of the best 3 scripts for filtering false signals.
youtu.be
----------------------------------------------------
Индикатор Volume fight ищет на графике преобладание бычьего или медвежьего объёма торгов путём разделения торгового объёма в баре на 2 части - "бычий объём" и "медвежий объём", и сравнения средне-взвешенных значений по объёму между собой на заданной дистанции.
Данный индикатор подходит для любого инструмента (криптовалюта, Forex, акции) и способен работать на любом ТФ.
Индикатор Volume fight следует использовать как вспомогательный индикатор, который подсказывает Вам кто сейчас преобладает на рынке - "быки" или "медведи".
Для настройки индикатора необходимо выставить диапазон оценки преобладания бычьего или медвежьего объема (количество баров, по умолчанию - 24 бара для ТФ=1Ч). Чем меньше ТФ, тем выше следует использовать значение диапазона, чтобы отфильтровать ложные сигналы.
При возникновении преобладания на графике "быков" появляется зелёный треугольник (актуален по закрытию бара) и гистограмма подсвечивается зелёным цветом, при возникновении на графике "медведей" появляется красный треугольник (актуален по закрытию бара) и гистограмма подсвечивается красным цветом.
В настройках индикатора есть сглаживание для уменьшения ложных сигналов и выделения зоны флета с помощью указания процента, не менее которого, должна быть разница между силами "бычьего" и "медвежьего" объёма. Если разница между силами объёмов меньше заданного (по умолчанию - 15%), то зона считается флетовой и отображается на гистограмме серым цветом.
Если выставить процент равным нулю, то зоны флета выделяться не будут, но будет гораздо больше ложных сигналов, так как индикатор становится очень чувствительным при снижении процента сглаживания.
Есть функция - показывать цветовой фон текущей торговой зоны. Для "бычьего" - зелёный, для "медвежьего" - красный.
В настройках можно включить отображение и использование каждого сигнал в торговой зоне, не только начального, но и каждого после зоны флета. По умолчанию - только сигнал начала восходящей/нисходящей зоны.
Индикатор имеет оповещения для "бычьего" и "медвежьего" движения. Используйте оповещения - "на закрытии бара".
Этот скрипт мы публикуем заново, он вошел в обзор лучших 3-х скриптов для фильтрации ложных сигналов.
youtu.be

TrendScopeTrendScope is a custom-built, multi-factor trading tool designed to identify high-probability market entries and exits using a combination of trend structure, volume dynamics, and momentum behavior. Unlike traditional oscillators, it does not rely on bounded cyclical formulas but instead analyzes real-time price-volume relationships and trend integrity.
🔍 Key Features
EMA Confluence Analysis: Detects trend strength and alignment across EMAs from 5 to 800 periods.
Volume Spike Detection: Flags significant increases in trading volume following periods of stagnation—useful for breakout confirmation.
Order Flow Momentum: Measures buying vs. selling pressure based on volume-weighted price action, signaling directional conviction.
Reversal Alerts: Identifies divergences between price and momentum (e.g., volume-based net flow), warning of potential trend shifts.
Clean Visual Markers: BUY/SELL labels, directional volume spikes, and a trend strength table for clarity in execution.
⏱️ Best Used On
Timeframes: 4H, 8H, 12H, 1D (Daily)
Style: Swing trading, trend trading, and momentum-based entries
Markets: Crypto, Forex, Commodities, and Indices (works well on liquid assets with healthy volume)
This indicator is especially useful for traders who want directional confirmation during trending conditions and a visual edge for spotting volume-driven breakouts or early-stage reversals.
I made this for my own benefit since I didn't really find any non-paid options out there that work in a similar fashion and I wanted to keep it simple and was inspired by Delorean Trading Indicators.
Disclaimer: Just wanna throw this out there...please never use this as a standalone indicator and combine it with your own analysis to detect market behaviour and structure! Don't rely on any indicators to form your own pov of probable market moves. You have been warned.
