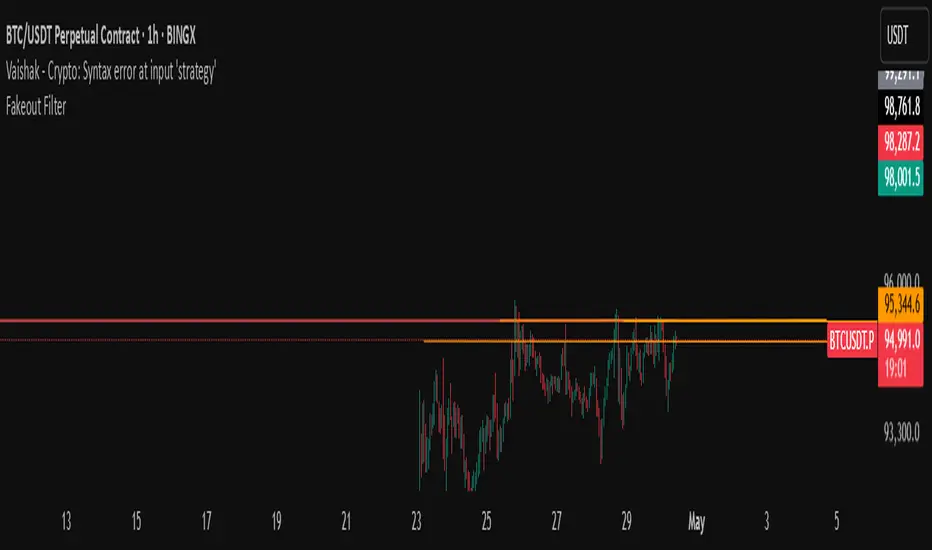
Fakeout Filter📈 Fakeout Filter by ARV
🔍 Overview:
The Fakeout Filter is a smart breakout validation tool designed to help traders avoid false breakouts and focus only on high-probability breakout trades. This indicator combines price action, volume analysis, RSI divergence detection, and OBV trend confirmation to filter out noise and improve your entries.
⚙️ Key Features:
✅ Breakout Detection
Detects when the price closes above a user-defined resistance level.
✅ Volume Spike Confirmation
Confirms breakouts only if there’s a significant increase in volume (customizable via settings).
✅ RSI Bearish Divergence Filter
Warns you of bearish RSI divergence, which often signals fakeouts during breakouts.
✅ OBV Trend Confirmation
Ensures On-Balance Volume (OBV) is rising, aligning volume flow with price movement.
✅ EMA Filter (Trend Confirmation)
Adds a safety filter using Exponential Moving Average (EMA) to ensure price action aligns with the short-term trend.
📌 How to Use:
Set Resistance Level:
In the indicator settings, input a key resistance level (manual input based on your chart analysis).
Watch for Signals:
A green background and “Breakout” label appear when:
Price closes above the resistance.
Volume is significantly higher than average.
OBV is rising.
No bearish RSI divergence is detected.
Price is above the EMA (trend confirmation).
Entry Suggestion:
Consider entering long positions only when the breakout label appears.
For additional confirmation, wait for a retest of the resistance as support before entering.
🔧 Settings:
Resistance Level – Manually set the level you're watching.
Volume Multiplier – Adjusts sensitivity to volume spikes (default: 1.5x average).
RSI Period – RSI used for divergence detection (default: 14).
EMA Period – For trend direction confirmation (default: 21).
✅ Best Use Cases:
Scalpers and intraday traders avoiding fakeouts on 5m–1H timeframes.
Swing traders validating breakout setups.
BTC, ETH, and major altcoins in consolidation or breakout zones.
⚠️ Disclaimer:
This tool is for educational purposes only. Always combine it with your own market analysis and risk management.
Trend Analysis
Vol Spike + Super Trend by Ralpinoy
DESCRIPTION:
A combination of trend indicators in one with and Volume Spikes and some personal touch
A trend-following band built off w ATR. When price closes above the upper band, it flips “Bullish,” and when it closes below the lower band, it flips “Bearish.”
Always remember that the Green Band (UP trending) "TATAAS ang price in Tagalog" then when the Red band its (DOWN Trending) "PAGBABA".
Buy signal when the band flips from red → green; Sell signal when it flips green → red.
Flags bars where volume is “X times” above its moving average.
Additional filters (local highs/lows, hammer/shooter candles, same-color closes) let you only highlight truly significant volume bursts.
Bullish spike = orange circle below bar; Bearish spike = orange circle above bar.
HOW DOES THIS WORKS
ATR & Bands:
The script computes a smoothed ATR.
Upper band = (HL2 − Multiplier·ATR), Lower band = (HL2 + Multiplier·ATR).
Bands “trail” price, flipping direction only on a clear close beyond them—this helps keep you in strong trends and avoids whipsaws.
TREND LOGIC
A simple state variable (trend) holds +1 or –1.
When price closes above the prior lower-band, trend flips to +1; when it closes below the prior upper-band, it flips to –1.
Volume Spike Logic:
volume > MA(volume)×Multiplier flags extreme activity.
Optional “only valid highs & lows,” “only hammers/shooters,” and “same-color” filters give you cleaner, more actionable spikes.
READING THE SIGNALS
Stay long while SuperTrend is green.
Stay short (or stay out of longs) while SuperTrend is red.
Entry Triggers
Buy: SuperTrend flips red→green and prints a “GREEN DOT” label on the band.
Sell: SuperTrend flips green→red and prints a “RED DOT” label.
Volume Spike Confluence
A bullish volume spike (circle below bar) near a SuperTrend flip adds conviction to a long entry.
A bearish volume spike near a down-trend flip adds conviction to a short.
Exits & Stops
A common stop-loss is just beyond the opposite SuperTrend band.
You can also exit when the SuperTrend flips back (i.e. you trade only from flip→next flip).
BEST PRACTICES AND APPLICATIONS
Timeframes: SuperTrend is reliable on 1 H, 4 H, Daily charts. On 1 min/5 min, increase the ATR period or multiplier to reduce noise.
Multipliers:
ATR Multiplier 2–3 for faster flips, 4–5 for more conservative signals.
Volume Multiplier 1.5–2 for catching strong spikes, higher for only extreme activity.
Load the script and toggle only the SuperTrend on. Watch how it trails price.
Activate volume spikes and see which bars light up—note whether they line up with trend flips.
Practice on a demo account: enter on the flip + a confirming volume spike, stop just beyond the opposite band, and target a multiple of your risk ex.x2 (just do it)
With this combo you get a visual, rules-based trend system plus a volume filter to help you catch powerful, momentum-backed moves.
Enjoy, and let me know how does it works for you! Dont be shy to like and comment this indicator, Ralpinoy

ICT Macro Zone Boxes w/ Individual H/L Tracking v3.1ICT Macro Zones (Grey Box Version
This indicator dynamically highlights key intraday time-based macro sessions using a clean, minimalistic grey box overlay, helping traders align with institutional trading cycles. Inspired by ICT (Inner Circle Trader) concepts, it tracks real-time highs and lows for each session and optionally extends the zone box after the session ends — making it a precision tool for intraday setups, order flow analysis, and macro-level liquidity sweeps.
### 🔍 **What It Does**
- Plots **six predefined macro sessions** used in Smart Money Concepts:
- AM Macro (09:50–10:10)
- London Close (10:50–11:10)
- Lunch Macro (11:30–13:30)
- PM Macro (14:50–15:10)
- London SB (03:00–04:00)
- PM SB (15:00–16:00)
- Each zone:
- **Tracks high and low dynamically** throughout the session.
- **Draws a consistent grey shaded box** to visualize price boundaries.
- **Displays a label** at the first bar of the session (optional).
- **Optionally extends** the box to the right after the session closes.
### 🧠 **How It Works**
- Uses Pine Script arrays to define each session’s time window, label, and color.
- Detects session entry using `time()` within a New York timezone context.
- High/Low values are updated per bar inside the session window.
- Once a session ends, the box is optionally closed and fixed in place.
- All visual zones use a standardized grey tone for clarity and consistency across charts.
### 🛠️ **Settings**
- **Shade Zone High→Low:** Enable/disable the grey macro box.
- **Extend Box After Session:** Keep the zone visible after it ends.
- **Show Entry Label:** Display a label at the start of each session.
### 🎯 **Why This Script is Unique**
Unlike basic session markers or colored backgrounds, this tool:
- Focuses on **macro moments of liquidity and reversal**, not just open/close times.
- Uses **per-session logic** to individually track price behavior inside key time windows.
- Supports **real-time high/low tracking and clean zone drawing**, ideal for Smart Money and ICT-style strategies.
Perfect — based on your list, here's a **bundle-style description** that not only explains the function of each script but also shows how they **work together** in a Smart Money/ICT workflow. This kind of cross-script explanation is exactly what TradingView wants to see to justify closed-source mashups or interdependent tools.
---
📚 ICT SMC Toolkit — Script Integration Guide
This set of advanced Smart Money Concept (SMC) tools is designed for traders who follow ICT-based methodologies, combining liquidity theory, time-based precision, and engineered confluences for high-probability trades. Each indicator is optimized to work both independently and synergistically, forming a comprehensive trading framework.
---
First FVG Custom Time Range
**Purpose:**
Plots the **first Fair Value Gap (FVG)** that appears within a defined session (e.g., NY Kill Zone, Custom range). Includes optional retest alerts.
**Best Used With:**
- Use with **ICT Macro Zones (Grey Box Version)** to isolate FVGs during high-probability times like AM Macro or PM SB.
- Combine with **Liquidity Levels** to assess whether FVGs form near swing points or liquidity voids.
---
ICT SMC Liquidity Grabs and OB s
**Purpose:**
Detects **liquidity grabs** (stop hunts above/below swing highs/lows) and **bullish/bearish order blocks**. Includes optional Fibonacci OTE levels for sniper entries.
**Best Used With:**
- Use with **ICT Turtle Soup (Reversal)** for confirmation after a liquidity grab.
- Combine with **Macro Zones** to catch order blocks forming inside timed macro windows.
- Match with **Smart Swing Levels** to confirm structure breaks before entry.
ICT SMC Liquidity Levels (Smart Swing Lows)
**Purpose:**
Automatically marks swing highs/lows based on user-defined lookbacks. Tracks whether those levels have been breached or respected.
**Best Used With:**
- Combine with **Turtle Soup** to detect if a swing level was swept, then reversed.
- Use with **Liquidity Grabs** to confirm a grab occurred at a meaningful structural point.
- Align with **Macro Zones** to understand when liquidity events occur within macro session timing.
ICT Turtle Soup (Liquidity Reversal)
**Purpose:**
Implements the classic ICT Turtle Soup model. Looks for swing failure and quick reversals after a liquidity sweep — ideal for catching traps.
Best Used With:
- Confirm with **Liquidity Grabs + OBs** to identify institutional activity at the reversal point.
- Use **Liquidity Levels** to ensure the reversal is happening at valid previous swing highs/lows.
- Amplify probability when pattern appears during **Macro Zones** or near the **First FVG**.
ICT Turtle Soup Ultimate V2
**Purpose:**
An enhanced, multi-layer version of the Turtle Soup setup that includes built-in liquidity checks, OTE levels, structure validation, and customizable visual output.
**Best Used With:**
- Use as an **entry signal generator** when other indicators (e.g., OBs, liquidity grabs) are aligned.
- Pair with **Macro Zones** for high-precision timing.
- Combine with **First FVG** to anticipate price rebalancing before explosive moves.
---
## 🧠 Workflow Example:
1. **Start with Macro Zones** to focus only on institutional trading windows.
2. Look for **Liquidity Grabs or Swing Sweeps** around key highs/lows.
3. Check for a **Turtle Soup Reversal** or **Order Block Reaction** near that level.
4. Confirm confluence with a **Fair Value Gap**.
5. Execute using the **OTE level** from the Liquidity Grabs + OB script.
---
Let me know which script you want to publish first — I’ll tailor its **individual TradingView description** and flag its ideal **“Best Used With” partners** to help users see the value in your ecosystem.

Major Session Highs/LowsThis indicator creates horizontal lines at major session high/lows (US, London, and Asian). The script updates the lines automatically, on session close.
For instance, when viewing during the US session, after the London overlap, horizontal lines will be displayed at the following levels.
The high/low of the most recent London session.
The high/low of the most recent Asian session.
The high/low of the last full US session, i.e. the session of the day prior.
When the current US session closes, the US levels automatically update.

Lot Size (USD)Calculate lot size and stop loss from the actual price to the stop loss that you enter manually. Only for Forex pairs with USD

Tango Multi-Timeframe Trend DotsTLDR: When the background is green, favor long. When the background is red, favor short.
By default: Will show 5-minute, 10-minute, 15-minute timeframe.
📈 Tango Multi-Timeframe Trend Dots
Tango Trend Dots is a visual trend-tracking tool that plots clean, color-coded trend signals from up to three different timeframes in a dedicated indicator pane. Each dot represents the trend direction on that timeframe:
🟢 Green = Uptrend
🔴 Red = Downtrend
🟡 Yellow = Trend-MACD conflict (optional MACD filter)
🔧 Features
Multi-Timeframe Support: Configure 3 different timeframes (default: 5m, 10m, 15m)
Color-Coded Trends:
Green = uptrend
Red = downtrend
Yellow = conflicting trend & MACD (if enabled)
MACD Filter (optional): Highlights trend conflicts using MACD histogram
Background Shading: Optional highlight when 2 out of 3 timeframes agree
Customizable UI: Clean labels and visual alignment of all signals
📊 Use Cases
Confirm short-term trades with higher timeframe alignment
Identify conflicting signals using MACD divergence
Spot consensus trends with visual clarity

OA - PowerZones Support And ResistancePowerZones - Dynamic Support/Resistance Identifier
Overview
PowerZones is an advanced technical analysis tool that automatically detects significant support and resistance zones using volume data and pivot points. This indicator pulls data from higher timeframes (weekly by default) to help you identify strong and meaningful levels that are filtered from short-term "noise."
Features
Multi-Timeframe Analysis: Create support/resistance levels from daily, weekly, or monthly data
Volume Filtering: Detect high-volume pivot points to identify more reliable levels
Dynamic Threshold: Volume filter that automatically adjusts to market conditions
Visual Clarity: Support/resistance zones are displayed as boxes with adjustable transparency
Optimal Level Selection: Filter out close levels to focus on the most significant support/resistance points
Use Cases
Entry/Exit Points: Identify trading opportunities at important support and resistance levels
Stop-Loss Placement: Use natural support levels to set more effective stop-losses
Target Setting: Use potential resistance levels as profit-taking targets
Understanding Market Structure: Detect long-term support/resistance zones to better interpret price movement
Input Parameters
Lookback Period: The period used to determine pivot points
Box Width : Adjusts the width of support/resistance zones
Relative Volume Period: The period used for relative volume calculation
Maximum Number of Boxes: Maximum number of support/resistance zones to display on the chart
Box Transparency: Transparency value for the boxes
Timeframe: Timeframe to use for support/resistance detection (Daily, Weekly, Monthly)
How It Works
PowerZones identifies pivot highs and lows in the selected timeframe. It filters these points using volume data to show only meaningful and strong levels. The indicator also consolidates nearby levels, allowing you to focus only on the most important zones on the chart.
Best Practices
Weekly timeframe setting is ideal for identifying long-term important support/resistance levels
Working with weekly levels on a daily chart allows you to combine long-term levels with short-term trades
ATR-based box width creates support/resistance zones that adapt to market volatility
Use the indicator along with other technical indicators such as RSI, MACD, or moving averages to confirm trading signals
Note: Like all technical indicators, this indicator does not guarantee 100% accuracy. Always apply risk management principles and use it in conjunction with other analysis methods to achieve the best results.
If you like the PowerZones indicator, please show your support by giving it a star and leaving a comment!

ZLSMACE StrategyZLSMACE Strategy
This is a trend-following strategy that combines:
-Zero-Lag LSMA (ZLSMA): A smoothed, low-lag moving average used to confirm trend direction.
-Chandelier Exit (CE): A volatility-based trailing stop used to detect reversals and shift trade direction.
🟢 Entry Conditions:
Long: CE direction turns bullish and price is above ZLSMA
Short: CE direction turns bearish and price is below ZLSMA
The strategy exits any opposite position before opening a new one, ensuring clean direction switching.
🕒 Best Timeframe
Optimized for 15-minute charts (15m)
Good balance between signal speed and trend filtering

Nexus Trade BotThe Nexus Trade Bot is a sophisticated TradingView Pine Script™ v6 strategy designed for automated trading across forex, futures, stocks, and crypto. It combines trend analysis (using ROC and SMA), Squeeze Momentum, and EMA signals to identify high-probability trade entries and exits. Key features include customizable higher timeframe (HTF) trend confirmation (default 30-min), ATR-based trailing or fixed stop-loss, and robust session management with UTC-based trading hours. JSON alerts integrate seamlessly with webhooks for external apps, providing detailed trade and session data. Ideal for traders seeking a reliable, adaptable automation tool. Defaults and data are tested only for MNQ1! on the 5M timeframe.

Binary Strategy (with SMI logic)🧠 How to Use:
Chart Timeframe: 5-minute
Setup: Wait for an arrow to appear
Green arrow = BUY a 20-min binary in uptrend with positive momentum
Red arrow = SELL a 20-min binary in downtrend with negative momentum
SMI Logic: Entry only when SMI crosses its signal line in the trend direction and above/below zero
Works for Nadex 20-Minute $&P 500 Binary
If long at 75 get out at 50, or if short at 25 get out at 50. This allow you to be trading at a 1:1 ratio. (Approx.)

Dskyz (DAFE) Quantum Sentiment Flux - Beginners Dskyz (DAFE) Quantum Sentiment Flux - Beginners:
Welcome to the Dskyz (DAFE) Quantum Sentiment Flux - Beginners , a strategy and concept that’s your ultimate wingman for trading futures like MNQ, NQ, MES, and ES. This gem combines lightning-fast momentum signals, market sentiment smarts, and bulletproof risk management into a system so intuitive, even newbies can trade like pros. With clean DAFE visuals, preset modes for every vibe, and a revamped dashboard that’s basically a market GPS, this strategy makes futures trading feel like a high-octane sci-fi mission.
Built on the Dskyz (DAFE) legacy of Aurora Divergence, the Quantum Sentiment Flux is designed to empower beginners while giving seasoned traders a lean, sentiment-driven edge. It uses fast/slow EMA crossovers for entries, filters trades with VIX, SPX trends, and sector breadth, and keeps your account safe with adaptive stops and cooldowns. Tuned for more action with faster signals and a slick bottom-left dashboard, this updated version is ready to light up your charts and outsmart institutional traps. Let’s dive into why this strat’s a must-have and break down its brilliance.
Why Traders Need This Strategy
Futures markets are a wild ride—fast moves, volatility spikes (like the April 28, 2025 NQ 1k-point drop), and institutional games that can wreck unprepared traders. Beginners often get lost in complex systems or burned by impulsive trades. The Quantum Sentiment Flux is the antidote, offering:
Dead-Simple Setup: Preset modes (Aggressive, Balanced, Conservative) auto-tune signals, risk, and sizing, so you can trade without a quant degree.
Sentiment Superpower: VIX filter, SPX trend, and sector breadth visuals keep you aligned with market health, dodging chop and riding trends.
Ironclad Safety: Tighter ATR-based stops, 2:1 take-profits, and preset cooldowns protect your capital, even in chaotic sessions.
Next-Level Visuals: Green/red entry triangles, vibrant EMAs, a sector breadth background, and a beefed-up dashboard make signals and context pop.
DAFE Swagger: The clean aesthetics, sleek dashboard—ties it to Dskyz’s elite brand, making your charts a work of art.
Traders need this because it’s a plug-and-play system that blends beginner-friendly simplicity with pro-level market awareness. Whether you’re just starting or scalping 5min MNQ, this strat’s your key to trading with confidence and style.
Strategy Components
1. Core Signal Logic (High-Speed Momentum)
The strategy’s engine is a momentum-based system using fast and slow Exponential Moving Averages (EMAs), now tuned for faster, more frequent trades.
How It Works:
Fast/Slow EMAs: Fast EMA (Aggressive: 5, Balanced: 7, Conservative: 9 bars) and slow EMA (12/14/18 bars) track short-term vs. longer-term momentum.
Crossover Signals:
Buy: Fast EMA crosses above slow EMA, and trend_dir = 1 (fast EMA > slow EMA + ATR * strength threshold).
Sell: Fast EMA crosses below slow EMA, and trend_dir = -1 (fast EMA < slow EMA - ATR * strength threshold).
Strength Filter: ma_strength = fast EMA - slow EMA must exceed an ATR-scaled threshold (Aggressive: 0.15, Balanced: 0.18, Conservative: 0.25) for robust signals.
Trend Direction: trend_dir confirms momentum, filtering out weak crossovers in choppy markets.
Evolution:
Faster EMAs (down from 7–10/21–50) catch short-term trends, perfect for active futures markets.
Lower strength thresholds (0.15–0.25 vs. 0.3–0.5) make signals more sensitive, boosting trade frequency without sacrificing quality.
Preset tuning ensures beginners get optimized settings, while pros can tweak via mode selection.
2. Market Sentiment Filters
The strategy leans hard into market sentiment with a VIX filter, SPX trend analysis, and sector breadth visuals, keeping trades aligned with the big picture.
VIX Filter:
Logic: Blocks long entries if VIX > threshold (default: 20, can_long = vix_close < vix_limit). Shorts are always allowed (can_short = true).
Impact: Prevents longs during high-fear markets (e.g., VIX spikes in crashes), while allowing shorts to capitalize on downturns.
SPX Trend Filter:
Logic: Compares S&P 500 (SPX) close to its SMA (Aggressive: 5, Balanced: 8, Conservative: 12 bars). spx_trend = 1 (UP) if close > SMA, -1 (DOWN) if < SMA, 0 (FLAT) if neutral.
Impact: Provides dashboard context, encouraging trades that align with market direction (e.g., longs in UP trend).
Sector Breadth (Visual):
Logic: Tracks 10 sector ETFs (XLK, XLF, XLE, etc.) vs. their SMAs (same lengths as SPX). Each sector scores +1 (bullish), -1 (bearish), or 0 (neutral), summed as breadth (-10 to +10).
Display: Green background if breadth > 4, red if breadth < -4, else neutral. Dashboard shows sector trends (↑/↓/-).
Impact: Faster SMA lengths make breadth more responsive, reflecting sector rotations (e.g., tech surging, energy lagging).
Why It’s Brilliant:
- VIX filter adds pro-level volatility awareness, saving beginners from panic-driven losses.
- SPX and sector breadth give a 360° view of market health, boosting signal confidence (e.g., green BG + buy signal = high-probability trade).
- Shorter SMAs make sentiment visuals react faster, perfect for 5min charts.
3. Risk Management
The risk controls are a fortress, now tighter and more dynamic to support frequent trading while keeping accounts safe.
Preset-Based Risk:
Aggressive: Fast EMAs (5/12), tight stops (1.1x ATR), 1-bar cooldown. High trade frequency, higher risk.
Balanced: EMAs (7/14), 1.2x ATR stops, 1-bar cooldown. Versatile for most traders.
Conservative: EMAs (9/18), 1.3x ATR stops, 2-bar cooldown. Safer, fewer trades.
Impact: Auto-scales risk to match style, making it foolproof for beginners.
Adaptive Stops and Take-Profits:
Logic: Stops = entry ± ATR * atr_mult (1.1–1.3x, down from 1.2–2.0x). Take-profits = entry ± ATR * take_mult (2x stop distance, 2:1 reward/risk). Longs: stop below entry, TP above; shorts: vice versa.
Impact: Tighter stops increase trade turnover while maintaining solid risk/reward, adapting to volatility.
Trade Cooldown:
Logic: Preset-driven (Aggressive/Balanced: 1 bar, Conservative: 2 bars vs. old user-input 2). Ensures bar_index - last_trade_bar >= cooldown.
Impact: Faster cooldowns (especially Aggressive/Balanced) allow more trades, balanced by VIX and strength filters.
Contract Sizing:
Logic: User sets contracts (default: 1, max: 10), no preset cap (unlike old 7/5/3 suggestion).
Impact: Flexible but risks over-leverage; beginners should stick to low contracts.
Built To Be Reliable and Consistent:
- Tighter stops and faster cooldowns make it a high-octane system without blowing up accounts.
- Preset-driven risk removes guesswork, letting newbies trade confidently.
- 2:1 TPs ensure profitable trades outweigh losses, even in volatile sessions like April 27, 2025 ES slippage.
4. Trade Entry and Exit Logic
The entry/exit rules are simple yet razor-sharp, now with VIX filtering and faster signals:
Entry Conditions:
Long Entry: buy_signal (fast EMA crosses above slow EMA, trend_dir = 1), no position (strategy.position_size = 0), cooldown passed (can_trade), and VIX < 20 (can_long). Enters with user-defined contracts.
Short Entry: sell_signal (fast EMA crosses below slow EMA, trend_dir = -1), no position, cooldown passed, can_short (always true).
Logic: Tracks last_entry_bar for visuals, last_trade_bar for cooldowns.
Exit Conditions:
Stop-Loss/Take-Profit: ATR-based stops (1.1–1.3x) and TPs (2x stop distance). Longs exit if price hits stop (below) or TP (above); shorts vice versa.
No Other Exits: Keeps it straightforward, relying on stops/TPs.
5. DAFE Visuals
The visuals are pure DAFE magic, blending clean function with informative metrics utilized by professionals, now enhanced by faster signals and a responsive breadth background:
EMA Plots:
Display: Fast EMA (blue, 2px), slow EMA (orange, 2px), using faster lengths (5–9/12–18).
Purpose: Highlights momentum shifts, with crossovers signaling entries.
Sector Breadth Background:
Display: Green (90% transparent) if breadth > 4, red (90%) if breadth < -4, else neutral.
Purpose: Faster breadth_sma_len (5–12 vs. 10–50) reflects sector shifts in real-time, reinforcing signal strength.
- Visuals are intuitive, turning complex signals into clear buy/sell cues.
- Faster breadth background reacts to market rotations (e.g., tech vs. energy), giving a pro-level edge.
6. Sector Breadth Dashboard
The new bottom-left dashboard is a game-changer, a 3x16 table (black/gray theme) that’s your market command center:
Metrics:
VIX: Current VIX (red if > 20, gray if not).
SPX: Trend as “UP” (green), “DOWN” (red), or “FLAT” (gray).
Trade Longs: “OK” (green) if VIX < 20, “BLOCK” (red) if not.
Sector Breadth: 10 sectors (Tech, Financial, etc.) with trend arrows (↑ green, ↓ red, - gray).
Placeholder Row: Empty for future metrics (e.g., ATR, breadth score).
Purpose: Consolidates regime, volatility, market trend, and sector data, making decisions a breeze.
- VIX and SPX metrics add context, helping beginners avoid bad trades (e.g., no longs if “BLOCK”).
Sector arrows show market health at a glance, like a cheat code for sentiment.
Key Features
Beginner-Ready: Preset modes and clear visuals make futures trading a breeze.
Sentiment-Driven: VIX filter, SPX trend, and sector breadth keep you in sync with the market.
High-Frequency: Faster EMAs, tighter stops, and short cooldowns boost trade volume.
Safe and Smart: Adaptive stops/TPs and cooldowns protect capital while maximizing wins.
Visual Mastery: DAFE’s clean flair, EMAs, dashboard—makes trading fun and clear.
Backtestable: Lean code and fixed qty ensure accurate historical testing.
How to Use
Add to Chart: Load on a 5min MNQ/ES chart in TradingView.
Pick Preset: Aggressive (scalping), Balanced (versatile), or Conservative (safe). Balanced is default.
Set Contracts: Default 1, max 10. Stick low for safety.
Check Dashboard: Bottom-left shows preset, VIX, SPX, and sectors. “OK” + green breadth = strong buy.
Backtest: Run in strategy tester to compare modes.
Live Trade: Connect to Tradovate or similar. Watch for slippage (e.g., April 27, 2025 ES issues).
Replay Test: Try April 28, 2025 NQ drop to see VIX filter and stops in action.
Why It’s Brilliant
The Dskyz (DAFE) Quantum Sentiment Flux - Beginners is a masterpiece of simplicity and power. It takes pro-level tools—momentum, VIX, sector breadth—and wraps them in a system anyone can run. Faster signals and tighter stops make it a trading machine, while the VIX filter and dashboard keep you ahead of market chaos. The DAFE visuals and bottom-left command center turn your chart into a futuristic cockpit, guiding you through every trade. For beginners, it’s a safe entry to futures; for pros, it’s a scalping beast with sentiment smarts. This strat doesn’t just trade—it transforms how you see the market.
Final Notes
This is more than a strategy—it’s your launchpad to mastering futures with Dskyz (DAFE) flair. The Quantum Sentiment Flux blends accessibility, speed, and market savvy to help you outsmart the game. Load it, watch those triangles glow, and let’s make the markets your canvas!
Official Statement from Pine Script Team
(see TradingView help docs and forums):
"This warning may appear when you call functions such as ta.sma inside a request.security in a loop. There is no runtime impact. If you need to loop through a dynamic list of tickers, this cannot be avoided in the present version... Values will still be correct. Ignore this warning in such contexts."
(This publishing will most likely be taken down do to some miscellaneous rule about properly displaying charting symbols, or whatever. Once I've identified what part of the publishing they want to pick on, I'll adjust and repost.)
Use it with discipline. Use it with clarity. Trade smarter.
**I will continue to release incredible strategies and indicators until I turn this into a brand or until someone offers me a contract.
Created by Dskyz, powered by DAFE Trading Systems. Trade fast, trade bold.

RTB - Momentum Breakout Strategy V3
📈 RTB - Momentum Breakout Strategy V3 is a directional breakout strategy based on momentum. It combines exponential moving averages (EMAs), RSI, and recent support/resistance levels to detect breakout entries with trend confirmation. The system includes dynamic risk management using ATR-based stop-loss and trailing stop levels. Webhook alerts are supported for external automated trading integrations.
🔎 The strategy was backtested using default parameters on BTCUSDT Futures (Bybit) with 4-hour timeframe and a 0.05% commission per trade.
⚠️ This script is for educational purposes only and does not constitute financial advice. Always do your own research before trading.

DECODE M2 Global Liquidity IndexThe most comprehensive M2 indicator on Trading View.
- Custom lead setting (days)
- Data sources for the 20 largest economies
- Only selected sources are loaded for efficiency
- Automatic multi-timeframe recalculation

Quater PointsThis is my personal indicator that marks the quater points and also the 100 points. These are all valuable and strong support and resistance levels for NQ not tested on any other ticker.

Enhanced TotT Heuristics Inspired IndicatorTrend analysis with emas that showws break and structure change

RVOL Relative Volume – Intraday (v5 with Zones)RVOL Relative Volume – Intraday (v4)
Traffic light colour system allows Trade/No trade decision making at a glance!
Quickly spot the volume spikes that matter on your intraday charts
What it is
This indicator measures the current bar’s volume against its historical average for the same minute-of-day over the past N_ days. It helps you see at a glance whether today’s volume is below average, “cautionary,” or truly elevated—so you can focus only on the bars that matter for high-probability setups.
How it works
1.Historical buffer
Collects cumulative volume for each minute-of-day across the last N_ full trading days (plus the current session).
2.Relative Volume (rvol)
rvol = (volume so far this minute) / (average volume seen at this minute over prior N days).
3.Color coding
-Red (bar skipped) = rvol < 0.60 × average
-Yellow (caution) = 0.60 ≤ rvol < 1.25 × average
-Green (go) = rvol ≥ 1.25 × average
How to use
-Green bars are your actionable volume spikes—ideal for entries on breakouts, reversals, or key levels.
-Yellow bars flag mild pickup in activity—treat them as “watch and wait.”
-Red bars indicate low-interest periods; best to sit out until volume returns.
Inputs
Lookback Days (N) – how many prior full trading days to average (1–60).
DST Adjustment – ±1 if daylight-saving shift occurred last weekend (usually 0).
Display
Plots a histogram of rvol in its own pane.
Horizontal guides at 1.0× (average) and 2.0×.
Why it’s useful
Filters out noise during thin volume periods.
Highlights true “fuel injection” moments.
Works on any intraday timeframe (1 min–<1 day).

EMA Crossover Strategy with AlertsEMA Crossover Strategy with Alerts
Overview
The EMA Crossover Strategy is a popular trend-following trading strategy that utilizes two Exponential Moving Averages (EMAs) to identify potential buy and sell signals. This strategy is designed to help traders capture significant market trends by generating alerts when a crossover or crossunder occurs between the short-term and long-term EMAs.
Strategy Details
Short EMA Length: 9 periods
Long EMA Length: 21 periods
How It Works
Calculation of EMAs:
The strategy calculates two EMAs: a short-term EMA (9 periods) and a long-term EMA (21 periods).
Crossover and Crossunder Conditions:
Crossover Condition: A buy signal is generated when the short-term EMA crosses above the long-term EMA.
Crossunder Condition: A sell signal is generated when the short-term EMA crosses below the long-term EMA.
Buy and Sell Signals:
Buy Signal: Plotted below the bar with a green label when the crossover condition is met.
Sell Signal: Plotted above the bar with a red label when the crossunder condition is met.
Alerts:
Alerts are set up to notify traders when a buy or sell signal is generated:
Buy Alert: Triggered when the short-term EMA crosses above the long-term EMA.
Sell Alert: Triggered when the short-term EMA crosses below the long-term EMA.
Strategy Execution:
Buy Entry: The strategy enters a long position when the buy condition is met.
Sell Entry: The strategy enters a short position when the sell condition is met.
Benefits
Trend Identification: Helps traders identify and follow strong market trends.
Clear Signals: Provides clear buy and sell signals based on EMA crossovers.
Alerts: Keeps traders informed with real-time alerts for buy and sell signals.
Usage
This strategy is suitable for various markets and timeframes. Traders can customize the EMA lengths to fit their specific trading style and market conditions.

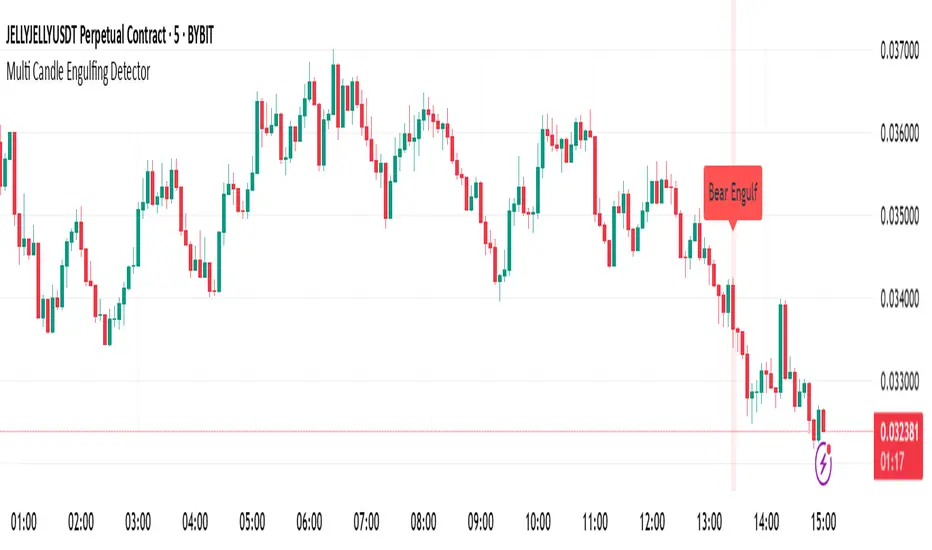
Multi Candle Engulfing Detector🔍 Multi Candle Engulfing Detector
This indicator identifies powerful engulfing candles that consume three or more previous candles — a signal often tied to strong market reversals or continuation moves.
🧠 Features
Detects candles that fully engulf the previous 3 or more candles
Optional filtering: only trigger when the engulfed candles are of the opposite color
Customizable engulf count for greater pattern control
Clear bullish and bearish signal labels on the chart
Alerts integrated: get notified the moment a setup forms
Background highlighting for enhanced visibility
⚙️ Settings
Minimum Number of Candles to Engulf: Default is 3, but can be adjusted
Require Opposite Color: When enabled, the engulfing candle must be opposite in color to the engulfed ones (e.g., green engulfing red)
📈 Use Cases
Spot strong reversal signals at tops and bottoms
Confirm breakout momentum on trend continuation
Use in confluence with other tools like volume or support/resistance
🚨 Alerts
Alerts fire when a bullish or bearish engulfing pattern is detected, allowing for mobile, email, or webhook notifications.
✅ Notes
This script is fully customizable and can be extended into a strategy or scanning tool. Feedback and suggestions are always welcome!
ORB-X v6 (Dashed OR Lines)ORB-X v6 – 15-Minute Opening-Range Breakout Helper by Opskie.
WHAT THE SCRIPT DOES
• Draws the opening range: tracks the highest high and lowest low from 09:30 to 09:45 ET (or any custom window you set) and projects two yellow dashed lines across the rest of the session.
• Alerts:
– “ORB Breakout Up” fires when price closes above the OR-High.
– “ORB Breakout Down” fires when price closes below the OR-Low.
• Screener-ready output: a hidden series called ORB_Long_OK equals “1” on bars where the long breakout is valid. Add this column in TradingView’s Stock Screener and filter “≠ NA” to see a live list of breakouts.
• Fully editable: change session start, opening-range length, colours and line styles in the settings.
QUICK-START GUIDE
Add the script to any chart (Indicators → My Scripts → ORB-X v6).
Wait for the first 15-minute window to close; two dashed yellow lines will appear.
(Optional) Set an alert:
• Alerts → Create Alert → Condition = “ORB Breakout Up” (or Down) → choose “Once per bar close”.
Build a Stock Screener watch-list:
• Open Stock Screener.
• Filters: Exchange = NASDAQ + NYSE, set any price band you like (for example 3 to 6 USD).
• Columns (gear icon) → Indicators → tick ORB_Long_OK.
• Hover the ORB_Long_OK header → funnel icon → choose “≠ NA”.
Now the table lists only tickers whose latest closed bar has broken above their 15-minute OR-High.
USER INPUTS
• Session Start Hour / Minute (default 09:30 ET) – first bar of the range
• Range Length (minutes) (default 15) – how long to measure highs/lows
• Line colours and styles – purely cosmetic
TYPICAL WORKFLOW
Premarket: scan for liquid gappers and momentum names.
09:30–09:45 ET: let ORB-X mark the range; no trades yet.
After 09:45: trade only symbols that close above their OR-High (ORB_Long_OK = 1) using your own risk rules (e.g. stop just below the high).
End of day: journal the results and refine.
DISCLAIMER
This indicator is for educational purposes only and is not financial advice. Test on a demo account first and always use proper risk management.

Schaff Trend Cycle (STC) - t0rdn3Schaff Trend Cycle (STC)
By t0rdn3 (original STC by , now with more descriptive naming)
Description
The Schaff Trend Cycle (STC) is a momentum-based oscillator that combines the speed of a fast EMA crossover with cyclical normalization. Developed by Doug Schaff, it identifies market turning points more responsively than MACD or RSI.
How It Works
1. EMA Difference : Calculates the difference between two EMAs of the source series (default: close).
2. Cycle Percentage : Normalizes that difference to a 0–100 range over the cycle period.
3. Smoothing : Applies exponential smoothing twice—first to the cycle percentage, then to its normalized cycles—to reduce noise.
4. Final STC Line : Produces a smoothed oscillator oscillating between 0 and 100.
Alerts
- "STC turned down above 75" : Fires once when STC makes a local peak above the upper threshold ( 75 ).
- "STC turned up below 25" : Fires once when STC makes a local trough below the lower threshold ( 25 ).
Inputs
Cycle Period : 12 — Lookback in bars for normalization
Fast EMA Length : 26 — Period of the fast EMA
Slow EMA Length : 50 — Period of the slow EMA
Smoothing Factor : 0.5 — Exponential smoothing coefficient (0–1)
Usage
Readings above 75 indicate an overbought cycle; readings below 25 indicate an oversold cycle. Crossings of the 50 midline can confirm trend direction:
- STC rising through 50 → bullish shift
- STC falling through 50 → bearish shift
Combine STC with price action or other trend filters to improve signal quality. You can adjust the cycle period and EMA lengths to match different timeframes or instruments.

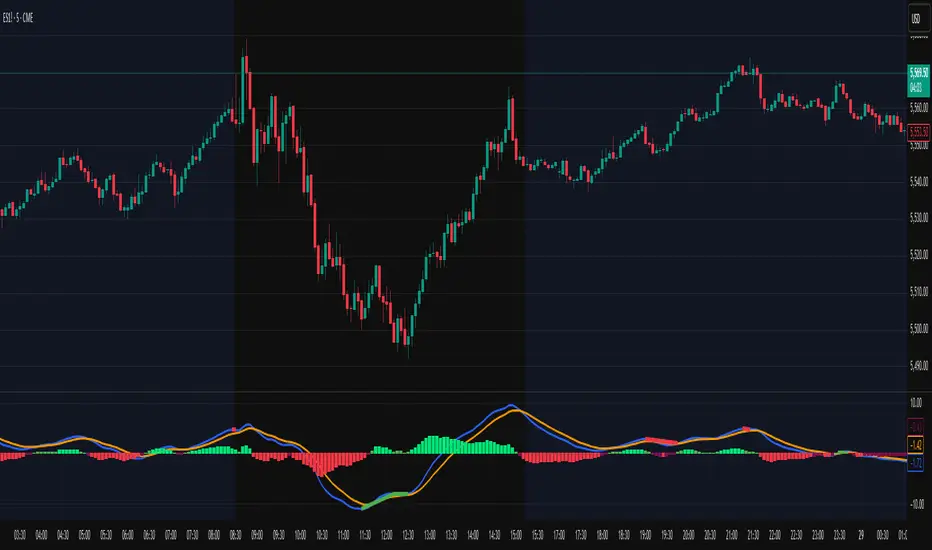
Smart Adaptive MACDAn advanced MACD variant that dynamically adapts to market volatility using ATR-based scaling.
Key Features:
Volatility-sensitive MACD and Signal lengths
Optional smoothed MACD line
Dynamic histogram heatmap (strong vs. weak momentum)
Built-in Regular and Hidden Divergence detection
Clear visual signals via solid (regular) and dashed (hidden) divergence lines
What makes this different:
Unlike traditional MACD indicators with fixed-length settings, this version adapts in real time
to changing volatility conditions. It shortens during high-momentum environments for faster
reaction, and lengthens during low-volatility phases to reduce noise. This allows better
alignment with market behavior and cleaner momentum signals.
Divergence Detection – How It Works
The Smart Adaptive MACD detects both regular and hidden divergences by comparing price action with the smoothed MACD line. It uses recent pivot highs and lows to evaluate divergence and draws lines on the chart when conditions are met.
Regular Divergence Detection
This type of divergence signals potential reversals. It occurs when the price moves in one
direction while the MACD moves in the opposite.
Bullish Regular Divergence:
Price makes lower lows, but MACD makes higher lows.
Result: A solid green line is plotted beneath the MACD curve.
Bearish Regular Divergence:
Price makes higher highs, but MACD makes lower highs.
Result: A solid red line is plotted above the MACD curve.
Hidden Divergence Detection
This type of divergence signals trend continuation. It occurs when price pulls back slightly,
but the MACD shows deeper movement in the opposite direction.
Bullish Hidden Divergence:
Price makes higher lows, but MACD makes lower lows.
Result: A dashed green line is plotted below the MACD curve.
Bearish Hidden Divergence:
Price makes lower highs, but MACD makes higher highs.
Result: A dashed red line is plotted above the MACD curve.
How to Use:
This tool is best used alongside price structure, key support/resistance levels, or as a
secondary confirmation for your trend or reversal strategy. It is designed to enhance your
interpretation of market momentum and divergence without needing extra chart clutter.
Disclaimer:
This script is provided for educational and informational purposes only. It is not intended as
financial advice or a recommendation to buy or sell any asset. Always conduct your own
research and consult with a licensed financial advisor before making trading decisions. Use
at your own risk.
License:
This script is published under the Mozilla Public License 2.0 and is fully open-source.
Built by AresIQ | 2025
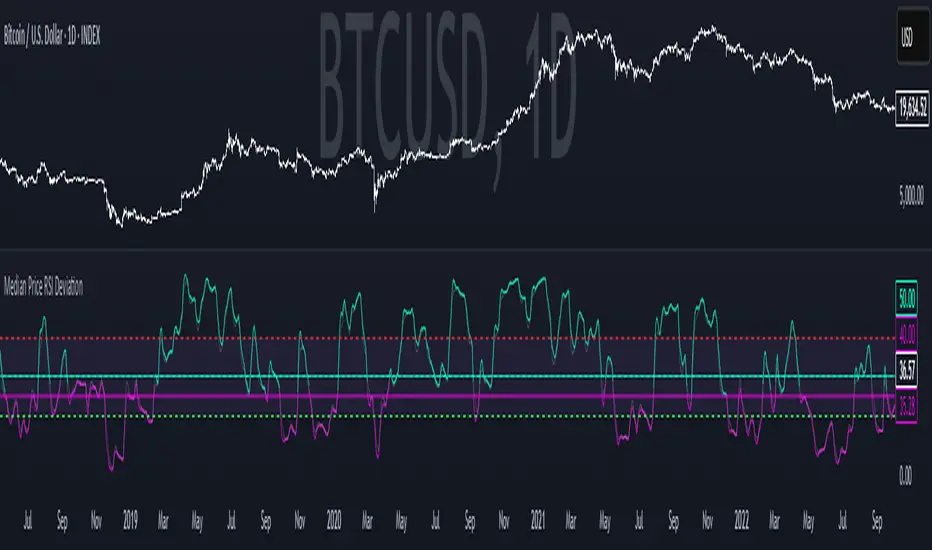
Median Price RSI DeviationThis indicator is a smoothed RSI-based trend filter that combines median price smoothing, customizable moving averages, and standard deviation bands to identify bullish or bearish conditions:
=> It first smooths price using a median filter.
=> Then it calculates RSI on that smoothed price.
=> The RSI is further smoothed using a selectable moving average (e.g., DEMA, EMA).
=> Standard deviation bands are applied around this smoothed RSI.
Signals:
=> A bullish signal is triggered when the upper band exceeds a long threshold (default 50).
=> A bearish signal occurs when the smoothed RSI drops below a short threshold (default 40).
Mul EMA [TsixJnineY]The "Four EMA Indicator with Toggle" is a customizable technical analysis tool for TradingView that displays up to four Exponential Moving Averages (EMAs) on the chart. Users can adjust the period length for each EMA (default: 5, 10, 50, 200) and toggle their visibility via checkboxes. The indicator supports a selectable data source (default: close price) and offset for flexible chart alignment. Ideal for trend analysis and identifying trading signals through EMA crossovers, it offers a clean and user-friendly interface for traders.
