[NIC] Volatility Anomaly Indicator (Inspired by Jeff Augen)Volatility Anomaly Indicator (Inspired by Jeff Augen)
The Volatility Anomaly Indicator, inspired by Jeff Augen’s The Volatility Edge in Options Trading, helps traders spot price distortions by analyzing volatility imbalances. It compares short-term (10-day) and long-term (30-day) historical volatility (HV), plotting the ratio in a subgraph with clusters of dots to highlight anomalies—red for volatility spikes (potential sells) and green for calm periods (potential buys).
Originality: This indicator uniquely adapts Augen’s volatility concepts into a visual tool, focusing on relative volatility distortions rather than absolute levels, making it ideal for volatile assets like $TQQQ.
Features:
Calculates the ratio of short-term to long-term volatility.
Detects spikes (ratio > 1.5) and calm periods (ratio < 0.67) with customizable thresholds.
Plots volatility ratio as a blue line, with red/green dots for anomalies.
Includes optional buy/sell signals on the main chart (if overlay is enabled).
How It Works
The indicator computes historical volatility using log returns, then calculates the short-term to long-term volatility ratio. Spikes and calm periods are marked with dots in the subgraph, and threshold lines (1.5 and 0.67) provide context. Buy signals (green triangles) trigger during calm periods, and sell signals (red triangles) during spikes.
How to Use
Apply to any chart (e.g., NASDAQ:TQQQ daily).
Adjust inputs: Short Volatility Period (10), Long Volatility Period (30), Volatility Spike Threshold (1.5).
Watch for red dot clusters (spikes, potential sells) and green dot clusters (calm, potential buys).
Combine with price action or RSI for confirmation.
Why Use This Indicator?
Focuses on volatility-driven price inefficiencies.
Clear visualization with dot clusters.
Customizable for different assets and timeframes.
Limitations
Not a standalone system; requires confirmation.
May give false signals in choppy markets.
Volatility

Asian Session Standard DeviationA configurable standard deviation indicator for showing the standard deviation from specific session times. Typically useful for measuring Asian session as setup for later sessions.

StochRSI Strategy with SL/TP updatedSimple StoschiRSi strategy have backtest with input management of stop loss and take profit, have some adjustment to other version the exit the trade..

THE GOAT EMA/VWAP Cross Hilight + Bull/Bear RVOLx3 hilow🧠 Description
This all-in-one indicator is designed for serious traders who want high-conviction entries, volume-confirmed reversals, and a clean, efficient display of trend and momentum behavior.
It combines:
📈 Three independent EMA + VWAP crossover detectors
🔼 Bullish cross signals with optional arrows and highlights
🔽 Bearish cross signals with separate styling
📊 3x Relative Volume (RVOL) candles
🔷 Aqua for bullish high-volume moves
🔴 Fuchsia for bearish high-volume moves
🟤 Volume Pressure Drop Detection
Highlights dark maroon candles after a high RVOL bar followed by a sudden volume drop — often signaling a potential reversal or exhaustion
🔧 Fully Customizable:
Toggle on/off each EMA/VWAP setup
Adjust MA lengths, VWAP periods, highlight colors
Configure the RVOL threshold and lookback window
Set the volume drop sensitivity
Enable/disable the on-chart color legend for visual reference
🔔 Built-In Alerts:
✅ Bullish and bearish EMA+VWAP crosses (for all 3 setups)
✅ High RVOL candles
✅ Volume drop after RVOL (reversal zone)
🎨 Visual Key:
Condition Candle Color
📈 Bullish 3x RVOL 🔷 Aqua
📉 Bearish 3x RVOL 🔴 Fuchsia
🛑 Volume Drop After RVOL 🟤 Dark Maroon
➕ Cross Highlights Custom per setup
🧭 Best For:
Breakout and trend continuation entries
Reversal signals after climax candles
Momentum confirmation with volume
Multi-timeframe stack strategies using VWAP and EMA alignment

THE GOAT EMA/VWAP Cross Hilight + Bull/Bear RVOLx3🧠 Description
This premium tool is designed for traders who want precise entry signals based on trend confirmation, volume strength, and momentum conviction.
It combines:
📈 Three customizable EMA + VWAP crossover setups
🔼 Bullish cross detection with arrow + highlight
🔽 Bearish cross detection with arrow + highlight
🔊 Real-time alerts for all crossover events
📊 Relative Volume (RVOL) candle paint when volume exceeds a user-defined multiple of average volume
🔵 Bullish RVOL candles = aqua
🔴 Bearish RVOL candles = fuchsia
🔧 Customization Features
Enable/disable each of the 3 crossover setups independently
Customize EMA/VWAP lengths, highlight colors, and volume thresholds
Adjust RVOL lookback period and multiplier in settings
Clean, minimal styling — no background clutter, just actionable color-coded signals
🚦 Signal Logic
Signal Type Trigger Condition Visual Cue
Bullish Cross Price crosses above both EMA & VWAP Up arrow + highlight
Bearish Cross Price crosses below both EMA & VWAP Down arrow + highlight
Bullish RVOL Volume > 3× average and candle is green (close > open) Candle body turns aqua
Bearish RVOL Volume > 3× average and candle is red (close < open) Candle body turns fuchsia
🔔 Alerts Included
Setup 1, 2, 3: Bullish cross
Setup 1, 2, 3: Bearish cross
High RVOL candle detection
💡 Ideal For:
Trend continuation or reversal entries
Volume-based confirmation for breakouts
Multi-timeframe EMA/VWAP stack strategies
Traders who want clean, reliable visual cues

Volatility ML StrategyThis strategy uses proxy indicators for machine learning-predicted volatility and GARCH-based expected volatility. Trades are triggered when predicted volatility change exceeds threshold and market momentum confirms. Based on a fully engineered XGBoost + GARCH Python pipeline, adapted into Pine Script for backtesting and deployment on TradingView

Peak Pulse ReversalPeak Pulse Reversal is a clean and accurate indicator designed to detect price exhaustion zones.
It uses a combination of internal logic to identify high-probability reversal points — both at tops and bottoms.
📈 Ideal for swing and intraday traders
🔍 Highlights overbought/oversold extremes with signal arrows
🧠 Combines multiple hidden tools under a simplified interface
🔎 Among the signals generated by the indicator, purple and orange signals represent moments where multiple internal indicators confirm an overbought or oversold condition simultaneously.
These signals often form at stronger exhaustion points and indicate a higher probability of reversal.
💡 Therefore, purple and orange signals are considered high-confidence zones.
🔐 Manual access only. Contact @traderpango for access

Liquid Pulse Liquid Pulse by Dskyz (DAFE) Trading Systems
Liquid Pulse is a trading algo built by Dskyz (DAFE) Trading Systems for futures markets like NQ1!, designed to snag high-probability trades with tight risk control. it fuses a confluence system—VWAP, MACD, ADX, volume, and liquidity sweeps—with a trade scoring setup, daily limits, and VIX pauses to dodge wild volatility. visuals include simple signals, VWAP bands, and a dashboard with stats.
Core Components for Liquid Pulse
Volume Sensitivity (volumeSensitivity) controls how much volume spikes matter for entries. options: 'Low', 'Medium', 'High' default: 'High' (catches small spikes, good for active markets) tweak it: 'Low' for calm markets, 'High' for chaos.
MACD Speed (macdSpeed) sets the MACD’s pace for momentum. options: 'Fast', 'Medium', 'Slow' default: 'Medium' (solid balance) tweak it: 'Fast' for scalping, 'Slow' for swings.
Daily Trade Limit (dailyTradeLimit) caps trades per day to keep risk in check. range: 1 to 30 default: 20 tweak it: 5-10 for safety, 20-30 for action.
Number of Contracts (numContracts) sets position size. range: 1 to 20 default: 4 tweak it: up for big accounts, down for small.
VIX Pause Level (vixPauseLevel) stops trading if VIX gets too hot. range: 10 to 80 default: 39.0 tweak it: 30 to avoid volatility, 50 to ride it.
Min Confluence Conditions (minConditions) sets how many signals must align. range: 1 to 5 default: 2 tweak it: 3-4 for strict, 1-2 for more trades.
Min Trade Score (Longs/Shorts) (minTradeScoreLongs/minTradeScoreShorts) filters trade quality. longs range: 0 to 100 default: 73 shorts range: 0 to 100 default: 75 tweak it: 80-90 for quality, 60-70 for volume.
Liquidity Sweep Strength (sweepStrength) gauges breakouts. range: 0.1 to 1.0 default: 0.5 tweak it: 0.7-1.0 for strong moves, 0.3-0.5 for small.
ADX Trend Threshold (adxTrendThreshold) confirms trends. range: 10 to 100 default: 41 tweak it: 40-50 for trends, 30-35 for weak ones.
ADX Chop Threshold (adxChopThreshold) avoids chop. range: 5 to 50 default: 20 tweak it: 15-20 to dodge chop, 25-30 to loosen.
VWAP Timeframe (vwapTimeframe) sets VWAP period. options: '15', '30', '60', '240', 'D' default: '60' (1-hour) tweak it: 60 for day, 240 for swing, D for long.
Take Profit Ticks (Longs/Shorts) (takeProfitTicksLongs/takeProfitTicksShorts) sets profit targets. longs range: 5 to 100 default: 25.0 shorts range: 5 to 100 default: 20.0 tweak it: 30-50 for trends, 10-20 for chop.
Max Profit Ticks (maxProfitTicks) caps max gain. range: 10 to 200 default: 60.0 tweak it: 80-100 for big moves, 40-60 for tight.
Min Profit Ticks to Trail (minProfitTicksTrail) triggers trailing. range: 1 to 50 default: 7.0 tweak it: 10-15 for big gains, 5-7 for quick locks.
Trailing Stop Ticks (trailTicks) sets trail distance. range: 1 to 50 default: 5.0 tweak it: 8-10 for room, 3-5 for fast locks.
Trailing Offset Ticks (trailOffsetTicks) sets trail offset. range: 1 to 20 default: 2.0 tweak it: 1-2 for tight, 5-10 for loose.
ATR Period (atrPeriod) measures volatility. range: 5 to 50 default: 9 tweak it: 14-20 for smooth, 5-9 for reactive.
Hardcoded Settings volLookback: 30 ('Low'), 20 ('Medium'), 11 ('High') volThreshold: 1.5 ('Low'), 1.8 ('Medium'), 2 ('High') swingLen: 5
Execution Logic Overview trades trigger when confluence conditions align, entering long or short with set position sizes. exits use dynamic take-profits, trailing stops after a profit threshold, hard stops via ATR, and a time stop after 100 bars.
Features Multi-Signal Confluence: needs VWAP, MACD, volume, sweeps, and ADX to line up.
Risk Control: ATR-based stops (capped 15 ticks), take-profits (scaled by volatility), and trails.
Market Filters: VIX pause, ADX trend/chop checks, volatility gates. Dashboard: shows scores, VIX, ADX, P/L, win %, streak.
Visuals Simple signals (green up triangles for longs, red down for shorts) and VWAP bands with glow. info table (bottom right) with MACD momentum. dashboard (top right) with stats.
Chart and Backtest:
NQ1! futures, 5-minute chart. works best in trending, volatile conditions. tweak inputs for other markets—test thoroughly.
Backtesting: NQ1! Frame: Jan 19, 2025, 09:00 — May 02, 2025, 16:00 Slippage: 3 Commission: $4.60
Fee Typical Range (per side, per contract)
CME Exchange $1.14 – $1.20
Clearing $0.10 – $0.30
NFA Regulatory $0.02
Firm/Broker Commis. $0.25 – $0.80 (retail prop)
TOTAL $1.60 – $2.30 per side
Round Turn: (enter+exit) = $3.20 – $4.60 per contract
Disclaimer this is for education only. past results don’t predict future wins. trading’s risky—only use money you can lose. backtest and validate before going live. (expect moderators to nitpick some random chart symbol rule—i’ll fix and repost if they pull it.)
About the Author Dskyz (DAFE) Trading Systems crafts killer trading algos. Liquid Pulse is pure research and grit, built for smart, bold trading. Use it with discipline. Use it with clarity. Trade smarter. I’ll keep dropping badass strategies ‘til i build a brand or someone signs me up.
2025 Created by Dskyz, powered by DAFE Trading Systems. Trade smart, trade bold.

Unified ATR Zones### 🧠 **Purpose of the Script**
This indicator draws **ATR-based support and resistance levels** directly on the price chart (overlay). It's a clean and minimal visualization of current volatility zones derived from the **ATR (Average True Range)**.
---
### ⚙️ **1. User Inputs**
```pinescript
atr_length = input.int(14, "ATR Period", minval=1)
smoothing = input.string("RMA", "Smoothing", options= )
use_prev_close = input(false, "Use Previous Close")
```
* `atr_length`: The number of bars to calculate the ATR (default 14).
* `smoothing`: Type of moving average used to smooth the ATR.
* `use_prev_close`: If true, use the previous close (`close `) as the base level. If false, use the current close.
---
### 📐 **2. ATR Calculation**
```pinescript
true_range = ta.tr(true)
atr_value = ma_function(true_range, atr_length)
```
* `true_range`: Measures the maximum of:
* High - Low
* High - Previous Close
* Low - Previous Close
* `atr_value`: Smoothed version of `true_range` using the selected MA type.
---
### 📏 **3. Base Level**
```pinescript
base_level = use_prev_close ? close : close
```
* This is the price reference point for plotting zones:
* Can be today's close or yesterday’s close, based on user input.
---
### 🧱 **4. Zone Plotting**
```pinescript
plot(base_level, "Base", color=color.gray, linewidth=1)
plot(base_level + atr_value, "1 ATR Long", color=color.green)
plot(base_level + atr_value * 1.5, "1.5 ATR Long", color=color.blue)
plot(base_level - atr_value, "1 ATR Short", color=color.red)
plot(base_level - atr_value * 1.5, "1.5 ATR Short", color=color.maroon)
```
* **Base level** is plotted in gray.
* **+1 ATR and +1.5 ATR levels** are shown above as resistance or targets (green/blue).
* **–1 ATR and –1.5 ATR levels** are plotted below as support or potential reversal zones (red/maroon).
---
### 📋 **5. Info Panel**
```pinescript
var table info_table = table.new(position.top_right, 2, 1)
table.cell(info_table, 0, 0, "ATR: " + str.tostring(atr_value, "#.##"), bgcolor=color.new(color.gray, 90))
```
* A small **table in the top-right corner** shows the current ATR value.
* Background is semi-transparent gray for a clean look.
---
### ✅ **Use Case**
This script is useful for:
* Visualizing real-time **volatility zones**.
* Planning entries/exits or managing risk based on market volatility.
* Identifying breakout or retracement opportunities at dynamic ATR-based levels.
---
Would you like to add **alerts** when price touches any of these zones, or include more zone levels (e.g. 0.5 ATR)?

ATR Zone Levels Pro### 🧠 **Purpose of the Script**
The script calculates **dynamic support/resistance levels** above and below a base price using the **ATR (Average True Range)**. These "zones" help traders identify potential areas of price reaction, entries, or stop placement based on current market volatility.
---
### ⚙️ **1. User Inputs**
```pinescript
show_long = input(true, "Show Long Levels")
show_short = input(true, "Show Short Levels")
use_close_price = input(true, "Use Close Price")
atr_length = input.int(14, "ATR Period", minval=1)
smoothing = input.string("RMA", "Smoothing Type", options= )
```
* `show_long` and `show_short`: Allow toggling visibility of long/short zones.
* `use_close_price`: If true, base level = close price; else, it’s the average of high and low.
* `atr_length`: Number of bars used for ATR calculation.
* `smoothing`: Type of smoothing applied to the ATR.
---
### 📐 **2. ATR Calculation with Custom Smoothing**
```pinescript
ma_function(source, length) => ...
true_range = ta.tr(true)
atr = ma_function(true_range, atr_length)
```
* `true_range`: Calculates the true range for each bar.
* `atr`: Applies user-selected smoothing function to the true range to get ATR.
---
### 📏 **3. Base Level Calculation**
```pinescript
base_level = use_close_price ? close : (high + low) / 2
```
* Defines the **base price level** for the zones:
* `close` if selected, otherwise midpoint of high and low.
---
### 🔢 **4. Calculating Zone Levels**
```pinescript
array.push(long_levels, base_level + atr * 0.3) ...
array.push(short_levels, base_level - atr * 0.3) ...
```
* Creates arrays of levels spaced at multipliers of ATR (0.3x, 0.5x, 1x, 1.5x).
* `long_levels` are above the base level (for breakout or continuation).
* `short_levels` are below (for breakdown or reversal).
---
### 🖼️ **5. Plotting Levels**
```pinescript
plot(show_long ? array.get(long_levels, 1) : na, ...)
```
* Each level is plotted with distinct colors.
* If `show_long` or `show_short` is disabled, the corresponding lines are hidden.
---
### 📋 **6. Info Table (Top Right Corner)**
```pinescript
var table info_table = table.new(position.top_right, 2, 5)
```
* Displays:
* Current ATR value
* Main Long/Short zone level (1 ATR above/below base)
* Chosen smoothing type
* Current base price
---
### 🏷️ **7. Info Label on Chart**
```pinescript
label.new(bar_index, base_level, ...)
```
* Shows a label near the base price on the last bar with:
* Base level
* ATR value
* Old label is deleted on each bar to keep only one active label.
---
### ✅ **Use Case**
This indicator is ideal for:
* Determining dynamic **support/resistance levels**
* Planning entries/exits based on volatility zones
* Structuring trades with ATR-based risk zones (e.g. 1.5x ATR stops)
---
Would you like me to add **alerts** when price reaches these zones or crosses them?

Seekho roj kamaoVery accurate buy and sell entries.This custom trading indicator delivers powerful market insights by combining price action, volume trends, and momentum shifts. Designed for precision, it identifies high-probability entry and exit points, minimizing noise and maximizing clarity. Whether you're day trading or swing trading, it enhances decision-making and adapts seamlessly to various market conditions

MACD - El Cruce de Oro//@version=5
strategy("MACD - El Cruce de Oro", overlay=true, default_qty_type=strategy.percent_of_equity, default_qty_value=2)
// === INPUTS ===
fastLength = input.int(20, title="MACD Fast Length")
slowLength = input.int(40, title="MACD Slow Length")
signalSmoothing = input.int(20, title="Signal Smoothing")
sl_pct = input.float(0.5, title="Stop Loss %", minval=0.1, maxval=5)
trailing_pct = input.float(0.5, title="Trailing Stop %", minval=0.1, maxval=5)
// === MACD CÁLCULO ===
= ta.macd(close, fastLength, slowLength, signalSmoothing)
// === CONDICIONES DE ENTRADA ===
longCondition = ta.crossover(macdLine, signalLine)
shortCondition = ta.crossunder(macdLine, signalLine)
// === GESTIÓN DE RIESGO ===
sl = close * sl_pct / 100
tsl = close * trailing_pct / 100
// === ENTRADAS Y SALIDAS ===
if (longCondition)
strategy.entry("Compra", strategy.long)
strategy.exit("SL/TS Long", from_entry="Compra", stop=close - sl, trail_points=tsl, trail_offset=tsl)
if (shortCondition)
strategy.entry("Venta", strategy.short)
strategy.exit("SL/TS Short", from_entry="Venta", stop=close + sl, trail_points=tsl, trail_offset=tsl)
// === PLOTEO DE LÍNEAS MACD ===
plot(macdLine, color=color.blue, title="MACD Line")
plot(signalLine, color=color.red, title="Signal Line")

VWAP Buy with Profit Target and Stop LossThis strategy is helpful in intraday of swing for 2-3 days , choose stocks wisely like HDFC bank ICICI bank to get profitable trade more than 70% and profit factor more than 1.2

ConeCastConeCast is a forward-looking projection indicator that visualizes a future price range (or "cone") based on recent trend momentum and adaptive volatility. Unlike lagging bands or reactive channels, this tool plots a predictive zone 3–50 bars ahead, allowing traders to anticipate potential price behavior rather than merely react to it.
How It Works
The core of ConeCast is a dynamic trend-slope engine derived from a Linear Regression line fitted over a user-defined lookback window. The slope of this trend is projected forward, and the cone’s width adapts based on real-time market volatility. In calm markets, the cone is narrow and focused. In volatile regimes, it expands proportionally, using an ATR-based % of price to scale.
Key Features
📈 Predictive Cone Zone: Visualizes a forward range using trend slope × volatility width.
🔄 Auto-Adaptive Volatility Scaling: Expands or contracts based on market quiet/chaotic states.
📊 Regime Detection: Identifies Bull, Bear, or Neutral states using a tunable slope threshold.
🧭 Multi-Timeframe Compatible: Slope and volatility can be calculated from higher timeframes.
🔔 Smart Alerts: Detects price entering the cone, and signals trend regime changes in real time.
🖼️ Clean Visual Output: Optionally includes outer cones, trend-trail marker, and dashboard label.
How to Use It
Use on 15m–4H charts for best forward visibility.
Look for price entering the cone as a potential trend continuation setup.
Monitor regime changes and volatility expansion to filter choppy market zones.
Tune the slope sensitivity and ATR multiplier to match your symbol's behavior.
Use outer cones to anticipate aggressive swings and wick traps.
What Makes It Unique
ConeCast doesn’t follow price — it predicts a possible future price envelope using trend + volatility math, without relying on lagging indicators or repainting logic. It's a hybrid of regression-based forecasting and dynamic risk zoning, designed for swing traders, scalpers, and algo developers alike.
Limitations
ConeCast projects based on current trend and volatility — it does not "know" future price. Like all projection tools, accuracy depends on trend persistence and market conditions. Use this in combination with confirmation signals and risk management.

RSI-EMA-Crossing with Donchian-Stop-LossThe Donchian RSI Indicator is a visual tool that combines momentum and trend analysis to identify high-quality long opportunities based on RSI crossovers, price action, and Donchian channel dynamics.
How It Works
Momentum Signal: A bullish RSI crossover is detected when the RSI crosses above its moving average.
Trend Filter: A signal is only valid if the crossover occurs while the price is above its moving average – filtering out entries against the prevailing trend.
Signal Candle: The high of the crossover candle is stored.
Entry Trigger: A valid signal occurs when a later candle closes above that signal high.
Stop-Loss (Visual Only)
The lower band of the Donchian Channel acts as a visual reference for a dynamic stop-loss level.
Features
Customizable RSI, Donchian Channel, and moving average lengths
Selectable MA types: SMA, EMA, WMA, VWMA, HMA
Signal candle highlighted (yellow background)
Entry points labeled on the chart
Price MA and Donchian Channel plotted
Trend filter improves signal quality by confirming upward bias
Use Case
Designed for swing and position traders
Optimized for use on daily or 4H charts

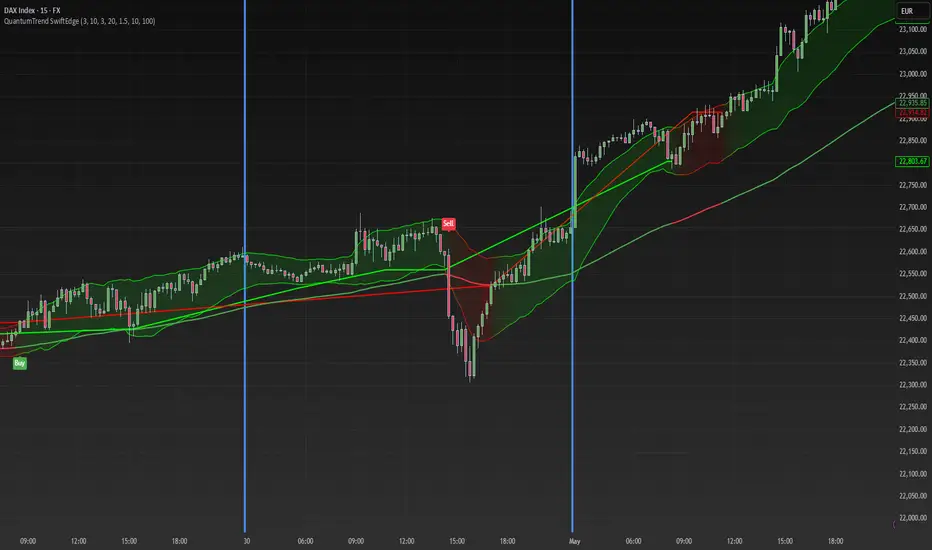
QuantumTrend SwiftEdgeQuantumTrend SwiftEdge - A Trend-Following Indicator for TradingView
Overview:
QuantumTrend SwiftEdge is a visually engaging and customizable trend-following indicator that combines the power of Supertrend, Keltner Channels, and a 100-period EMA to generate precise buy and sell signals. Designed to help traders identify trends and breakouts, this indicator offers a unique blend of technical tools with a modern gradient color effect, making it both functional and visually appealing.
What It Does:
This indicator identifies trend directions and potential entry/exit points:
- Supertrend determines the overall trend direction, showing a green line below the price during uptrends and a red line above the price during downtrends. The line only appears when the price is close to it, indicating an active trend.
- Keltner Channels highlight volatility and breakouts, with the upper and lower bands dynamically adjusting to market conditions.
- A 100-period EMA provides a longer-term trend perspective, helping to filter out noise.
- Buy and sell signals are generated when specific conditions align across these indicators, ensuring robust trade setups.
How It Works:
The indicator uses three components to generate signals:
1. **Supertrend**: Calculates trend direction using the Average True Range (ATR) and a multiplier. It switches between uptrend (green) and downtrend (red) based on price movements relative to the Supertrend line.
2. **Keltner Channels**: Consists of an EMA (default 20 periods) with upper and lower bands based on ATR. A breakout above the upper band signals potential buying opportunities, while a breakout below the lower band signals potential selling opportunities.
3. **100-period EMA**: Acts as a trend filter, ensuring signals align with the broader market direction.
**Buy Signal**:
- Price is above the 100-period EMA (bullish market).
- Price breaks above the Keltner Channel upper band (indicating a breakout).
- Supertrend switches to an uptrend (trend changes from down to up).
**Sell Signal**:
- Price is below the 100-period EMA (bearish market).
- Price breaks below the Keltner Channel lower band (indicating a breakout).
- Supertrend switches to a downtrend (trend changes from up to down).
Visual Features:
- **Gradient Colors**: Supertrend lines and Keltner Channels use a smooth gradient color transition between green (uptrend) and red (downtrend), reflecting the trend's strength. The gradient is based on a smoothed trend value, creating a visually appealing effect.
- **Keltner Channel Fill**: The area between the upper and lower Keltner Channels is filled with a transparent gradient, enhancing the trend visualization.
- **Dynamic Supertrend Visibility**: Supertrend lines only appear when the price is close to the line (within an ATR-based threshold), indicating an active trend.
How to Use:
1. Add the "QuantumTrend SwiftEdge" indicator to your chart in TradingView.
2. Customize the settings:
- **Signal Sensitivity (1=Low, 5=High)**: Default is 3. Lower values (e.g., 1) make signals less frequent by using wider parameters, while higher values (e.g., 5) make signals more frequent by tightening parameters.
- **Use Manual Settings**: If enabled, you can manually adjust all parameters (ATR Period, ATR Multiplier, Keltner Channel Length, Keltner Channel Multiplier, Keltner ATR Length, EMA Length) to fine-tune the indicator.
- **Change ATR Calculation Method**: Toggle between standard ATR calculation and a simple moving average of true range.
- **Show Buy/Sell Signals**: Toggle to show or hide buy (green "Buy" label) and sell (red "Sell" label) signals.
- **Highlighter On/Off**: Toggle to show or hide the gradient fill between the price and Supertrend line when the line is visible.
3. Interpret the signals:
- A green "Buy" label below the price indicates a potential buying opportunity.
- A red "Sell" label above the price indicates a potential selling opportunity.
- Use the Keltner Channel gradient fill and Supertrend lines to confirm the trend direction and strength.
Why This Combination?
- **Supertrend** provides a robust trend-following mechanism, ensuring signals align with the market direction.
- **Keltner Channels** add a volatility component, identifying breakouts that often precede significant price movements.
- **100-period EMA** filters out noise, ensuring signals are generated in the context of the broader trend.
Together, these indicators create a balanced approach: Supertrend and EMA confirm the trend, while Keltner Channels pinpoint actionable entry and exit points. The gradient visuals and dynamic visibility make it easier to focus on active trends.
Originality:
QuantumTrend SwiftEdge stands out with its unique features:
- Gradient color transitions for a modern, dynamic look.
- A filled gradient between Keltner Channels, visually emphasizing the trend.
- Supertrend lines that only appear when the price is close, reducing clutter and focusing on active trends.
- Flexible settings with both sensitivity-based and manual adjustments for maximum customization.
Default Settings:
The default sensitivity is set to 3, providing a balanced approach for most markets and timeframes (e.g., 5-minute charts for crypto like BTC/USD). This setting uses moderate parameters (ATR Period=10, ATR Multiplier=3.0, Keltner Channel Length=20, Keltner Channel Multiplier=1.5, Keltner ATR Length=10, EMA Length=100). Users can adjust the sensitivity or switch to manual settings for more control.
Important Notes:
- This indicator is a tool to assist in identifying trends and potential entry/exit points. It does not guarantee profits and should be used in conjunction with other analysis and risk management practices.
- The signals are based on historical price data and do not predict future performance. Always test the indicator on a demo account before using it in live trading.
- The gradient effect is purely visual and does not affect the signal logic.
EST Session High & Low RaysAsian and London session highs and lows for EST. Good for looking at key levels.

XAU Master Scalper [Modular]Built for XAUUSD (Gold) scalpers who demand precision and speed, this modular scalping indicator analyzes real-time price behavior using 12 powerful price-action and volume-based filters—with no moving averages, no repainting, and no lag.
What Makes This Indicator Elite:
🔹 12 Smart Filters Combined
From body strength to volatility bursts, micro breakouts to wick traps—each candle is scored live using institutional-grade logic.
🔹 Pure Price Action Based
No EMA, no SMA, no smoothing tricks. Just raw, real-time data intelligently interpreted for scalping.
🔹 Buy/Sell Decision Engine
Each candle gets a "score" from 0–12. If conditions align, it instantly triggers a BUY (green) or SELL (red) signal — visible on chart.
🔹 Custom Scoring Thresholds
Use inputs to fine-tune your edge: Minimum BUY score, Maximum SELL score, and visual toggle options.
🔹 Alerts Ready
Set TradingView alerts to get BUY/SELL push notifications in real time — no need to stare at the chart.
Best Used On:
XAUUSD (Gold) on Lower Timeframes (e.g. 30s, 2M, 5m)
Scalpers and aggressive intraday traders

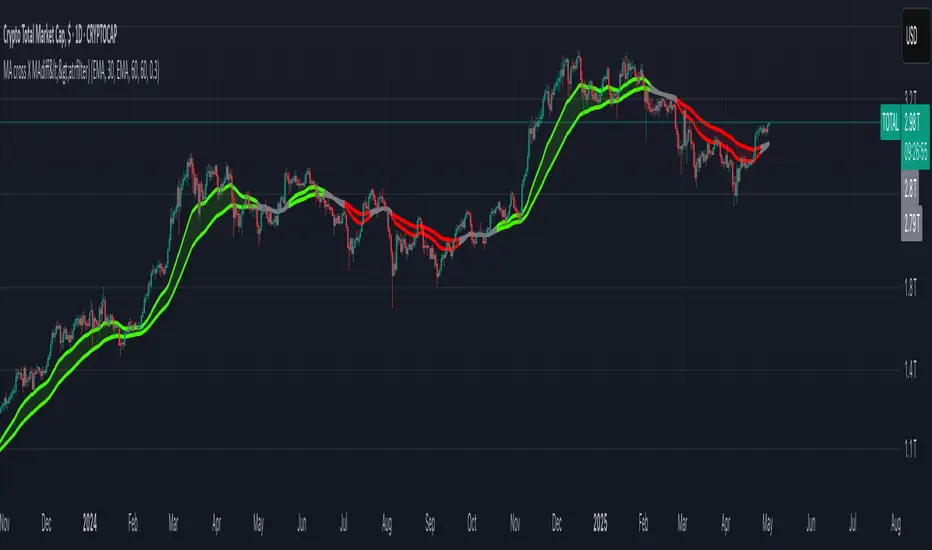
MA cross X MAdiff<>atrfilter)📈 MA cross X MAdiff<>ATR filter
Smarter Trend Confirmation Using Adaptive Volatility Thresholds
🔍 What It Does
This indicator upgrades classic moving average crossovers by adding volatility awareness via ATR filtering. Instead of reacting to every small crossover, it waits for the distance between two moving averages to exceed a volatility-adjusted threshold, making signals more meaningful and less noisy.
⚙️ Core Logic
Calculates the difference between a Fast MA and a Slow MA.
Uses Average True Range (ATR) as a dynamic volatility filter.
Confirms trend only when MA difference exceeds:
diff > ATR × multiplier → Bullish
diff < -ATR × multiplier → Bearish
Otherwise: Neutral (gray zone)
The gray zone avoids false signals by detecting indecision or choppy markets.
🧠 Customizable Inputs
Choose any MA type independently for Fast and Slow:
SMA, EMA, WMA, VWMA, RMA, DEMA, TEMA, LSMA, Kijun
Control sensitivity via:
ATR Length
ATR Multiplier
✅ Why It Works
Reduces fake outs in ranging markets.
Adapts to volatility automatically.
Fully customizable for any asset or style.
Ideal for trend traders, momentum entries, or as a confluence layer.
External Signals Strategy Tester v5External Signals Strategy Tester v5 – User Guide (English)
1. Purpose
This Pine Script strategy is a universal back‑tester that lets you plug in any external buy/sell series (for example, another indicator, webhook feed, or higher‑time‑frame condition) and evaluate a rich set of money‑management rules around it – with a single click on/off workflow for every module.
2. Core Workflow
Feed signals
Buy Signal / Sell Signal inputs accept any series (price, boolean, output of request.security(), etc.).
A crossover above 0 is treated as “signal fired”.
Date filter
Start Date / End Date restricts the test window so you can exclude unwanted history.
Trade engine
Optional Long / Short enable toggles.
Choose whether opposite signals simply close the trade or reverse it (flip direction in one transaction).
Risk modules – all opt‑in via check‑boxes
Classic % block – fixed % Take‑Profit / Stop‑Loss / Break‑Even.
Fibonacci Bollinger Bands (FBB) module
Draws dynamic VWMA/HMA/SMA/EMA/DEMA/TEMA mid‑line with ATR‑scaled Fibonacci envelopes.
Every line can be used for stops, trailing, or multi‑target exits.
Separate LONG and SHORT sub‑modules
Each has its own SL plus three Take‑Profits (TP1‑TP3).
Per TP you set line, position‑percentage to close, and an optional trailing flag.
Executed TP/SLs deactivate themselves so they cannot refire.
Trailing behaviour
If Trail is checked, the selected line is re‑evaluated once per bar; the order is amended via strategy.exit().
3. Inputs Overview
Group Parameter Notes
Trade Settings Enable Long / Enable Short Master switches
Close on Opposite / Reverse Position How to react to a counter‑signal
Risk % Use TP / SL / BE + their % Traditional fixed‑distance management
Fibo Bands FIBO LEVELS ENABLE + visual style/length Turn indicator overlay on/off
FBB LONG SL / TP1‑TP3 Enable, Line, %, Trail Rules applied only while a long is open
FBB SHORT SL / TP1‑TP3 Enable, Line, %, Trail Rules applied only while a short is open
Line choices: Basis, 0.236, 0.382, 0.5, 0.618, 0.764, 1.0 – long rules use lower bands, short rules use upper bands automatically.
4. Algorithm Details
Position open
On the very first bar after entry, the script checks the direction and activates the corresponding LONG or SHORT module, deactivating the other.
Order management loop (every bar)
FBB Stop‑Loss: placed/updated at chosen band; if trailing, follows the new value.
TP1‑TP3: each active target updates its limit price to the selected band (or holds static if trailing is off).
The classic % block runs in parallel; its exits have priority because they call strategy.close_all().
Exit handling
When any strategy.exit() fires, the script reads exit_id and flips the *_Active flag so that order will not be recreated.
A Stop‑Loss (SL) also disables all remaining TPs for that leg.
5. Typical Use Cases
Scenario Suggested Setup
Scalping longs into VWAP‐reversion Enable LONG TP1 @ 0.382 (30 %), TP2 @ 0.618 (40 %), SL @ 0.236 + trailing
Fade shorts during news spikes Enable SHORT SL @ 1.0 (no trail) and SHORT TP1,2,3 on consecutive lowers with small size‑outs
Classic trend‑follow Use only classic % TP/SL block and disable FBB modules
6. Hints & Tips
Signal quality matters – this script manages exits, it does not generate entries.
Keep TV time zone in mind when picking start/end dates.
For portfolio‑style testing allocate smaller default_qty_value than 100 % or use strategy.percent_of_equity sizing.
You can combine FBB exits with fixed‑% ones for layered management.
7. Limitations / Safety
No pyramiding; the script holds max one position at a time.
All calculations are bar‑close; intra‑bar touches may differ from real‑time execution.
The indicator overlay is optional, so you can run visual‑clean tests by unchecking FIBO LEVELS ENABLE.

EMA/SMA Combo + ADR (v6)This script combines popular moving averages with a clean, info-rich ADR table – perfect for traders who trade breakouts.
✳️ Features:
• 🟦 EMA 10 / 20 / 50 / 100 / 200 → shown as dotted points
• 🔷 SMA 10 / 20 / 50 / 100 / 200 → shown as solid lines
• 🎛️ All lines can be individually toggled on/off
• 📊 ADR info table shows average range, today’s range & % of ADR
🎯 Ideal for:
• Intraday traders looking for clean MAs & volatility reference
• Swing traders seeking strong confluence zones
• Anyone who prefers a minimalistic, customizable overlay
🧠 Pro Tip: The ADR table is styled for light charts – black text, no background. You can customize the MA display exactly as you like.
Trade smart, stay sharp! 🚀
