Market Regime Candle DominanceDescription: This script, "Market Regime Candle Dominance," overlays a TradingView chart to visually identify market regimes—bullish trends, bearish trends, or ranging markets—using adaptive calculations and volatility detection. It dynamically colors candles and highlights the background to indicate current market conditions.
How It Works:
Inputs:
Users define colors for bullish, bearish, and ranging trends, adjust sensitivity thresholds for volatility and trends, and set an adaptive calculation length.
Adaptive Calculation:
A period adjustment factor (calcPeriod) dynamically alters based on the chart's timeframe, ensuring meaningful calculations across different timeframes.
Volatility and Trend Detection:
Using the True Range (ta.tr) and price change (close - close ), the script calculates volatility and trend strength to determine market conditions.
Trend sensitivity is adjustable through thresholds (trendThreshold), enabling finer or broader regime detection.
Market Regime Identification:
Bullish Trend: Detected when trendStrength > trendThreshold.
Bearish Trend: Triggered when trendStrength < -trendThreshold.
Ranging Market: Identified when neither bullish nor bearish trends are present.
Candle Coloring:
Candles are colored according to the market regime:
Green for bullish trends.
Red for bearish trends.
Blue (semi-transparent) for ranging markets.
Background Highlights:
An optional feature (highlightRegime) adds semi-transparent background colors corresponding to the detected regime, enhancing visual clarity of the chart.
Features:
Adaptive Sensitivity: Adjusts the calculation length and thresholds for precision across different chart timeframes.
Customizable Display: Allows users to personalize colors and enable/disable background highlights.
Visual Clarity: Simplifies the identification of market regimes, providing clear direction at a glance.
Volatility

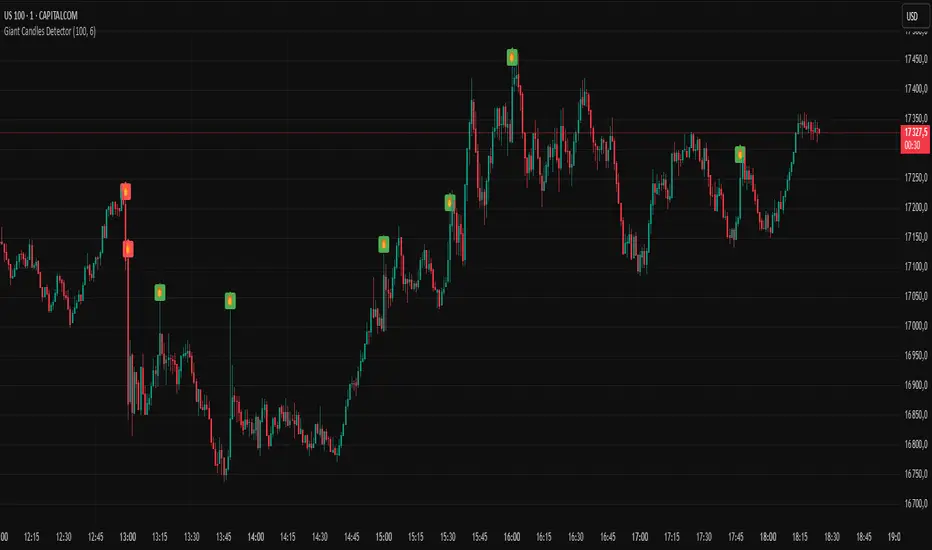
Giant Candles DetectorThis script identifies abnormally large candles — also known as "giant candles" — based on a customizable size threshold relative to the average candle size over a user-defined period.
Key Features:
Automatically detects candles that are significantly larger than average.
Differentiates between bullish (green) and bearish (red) candles.
Option to visually highlight candles with background color.
Built-in alert to notify you immediately when a giant candle appears.
Ideal for traders looking to spot volatility spikes, key breakouts, or significant price movements with minimal effort.
Daily Bollinger Band StrategyOverview of the Daily Bollinger Band Strategy
1. Strategy Overview and Features
This strategy is a tool for backtesting a trading method that uses Bollinger Bands. It is *not* a tool for automated trading.
1-1. Main Display Items
The main chart displays the Bollinger Bands and the 200-day moving average.
It also shows the entry and exit points along with the position size (in units of 100 shares).
1-2. Summary of Trading Rules
For long (buy) strategies, the trade enters when the price crosses above the +1σ line of the Bollinger Bands, aiming to ride an upward trend. The position is exited when the price crosses below the middle band.
For short (sell) strategies, the trade enters when the price crosses below the -1σ line of the Bollinger Bands, aiming to ride a downward trend. The position is exited when the price crosses above the middle band.
1-3. Strategic Enhancements
The strategy uses the slope of the 200-day moving average to determine the trend direction and enter trades accordingly. This improves the win rate and payoff ratio.
Additionally, to reduce the probability of ruin, the risk per trade is limited to 1.0% of capital, and position sizing is adjusted using ATR (a volatility indicator).
2. Trading Rules
2-1. Chart Type
Only daily charts are used.
2-2. Indicators Used
(1) Bollinger Bands** (used for entry and exit signals)
- Period: Fixed at 80 days
- Upper and lower bands: Fixed at ±1σ
(2) Moving Average** (used to determine trend direction)
- Period: Fixed at 200 days
- Trend direction is judged based on whether the difference from the previous day is positive (upward) or negative (downward)
2-3. Buy Rules
Setup:
- Price crosses above the +1σ line from below
- Both the middle band and 200-day moving average are upward sloping
Entry:
- Buy at the next day’s market open using a market order
Exit:
- If the price crosses below the middle band, sell at the next day’s open using a market order
2-4. Sell Rules
Setup:
- Price crosses below the -1σ line from above
- Both the middle band and 200-day moving average are downward sloping
Entry:
- Sell at the next day’s market open using a market order
Exit:
- If the price crosses above the middle band, buy back at the next day’s open using a market order
2-5. Risk Management Rules
- Risk per trade: 1.0% of total capital (acceptable loss = capital × 1.0%)
- Position size: Acceptable loss ÷ 2ATR (rounded down to the nearest unit of 100 shares)
2-6. Other Notes
- No brokerage fees
- No pyramiding
- No partial exits
- No reverse positions (no “stop-and-reverse” trades)
3. Strategy Parameters
The following settings can be specified:
3-1. Period Settings
- Start date: Set the start date for the backtest period
- Stop date: Set the end date for the backtest period
3-2. Display of Trend and Signals
- Show trend: When checked, the background color of the bars is light red for an uptrend and light blue for a downtrend
- Show signal: When checked, entry and exit signals are displayed (note: signals are executed at the next day’s open, so there is a one-day lag in the display)
3-3. Capital Management Settings
- Funds: Capital available for trading (in JPY)
- Risk rate: Specify what percentage of the capital to risk per trade
Settings in the “Properties” tab are not used in this strategy.
4. Backtest Results (Example)
Here are the backtest results conducted by the author:
- Target Stocks: All components of the Nikkei 225
- Test Period: January 4, 2000 – December 30, 2024
- Data Points: 12,886
- Win Rate: 33.45%
- Net Profit: ¥82,132,380
- Payoff Ratio: 2.450
- Expected Value: ¥6,373.8
- Risk Rate: 1.0%
- Probability of Ruin: 0.00%
---
デイリー・ボリンジャーバンド・ストラテジーの概要
1. ストラテジーの概要と特徴
このストラテジーは、ボリンジャーバンドを使ったトレード手法のバックテストを行うツールです。自動売買を行うツールではありません。
1-1. 主な表示項目
メインチャートにボリンジャーバンドと 200日移動平均線を表示します。
また、エントリーと手仕舞いのタイミングと数量(100株単位)も表示されます。
1-2. トレードルールの概要
買い戦略の場合、ボリンジャーバンドの +1σ 超えでエントリーして上昇トレンドに乗り、ミドルバンドを割ったら決済します。
売り戦略の場合、ボリンジャーバンドの -1σ 割りでエントリーして下降トレンドに乗り、ミドルバンドを上抜けたら決済します。
1-3. ストラテジーの工夫点
200日移動平均線の傾きを見てトレンド方向にエントリーをしています。こうして勝率とペイオフレシオの成績を向上しています。
また、破産確率を抑えるために、リスク資金比率を 1.0% にして、ATR(ボラティリティ指標) を使って注文数を調整しています。
2. 売買ルール
2-1. 使用するチャート
日足チャートに限定します
2-2. 使用する指標
(1) ボリンジャーバンド(仕掛けと手仕舞いのシグナルに使用)
期間は80日に固定
上下バンドは ±1σ に固定
(2) 移動平均線(トレンドの方向を見るために使用)
期間は200日に固定
移動平均の値の前日との差がプラスのとき上向き、マイナスのとき下向きと判断
2-3. 買いのルール
セットアップ:ボリンジャーバンドの +1σ を価格が下から上に交差 かつ ミドルバンドと 200日移動平均線が上向き
仕掛け:翌日の寄り付きに成行で買う
手仕舞い:ボリンジャーバンドのミドルバンドを価格が上から下に交差したら、翌日の寄り付きに成行で売る
2-4. 売りのルール
セットアップ:ボリンジャーバンドの -1σ を価格が上から下に交差 かつ ミドルバンドと 200日移動平均線が下向き
仕掛け:翌日の寄り付きに成行で売る
手仕舞い:ボリンジャーバンドのミドルバンドを価格が下から上に交差したら、翌日の寄り付きに成行で買い戻す
2-5. 資金管理のルール
リスク資金比率:資産の 1.0%(許容損失 = 資産 × 1.0%)
注文数:許容損失 ÷ 2ATR(単元株数未満は切り捨て)
2-6. その他
仲介手数料:なし
ピラミッディング:なし
分割決済:なし
ドテン:しない
3. ストラテジーのパラメーター
次の項目が指定できます。
3-1. 期間の設定
Staer date : バックテストの検証期間の開始日を指定します
Stop date : バックテストの検証期間の終了日を指定します
3-2. トレンドとシグナルの表示
Show trend : チェックを入れると、バーの背景色が、トレンドが上昇のときは薄い赤で、下落のときは薄い青で表示されます
Show signal : チェックを入れると、エントリーと手仕舞いのシグナルを表示します(シグナルの出た翌日の寄り付きに売買をするので表示に1日のずれがあります)
3-3. 資金管理用の設定
Funds : トレード用の資金(円)
Risk rate : 許容損失を資金の何%にするかで指定します
「プロパティタブ」で設定する値は、このストラテジーでは有効ではありません。
4. バックテストの結果(例)
作者がバックテストを実施した結果をお知らせします。
対象銘柄:日経225構成銘柄すべて
対象期間:2000年1月4日~2024年12月30日
データ件数:12,886
勝率:33.45%
純利益:82,132,380
ペイオフレシオ:2.450
期待値:6,373.8
リスク資金比率:1.0%
破産確率:0.00%

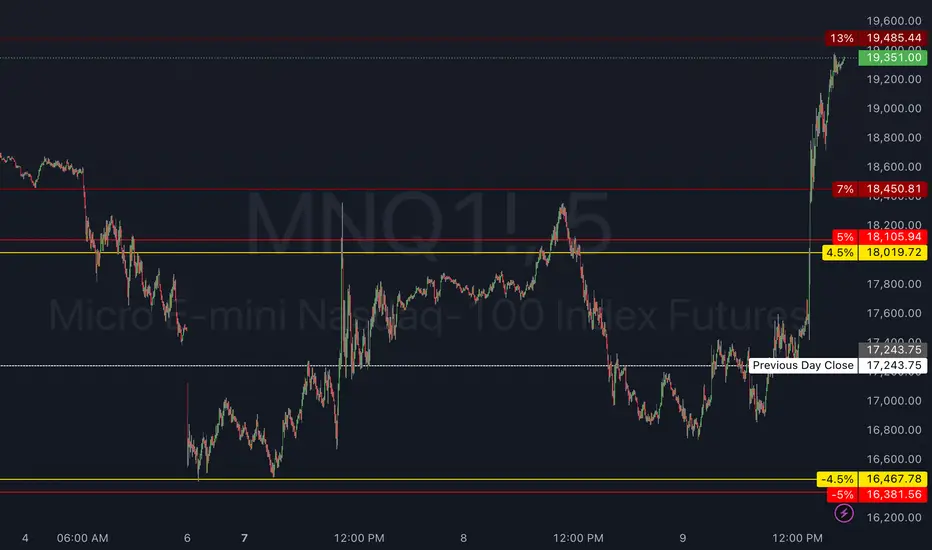
Circuit Breaker LevelsThis indicator will show the Previous Day's Close and +/- 4.5% (Warning Level for Prop Firms), 5% (Prop Firm Trading Halted), 7% (First CME Circuit Breaker), 13% (Second CME Circuit Breaker), and 20% (Final CME Circuit Breaker All Trading Halted for the Day).
Institutional Quantum Momentum Impulse [BullByte]## Overview
The Institutional Quantum Momentum Impulse (IQMI) is a sophisticated momentum oscillator designed to detect institutional-level trend strength, volatility conditions, and market regime shifts. It combines multiple advanced technical concepts, including:
- Quantum Momentum Engine (Hilbert Transform + MACD Divergence + Stochastic Energy)
- Fractal Volatility Scoring (GARCH + Keltner-based volatility)
- Dynamic Adaptive Bands (Self-adjusting thresholds based on efficiency)
- Market Phase Detection (Volume + Momentum alignment)
- Liquidity & Cumulative Delta Analysis
The indicator provides a Z-score normalized momentum reading, making it ideal for mean-reversion and trend-following strategies.
---
## Key Features
### 1. Quantum Momentum Core
- Combines Hilbert Transform, MACD divergence, and Stochastic Energy into a single composite momentum score.
- Normalized using a Z-score for statistical significance.
- Smoothed with EMA/WMA/HMA for cleaner signals.
### 2. Dynamic Adaptive Bands
- Upper/Lower bands adjust based on volatility and efficiency ratio .
- Acts as overbought/oversold zones when momentum reaches extremes.
### 3. Market Phase Detection
- Identifies bullish , bearish , or neutral phases using:
- Volume-Weighted MA alignment
- Fractal momentum extremes
### 4. Volatility & Liquidity Filters
- Fractal Volatility Score (0-100 scale) shows market instability.
- Liquidity Check ensures trades are taken in favorable spread conditions.
### 5. Dashboard & Visuals
- Real-time dashboard with key metrics:
- Momentum strength, volatility, efficiency, cumulative delta, and market regime.
- Gradient coloring for intuitive momentum visualization .
---
## Best Trade Setups
### 1. Trend-Following Entries
- Signal :
- QM crosses above zero + Market Phase = Bullish + ADX > 25
- Cumulative Delta rising (buying pressure)
- Confirmation :
- Efficiency > 0.5 (strong momentum quality)
- Liquidity = High (tight spreads)
### 2. Mean-Reversion Entries
- Signal :
- QM touches upper band + Volatility expanding
- Market Regime = Ranging (ADX < 25)
- Confirmation :
- Efficiency < 0.3 (weak momentum follow-through)
- Cumulative Delta divergence (price high but delta declining)
### 3. Breakout Confirmation
- Signal :
- QM holds above zero after a pullback
- Market Phase shifts to Bullish/Bearish
- Confirmation :
- Volatility rising (expansion phase)
- Liquidity remains high
---
## Recommended Timeframes
- Intraday (5M - 1H): Works well for scalping & swing trades.
- Swing Trading (4H - Daily): Best for trend-following setups.
- Position Trading (Weekly+): Useful for macro trend confirmation.
---
## Input Customization
- Resonance Factor (1.0 - 3.618 ): Adjusts MACD divergence sensitivity.
- Entropy Filter (0.382/0.50/0.618) : Controls stochastic damping.
- Smoothing Type (EMA/WMA/HMA) : Changes momentum responsiveness.
- Normalization Period : Adjusts Z-score lookback.
---
The IQMI is a professional-grade momentum indicator that combines institutional-level concepts into a single, easy-to-read oscillator. It works across all markets (stocks, forex, crypto) and is ideal for traders who want:
✅ Early trend detection
✅ Volatility-adjusted signals
✅ Institutional liquidity insights
✅ Clear dashboard for quick analysis
Try it on TradingView and enhance your trading edge! 🚀
Happy Trading!
- BullByte

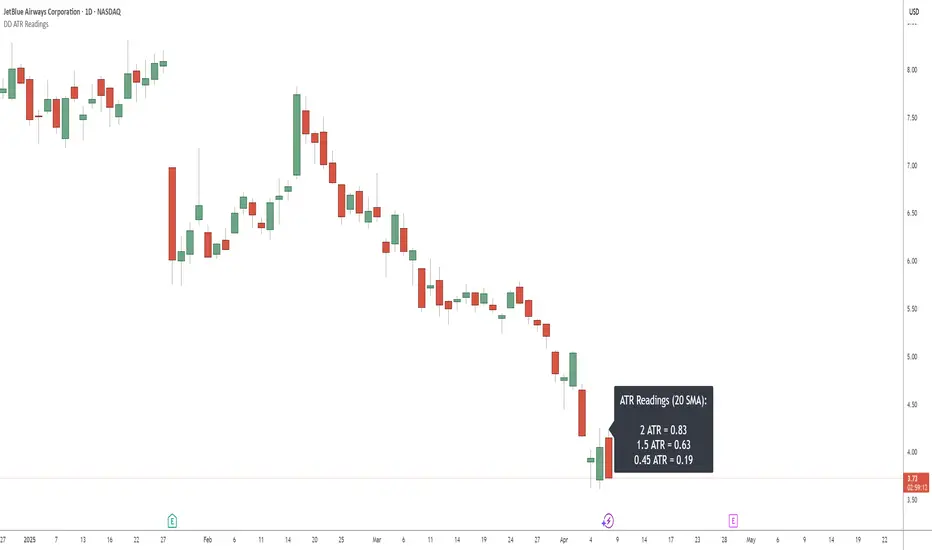
DD ATR ReadingsThe DD ATR Readings indicator displays customizable Average True Range (ATR) multiplier values directly on your chart. Unlike standard ATR indicators that only show a line, this indicator calculates and displays the exact numeric values for three different ATR multipliers, giving you precise volatility measurements for your trading decisions.
It's specifically created for people taking the "Deep Dip Buy" stock trading course, and attempts to provide a ready-to-go solution to allow easy position size calculations as per the course, with the required ATR values visible at a glance.
The default values of 2.0, 1.5 and 0.45 are the same values used by the course instructor in his charting software, but you can change these values to any multiplier you choose.
Any input from students or the instructor is welcome to improve this indicator so it offers more value to those looking to learn how to trade.
Features
Displays three customizable ATR multiplier values (default: 2.0, 1.5, and 0.45 from the course)
Uses either SMA or EMA for ATR calculation (20-period default)
Fully customizable label appearance (position, color, size)
Real-time value updates as you move through the chart
Clean, unobtrusive display that doesn't clutter your chart with additional lines
Customization Options
ATR Length: Number of bars used in the ATR calculation (default: 20)
ATR Multipliers: Three customizable multiplier values
SMA/EMA: Choose your preferred moving average type for ATR calculation
Label Style: Multiple positioning options for the text display
Colors and Size: Fully customizable appearance
Sigma (Standard Deviation)Calculates the standard deviation (sigma) of a stock in percentages. You can edit the length as per your need.

BB Breakout + Momentum Squeeze [Strategy]This Strategy is Based on 3 free indicators
- Bollinger Bands Breakout Oscillator: Link
- TTM Squeeze Pro: Link
- Rolling ATR Bands: Link
Bollinger Bands Breakout Oscillator - This tool shows how strong a market trend is by measuring how often prices move outside their normal Bollinger bands range. It helps you see whether prices are strongly moving in one direction or just moving sideways. By looking at how much and how frequently prices push beyond their typical boundaries, you can identify which direction the market is heading over your selected time period.
TM Squeeze Pro - This is a custom version of the TTM Squeeze indicator.
It's designed to help traders spot consolidation phases in the market (when price is coiling or "squeezing") and to catch breakouts early when volatility returns. The logic is based on the relationship between Bollinger Bands and Keltner Channels, combined with a momentum oscillator to show direction and strength.
Rolling ATR Bands - This indicator combines volatility bands (ATR) with momentum and trend signals to show where the market might be breaking out, retesting, or trending. It's highly visual and helpful for traders looking to time entries/exits during trending or volatile moves.
Logic Of the Strategy:
We are going to use the Bollinger Bands Breakout to determine the direction of the market. Than check the Volatility of the price by looking at the TTM Squeeze indicator. And use the ATR Bands to determine dynamic Stop Losses and based on the calculate the Take Profit targets and quantity for each position dynamically.
For the Long Setup:
1. We need to see the that Bull Power (Green line of the Bollinger Bands Breakout Oscilator) is crossing the level of 50.
2. Check the presence of volatility (Green dot based on the TTM Squeeze indicator)
For the Short Setup:
1. We need to see the that Bear Power (Red line of the Bollinger Bands Breakout Oscilator) is crossing the level of 50.
2. Check the presence of volatility (Green dot based on the TTM Squeeze indicator)
Stop Loss is determined by the Lower ATR Band (for the Long entry) and Upper ATR Band (For the Short entry)
Take Profit is 1:1.5 risk reward ration, which means if the Stop loss is 1% the TP target will be 1.5%
Move stop Loss to Breakeven: If the price will go in the direction of the trade for at least half of the Risk Reward target then the stop will automatically be adjusted to the entry price. For Example: the Stop Loss is 1%, the price has move at least 0.5% in the direction of your trade and that will move the Stop Loss level to the Entry point.
You can Adjust the parameters for each indicator used in that script and also adjust the Risk and Money management block to see how the PnL will change.

(US) Historical Trade WarsHistorical U.S. Trade Wars Indicator
Overview
This indicator visualizes major U.S. trade wars and disputes throughout modern economic history, from the McKinley Tariff of 1890 to recent U.S.-China tensions. This U.S.-focused timeline is perfect for macro traders, economic historians, and anyone looking to understand how America's trade conflicts correlate with market movements.
Features
Comprehensive U.S. Timeline: Covers 130+ years of U.S.-centered trade disputes with historically accurate dates.
Color-Coded Events:
🔴 Red: Marks the beginning of a U.S. trade war or major dispute.
🟡 Yellow: Highlights significant events within a trade conflict.
🟢 Green: Shows resolutions or ends of trade disputes.
Global Partners/Rivals: Tracks U.S. trade relations with China, Japan, EU, Canada, Mexico, Brazil, Argentina, and others.
Country Flags: Uses emoji flags for easy visual identification of nations in trade relations with the U.S.
Major Trade Wars Covered:
McKinley Tariff (1890-1894)
Smoot-Hawley Tariff Act (1930-1934)
U.S.-Europe Chicken War (1962-1974)
Multifiber Arrangement Quotas (1974-2005)
Japan-U.S. Trade Disputes (1981-1989)
NAFTA and Softwood Lumber Disputes
Clinton and Bush-Era Steel Tariffs
Obama-Era China Tire Tariffs
Rare Earth Minerals Dispute (2012-2014)
Solar Panel Dispute (2012-2015)
TPP and TTIP Negotiations
U.S.-China Trade War (2018-present)
Airbus-Boeing Dispute
Usage
Analyze how markets historically responded to trade war initiations and resolutions.
Identify patterns in market behavior during periods of trade tensions.
Use as an overlay with price action to examine correlations.
Perfect companion for macro analysis on daily, weekly, or monthly charts.
About
This indicator is designed as a historical reference tool for traders and economic analysts focusing on U.S. trade policy and its global impact. The dates and events have been thoroughly researched for accuracy. Each label includes emojis to indicate the U.S. and its trade partners/rivals, making it easy to track America's evolving trade relationships across time.
Note: This indicator works best on larger timeframes (daily, weekly, monthly) due to the historical span covered.

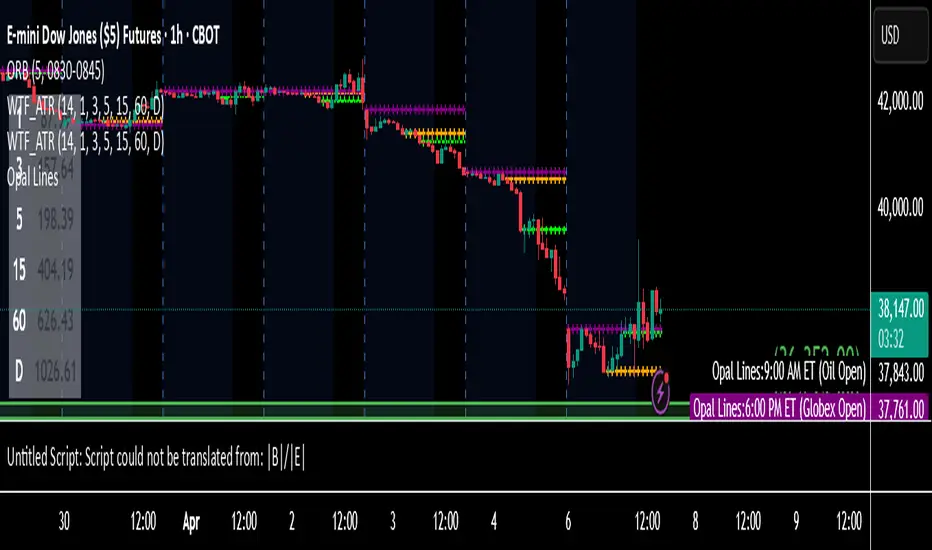
Multi-Timeframe ATR MonitorThis indicator displays a table of ATR values across multiple user-defined timeframes (1m, 3m, 5m, 15m, 60m, daily by default) and tracks the session range since 18:00. Customize the timeframes and ATR length via inputs.
CME Price Limits (Futures Prop Firm Rule)This indicator shows the CME Price Limit, combined with a safety distance that is used by several futures prop firms. Trading in the highlighted area means a rule violation for many Futures prop firm accounts.
The levels are calculated from the "Settlement as close" closing price of the previous daily candle.

JPMorgan Collar LevelsThis indicator visualizes the current JPMorgan Hedging Collar strategy commonly used by institutional funds like JHEQX. It plots three key levels:
– Short Call strike (upper bound)
– Long Put strike (protection level)
– Short Put strike (cost reduction)
The area between the long put and short call is shaded to represent the active hedging zone. This setup is updated quarterly and can influence SPX market behavior near expiration dates.
Inputs are customizable to reflect the latest collar configuration. Useful for traders tracking institutional hedging flows or analyzing market structure near key option expirations.

RSI-Volume Momentum Signal ScoreRSI-Volume Momentum Signal Score
Description
The RSI-Volume Momentum Signal Score is a predictive technical indicator designed to identify bullish and bearish momentum shifts by combining volume-based momentum with the Relative Strength Index (RSI). It generates a Signal Score derived from:
• The divergence between short-term and long-term volume (Volume Oscillator), and
• RSI positioning relative to a user-defined threshold.
This hybrid approach helps traders detect early signs of price movement based on volume surges and overbought/oversold conditions.
The Signal Score is computed as follows:
Signal Score = Volume Momentum x RSI Divergence Factor
Volume Momentum = tanh ((Volume Oscillator value (vo) – Volume Threshold)/Scaling Factor)
RSI Divergence Factor = ((RSI Threshold – RSI Period)/Scaling Factor)
Or,
Signal Score = tanh((vo - voThreshold) / scalingFactor) * ((rsiThreshold - rsi) / scalingFactor)
The logic of this formula are as follows:
• If Volume Oscillator >= Volume Threshold and RSI <= RSI Threshold: Bullish Signal (+1 x Scaling Factor)
• If Volume Oscillator >= Volume Threshold and RSI >= (100 – RSI Threshold): Bearish Signal (-1 x Scaling Factor)
• Otherwise: Neutral (0)
The tanh function provides the normalization process. It ensures that the final signal score is bounded between -1 and 1, increases sensitivity to early changes in volume patterns based on RSI conditions, and prevent sudden jumps in signals ensuring smooth and continuous signal line.
Input Fields
The input fields allow users to customize the behavior of the indicator based on their trading strategy:
Short-Term Volume MA
- Default: `2`
- Description: The period for the short-term moving average of volume.
- Purpose: Captures short-term volume trends.
Long-Term Volume MA)
- Default: `10`
- Description: The period for the long-term moving average of volume.
- Purpose: Captures long-term volume trends for comparison with the short-term trend.
RSI Period)
- Default: `3`
- Description: The period for calculating the RSI.
- Purpose: Measures the relative strength of price movements over the specified period.
Volume Oscillator Threshold
- Default: `70`
- Description: The threshold for the Volume Oscillator to determine significant volume momentum.
- Purpose: Filters out weak volume signals.
RSI Threshold
- Default: `25`
- Description: The RSI level used to identify overbought or oversold conditions.
- Purpose: Helps detect potential reversals in price momentum.
Signal Scaling Factor
- Default: `10`
- Description: A multiplier for the signal score.
- Purpose: Adjusts the magnitude of the signal score for better visualization.
How To Use It for Trading:
Upcoming Bullish Signal: Signal line turns from Gray to Green or from Green to Gray
Upcoming Bearish Signal: Signal line turns from Gray to Red or from Red to Gray
Note: The price that corresponds to the transition of Signal line from Gray to Green or Red and vise versa is the signal price for upcoming bullish or bearish signal.
The signal score dynamically adjusts based on volume and RSI thresholds, making it adaptable to various market conditions, and this is what makes the indicator unique from other traditional indicators.
Unique Features
Unlike traditional indicators, this indicator combines two different dimensions—volume trends and RSI divergence—for more comprehensive signal generation. The use of tanh() to scale and smooth the signal is a mathematically elegant way to manage signal noise and highlight genuine trends. Traders can tune the scaling factor and thresholds to adapt the indicator for scalping, swing trading, or longer-term investing.

Follow Line Strategy Version 2.5 (React HTF)Follow Line Strategy v2.5 (React HTF) - TradingView Script Usage
This strategy utilizes a "Follow Line" concept based on Bollinger Bands and ATR to identify potential trading opportunities. It includes advanced features like optional working hours filtering, higher timeframe (HTF) trend confirmation, and improved trend-following entry/exit logic. Version 2.5 introduces reactivity to HTF trend changes for more adaptive trading.
Key Features:
Follow Line: The core of the strategy. It dynamically adjusts based on price breakouts beyond Bollinger Bands, using either the low/high or ATR-adjusted levels.
Bollinger Bands: Uses a standard Bollinger Bands setup to identify overbought/oversold conditions.
ATR Filter: Optionally uses the Average True Range (ATR) to adjust the Follow Line offset, providing a more dynamic and volatility-adjusted entry point.
Optional Trading Session Filter: Allows you to restrict trading to specific hours of the day.
Higher Timeframe (HTF) Confirmation: A significant feature that allows you to confirm trade signals with the trend on a higher timeframe. This can help to filter out false signals and improve the overall win rate.
HTF Selection Method: Choose between Auto and Manual HTF selection:
Auto: The script automatically determines the appropriate HTF based on the current chart timeframe (e.g., 1min -> 15min, 5min -> 4h, 1h -> 1D, Daily -> Monthly).
Manual: Allows you to select a specific HTF using the Manual Higher Timeframe input.
Trend-Following Entries/Exits: The strategy aims to enter trades in the direction of the established trend, using the Follow Line to define the trend.
Reactive HTF Trend Changes: v2.5 exits positions not only based on the trade timeframe (TTF) trend changing, but also when the higher timeframe trend reverses against the position. This makes the strategy more responsive to larger market movements.
Alerts: Provides buy and sell alerts for convenient trading signal notifications.
Visualizations: Plots the Follow Line for both the trade timeframe and the higher timeframe (optional), making it easy to understand the strategy's logic.
How to Use:
Add to Chart: Add the "Follow Line Strategy Version 2.5 (React HTF)" script to your TradingView chart.
Configure Settings: Customize the strategy's settings to match your trading style and preferences. Here's a breakdown of the key settings:
Indicator Settings:
ATR Period: The period used to calculate the ATR. A smaller period is more sensitive to recent price changes.
Bollinger Bands Period: The period used for the Bollinger Bands calculation. A longer period results in smoother bands.
Bollinger Bands Deviation: The number of standard deviations from the moving average that the Bollinger Bands are plotted. Higher deviations create wider bands.
Use ATR for Follow Line Offset?: Enable to use ATR to calculate the Follow Line offset. Disable to use the simple high/low.
Show Trade Signals on Chart?: Enable to show BUY/SELL labels on the chart.
Time Filter:
Use Trading Session Filter?: Enable to restrict trading to specific hours of the day.
Trading Session: The trading session to use (e.g., 0930-1600 for regular US stock market hours). Use 0000-2400 for all hours.
Higher Timeframe Confirmation:
Enable HTF Confirmation?: Enable to use the HTF trend to filter trade signals. If enabled, only trades in the direction of the HTF trend will be taken.
HTF Selection Method: Choose between "Auto" and "Manual" HTF selection.
Manual Higher Timeframe: If "Manual" is selected, choose the specific HTF (e.g., 240 for 4 hours, D for daily).
Show HTF Follow Line?: Enable to plot the HTF Follow Line on the chart.
Understanding the Signals:
Buy Signal: The price breaks above the upper Bollinger Band, and the HTF (if enabled) confirms the uptrend.
Sell Signal: The price breaks below the lower Bollinger Band, and the HTF (if enabled) confirms the downtrend.
Exit Long: The trade timeframe trend changes to downtrend or the higher timeframe trend changes to downtrend.
Exit Short: The trade timeframe trend changes to uptrend or the higher timeframe trend changes to uptrend.
Alerts:
The script includes alert conditions for buy and sell signals. To set up alerts, click the "Alerts" button in TradingView and select the desired alert condition from the script. The alert message provides the ticker and interval.
Backtesting and Optimization:
Use TradingView's Strategy Tester to backtest the strategy on different assets and timeframes.
Experiment with different settings to optimize the strategy for your specific trading style and risk tolerance. Pay close attention to the ATR Period, Bollinger Bands settings, and the HTF confirmation options.
Tips and Considerations:
HTF Confirmation: The HTF confirmation can significantly improve the strategy's performance by filtering out false signals. However, it can also reduce the number of trades.
Risk Management: Always use proper risk management techniques, such as stop-loss orders and position sizing, when trading any strategy.
Market Conditions: The strategy may perform differently in different market conditions. It's important to backtest and optimize the strategy for the specific markets you are trading.
Customization: Feel free to modify the script to suit your specific needs. For example, you could add additional filters or entry/exit conditions.
Pyramiding: The pyramiding = 0 setting prevents multiple entries in the same direction, ensuring the strategy doesn't compound losses. You can adjust this value if you prefer to pyramid into winning positions, but be cautious.
Lookahead: The lookahead = barmerge.lookahead_off setting ensures that the HTF data is calculated based on the current bar's closed data, preventing potential future peeking bias.
Trend Determination: The logic for determining the HTF trend and reacting to changes is critical. Carefully review the f_calculateHTFData function and the conditions for exiting positions to ensure you understand how the strategy responds to different market scenarios.
Disclaimer:
This script is for informational and educational purposes only. It is not financial advice, and you should not trade based solely on the signals generated by this script. Always do your own research and consult with a qualified financial advisor before making any trading decisions. The author is not responsible for any losses incurred as a result of using this script.

RSI + ADX + ATR Combo Indicator: RSI + ADX + ATR Combo Filter
This indicator is a confluence filter tool that combines RSI, ADX, and ATR into a single, easy-to-read chart overlay. It is designed to help traders identify low-volatility, non-trending zones with balanced momentum—ideal for strategies that rely on breakouts or reversals.
🔍 Core Components:
RSI (Relative Strength Index)
Standard RSI with custom upper and lower bounds (default: 60 and 40).
Filters out extreme overbought/oversold regions and focuses on price consolidation zones.
ADX (Average Directional Index)
Measures trend strength.
When ADX is below a custom threshold (default: 20), it indicates a weak or range-bound trend.
ATR (Average True Range)
Represents volatility.
Low ATR values (default threshold: 2.5) are used to filter out high-volatility environments, helping refine entries.
🟣 Signal Logic:
A signal is highlighted with a background color when all three conditions are met:
RSI is between lower and upper bounds (e.g., 40 < RSI < 60) ✅
ADX is below the trend threshold (e.g., ADX < 20) ✅
ATR is below the volatility threshold (e.g., ATR < 2.5) ✅
These combined conditions suggest a low-volatility, low-trend strength, and balanced momentum zone—perfect for anticipating breakouts or strong directional moves.

Ultimate MA & PSAR [TARUN]Overview
This indicator combines a customizable Moving Average (MA) and Parabolic SAR (PSAR) to generate precise long and short trade signals. A dashboard displays real-time trade conditions, including signal direction, entry price, stop loss, and PnL tracking.
Key Features
✅ Customizable MA Type & Period – Choose between SMA or EMA with adjustable length.
✅ Adaptive PSAR Settings – Modify start, increment, and max step values to fine-tune stop levels.
✅ Trade Signal Logic – Identifies potential buy (long) and sell (short) opportunities based on:
Price action relative to MA
MA trend direction (rising or falling)
PSAR confirmation
✅ Dynamic Stop Loss Calculation – Uses lowest low/highest high over a specified period for stop loss placement.
✅ Trade State & Reversal Handling – Manages active trades, pending signals, and stop loss exits dynamically.
✅ PnL & Dashboard Table – Displays real-time signal status, entry price, stop loss, and profit/loss (PnL) in an easy-to-read format.
How It Works
1.Buy (Long) Condition:
MA is rising
Price is above the MA
PSAR is below price
2.Sell (Short) Condition:
MA is falling
Price is below the MA
PSAR is above price
3.Stop Loss Handling:
For long trades → stop loss is set at the lowest low of the last X candles
For short trades → stop loss is set at the highest high of the last X candles
4.Trade Execution & PnL Calculation:
If a valid long/short setup is detected, a pending signal is placed.
On the next bullish (for long) or bearish (for short) candle, the trade is confirmed.
Real-time PnL updates help track trade performance.
Customization Options
🔹 Moving Average: SMA or EMA, adjustable period
🔹 PSAR Settings: Start, Increment, Maximum step values
🔹 Stop Loss Lookback: Choose how many candles to consider for stop loss placement
🔹 Dashboard Positioning: Select preferred display location (top/bottom, left/right)
🔹 Trade Signal Selection: Enable/Disable Long and Short signals individually
How to Use
Add the indicator to your chart.
Customize the MA & PSAR settings according to your trading strategy.
Follow the dashboard signals for trade setups.
Use stop loss levels to manage risk effectively.
Disclaimer
⚠️ This indicator is for educational purposes only and does not constitute financial advice. Always perform proper risk management and backtesting before using it in live trading.

ATR Amplitude RatioATR Amplitude Ratio
The ATR Amplitude Ratio indicator measures price volatility by comparing the current candle's amplitude (high-low range) to the Average True Range (ATR). This helps traders identify when price movement exceeds typical volatility thresholds, potentially signaling unusual market activity.
Key Features:
Displays the ratio between current candle height and ATR as color-coded histogram bars
Customizable ATR calculation with multiple smoothing methods (SMA, EMA, RMA, WMA)
Visual reference lines at 1x, 2x, 3x, 4x, and 5x ATR levels
Dynamic color coding based on volatility intensity (5 customizable threshold colors)
Real-time display of current ratio and ATR values
How to Use:
Volatility Assessment: Quickly identify if price action is within normal volatility ranges or exhibiting unusual movement
Breakout Confirmation: Higher ratios can confirm genuine breakouts versus false moves
Entry/Exit Timing: Consider entries when volatility returns to normal ranges after spikes
Risk Management: Adjust position sizing based on current volatility ratios
Settings:
ATR Length: Determines the lookback period for ATR calculation (default: 14)
ATR Smoothing Type: Choose from SMA, EMA, RMA, or WMA methods
Color Thresholds: Customize colors for different volatility ranges
This indicator helps traders make more informed decisions by providing context about current price action relative to recent historical volatility.

Scalping 15min: EMA + MACD + RSI + ATR-based SL/TP📈 Strategy: 15-Minute Scalping — EMA + MACD + RSI + ATR-based SL/TP
This scalping strategy is designed for 15-minute charts and combines trend-following and momentum confirmation with dynamic stop loss and take profit levels based on volatility.
🔧 Indicators Used:
EMA 50 — identifies the main trend
MACD Histogram — confirms momentum direction
RSI (14) — filters overbought/oversold conditions
ATR (14) — dynamically sets SL and TP based on market volatility
📊 Entry Conditions:
Long Entry:
Price is above EMA 50
MACD histogram is positive
RSI is above 50 but below 70
Short Entry:
Price is below EMA 50
MACD histogram is negative
RSI is below 50 but above 30
🛑 Risk Management:
Stop Loss: 1×ATR (user-configurable)
Take Profit: 2×ATR (user-configurable)
These values can be adjusted in the script inputs depending on your risk/reward preference or market conditions.
⚠️ Notes:
Strategy is optimized for scalping fast-moving pairs (e.g. crypto, forex).
Works best in trending markets.
Use backtesting and forward testing before live trading.

14 EMA & RSI Combo with First Buy/SellEMA14 & RSI stratergy - Used as a indication for BUY and Sell based on EMA 14 and RSI. Chk for higher timeframe trend and stick to the entries that are following the trend

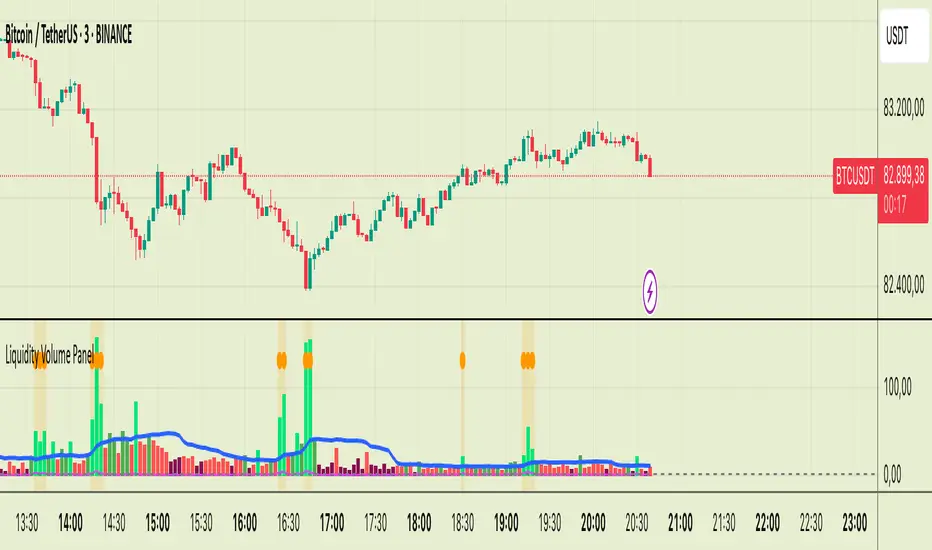
Liquidity Volume Panel Liquidity Volume Panel – Precision Tool for Scalpers & Intraday Traders
This panel is designed to help traders quickly identify volume-driven moves, liquidity events, and fair-value zones. It combines classic volume analysis with enhanced tools like RVOL and VWAP deviation bands, making it ideal for scalping, momentum trading, and intraday strategies.
🔍 Included Features:
✅ Relative Volume (RVOL) Indicator
Displays current volume in relation to its 20-period average – excellent for spotting low-activity zones or high-pressure breakouts.
✅ Dynamic Volume Coloring & Spike Detection
Color-coded volume logic highlights normal, strong, and extremely high volume, with visual markers for volume spikes (>200% of average).
✅ VWAP with ±1σ & ±2σ Bands
Industry-standard deviation bands show overbought/oversold conditions and dynamic support/resistance based on volume-weighted pricing.
✅ Background Highlighting
Subtle orange background alerts you when volume surges beyond extreme levels – making liquidity clusters instantly recognizable.
Usage:
Use this panel as a decision-making tool for entries, reversals, or breakouts – especially in fast-moving markets.
Best used on lower timeframes for precision scalping.
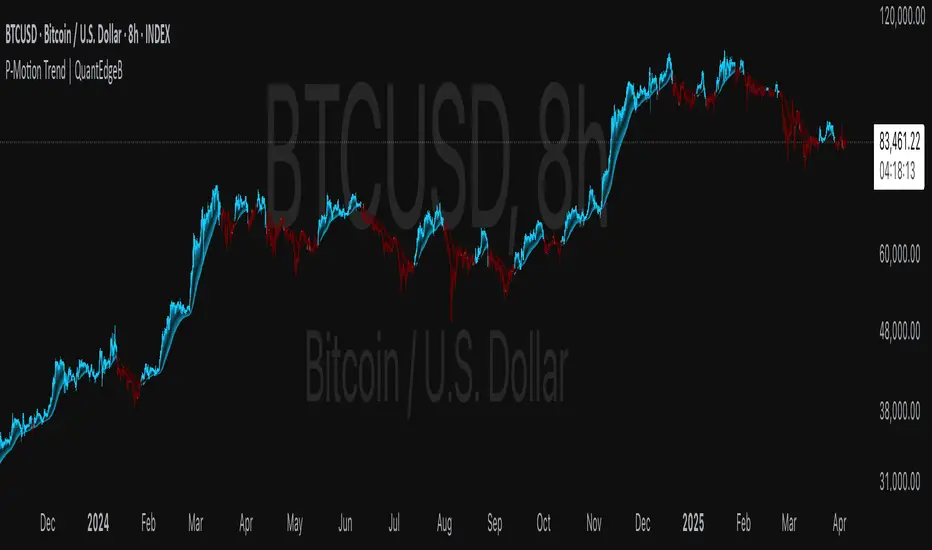
P-Motion Trend | QuantEdgeB⚡ Introducing P-Motion Trend (PMT) by QuantEdgeB
🧭 Overview
P-Motion Trend is a refined trend-following framework built for modern market dynamics. It combines DEMA filtering, percentile-based smoothing, and volatility-adjusted envelopes to create a clear, noise-filtered trend map directly on your chart.
This overlay indicator is engineered to detect breakout zones, trend continuation setups, and market regime shifts with maximum clarity and minimum lag.
Whether you're swing trading crypto, managing intraday FX moves, or positioning in equities — P-Motion Trend adapts, aligns, and simplifies.
🧠 Core Logic
1️⃣ DEMA Filtering Core
The input source is processed through a Double EMA to reduce lag while retaining trend sensitivity.
2️⃣ Percentile Median Smoothing
To eliminate short-lived spikes, the DEMA output is passed through a percentile median rank — effectively smoothing without distortion.
3️⃣ Volatility Envelope with EMA Basis
An exponential moving average (EMA) is applied to the smoothed median, and standard deviation bands are wrapped around it:
• ✅ Long Signal → Price closes above the upper band
• ❌ Short Signal → Price closes below the lower band
• ➖ Inside Band = Neutral
These bands expand/contract with market volatility — protecting against false breakouts in quiet regimes and adapting quickly to strong moves.
📊 Visual & Analytical Layers
• 🎯 Bar Coloring: Color-coded candles highlight trend state at a glance.
• 📈 EMA Ribbon Overlay: A dynamic ribbon of EMAs helps confirm internal momentum and detect transitions (trend decay or acceleration).
• 🔹Gradient Fill Zones: Visually communicates squeeze vs. expansion phases based on band width.
⚙️ Custom Settings
• EMA Length – Defines the core trend path (default: 21)
• SD Length – Controls volatility band smoothing (default: 30)
• SD Mult Up/Down – Sets thresholds for breakout confirmation (default: 1.5)
• DEMA Filter Source – Raw input used for trend processing
• DEMA Filter Length – Sets DEMA smoothing (default: 7)
• Median Length – Percentile-based smoothing window (default: 2)
📌 Use Cases
✅ Trend Confirmation
Use PMT to confirm whether the price action is structurally valid for trend continuation. A close above the upper band signals entry alignment.
🛡️ Reversal Guard
Avoid early reversion entries. PMT keeps you in-trend until price truly breaks structure.
🔍 Momentum Visualizer
With multiple EMA bands, the indicator also functions as a momentum envelope to spot divergence between price and smoothed trend flow.
🔚 Conclusion
P-Motion Trend is a hybrid volatility + trend system built with precision smoothing, dynamic filtering, and clean visual output. It balances agility with stability, helping you:
• Filter out price noise
• Enter with structure
• Stay in trades longer
• Exit with confidence
🧩 Summary of Benefits
• 🔹 Lag-minimized trend structure via DEMA core
• 🔹 Real-time volatility band adaptation
• 🔹 Gradient visual feedback on compression/expansion
• 🔹 EMA ribbon assists in phase detection
• 🔹 Suitable for all markets & timeframes
📌 Disclaimer: Past performance is not indicative of future results. No trading strategy can guarantee success in financial markets.
📌 Strategic Advice: Always backtest, optimize, and align parameters with your trading objectives and risk tolerance before live trading.
DEGA RMA | QuantEdgeB🧠 Introducing DEGA RMA (DGR ) by QuantEdgeB
🛠️ Overview
DEGA RMA (DGR) is a precision-engineered trend-following system that merges DEMA, Gaussian kernel smoothing, and ATR-based envelopes into a single, seamless overlay indicator. Its mission: to filter out market noise while accurately capturing directional bias using a layered volatility-sensitive trend core.
DGR excels at identifying valid breakouts, sustained momentum conditions, and trend-defining price behavior without falling into the trap of frequent signal reversals.
🔍 How It Works
1️⃣ Double Exponential Moving Average (DEMA)
The system begins by applying a DEMA to the selected price source. DEMA responds faster than a traditional EMA, making it ideal for capturing transitions in momentum.
2️⃣ Gaussian Filtering
A custom Gaussian kernel is used to smooth the DEMA signal. The Gaussian function applies symmetrical weights, centered around the most recent bar, effectively softening sharp price oscillations while preserving the underlying trend structure.
3️⃣ Recursive Moving Average (RMA) Core
The filtered Gaussian output is then processed through an RMA to generate a stable dynamic baseline. This baseline becomes the foundation for the final trend logic.
4️⃣ ATR-Scaled Breakout Zones
Upper and lower trend envelopes are calculated using a custom ATR filter built on DEMA-smoothed volatility.
• ✅ Long Signal when price closes above the upper envelope
• ❌ Short Signal when price closes below the lower envelope
• ➖ Neutral when inside the band (no signal noise)
✨ Key Features
🔹 Multi-Layer Trend Model
DEMA → Gaussian → RMA creates a signal structure that is both responsive and robust.
🔹 Volatility-Aware Entry System
Adaptive ATR bands adjust in real-time, expanding during high volatility and contracting during calm periods.
🔹 Noise-Reducing Gaussian Kernel
Sigma-adjustable kernel ensures signal smoothness without introducing excessive lag.
🔹 Clean Visual System
Candle coloring and band fills make trend state easy to read and act on at a glance.
⚙️ Custom Settings
• DEMA Source – Input source for trend core (default: close)
• DEMA Length – Length for initial smoothing (default: 30)
• Gaussian Filter Length – Determines smoothing depth (default: 4)
• Gaussian Sigma – Sharpness of Gaussian curve (default: 2.0)
• RMA Length – Core baseline smoothing (default: 12)
• ATR Length – Volatility detection period (default: 40)
• ATR Mult Up/Down – Controls the upper/lower threshold range for signals (default: 1.7)
📌 How to Use
1️⃣ Trend-Following Mode
• Go Long when price closes above the upper ATR band
• Go Short when price closes below the lower ATR band
• Remain neutral otherwise
2️⃣ Breakout Confirmation Tool
DGR’s ATR-based zone logic helps validate price breakouts and filter out false signals that occur inside compressed ranges.
3️⃣ Volatility Monitoring
Watch the ATR envelope width — a narrowing band often precedes expansion and potential directional shifts.
📌 Conclusion
DEGA RMA (DGR) is a thoughtfully constructed trend-following framework that goes beyond basic moving averages. Its Gaussian smoothing, adaptive ATR thresholds, and layered filtering logic provide a versatile solution for traders looking for cleaner signals, less noise, and real-time trend awareness.
Whether you're trading crypto, forex, or equities — DGR adapts to volatility while keeping your chart clean and actionable.
🔹 Summary
• ✅ Advanced Smoothing → DEMA + Gaussian + RMA = ultra-smooth trend core
• ✅ Volatility-Adjusted Zones → ATR envelope scaling removes whipsaws
• ✅ Fully Customizable → Tailor to any asset or timeframe
• ✅ Quant-Inspired Structure → Built for clarity, consistency, and confidence
📌 Disclaimer: Past performance is not indicative of future results. No trading strategy can guarantee success in financial markets.
📌 Strategic Advice: Always backtest, optimize, and align parameters with your trading objectives and risk tolerance before live trading.

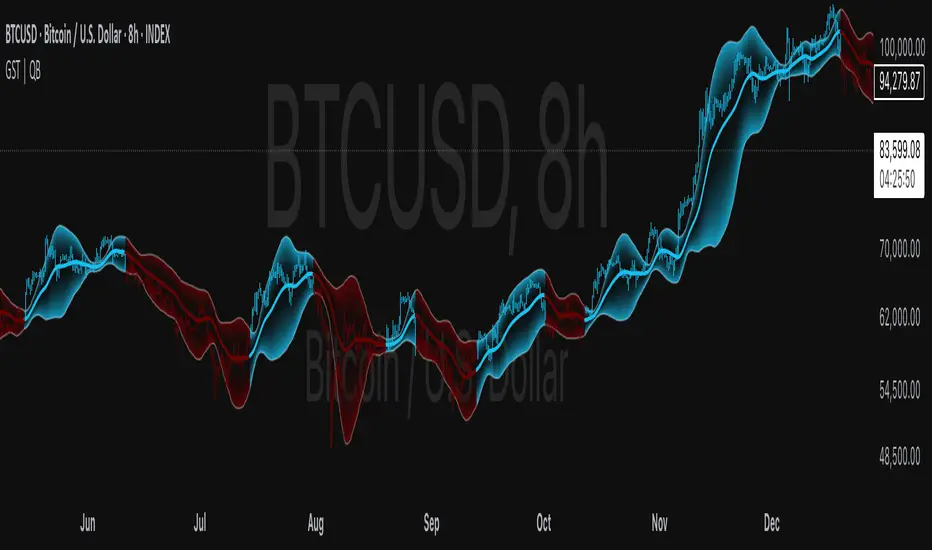
Gaussian Smooth Trend | QuantEdgeB🧠 Introducing Gaussian Smooth Trend (GST) by QuantEdgeB
🛠️ Overview
Gaussian Smooth Trend (GST) is an advanced volatility-filtered trend-following system that blends multiple smoothing techniques into a single directional bias tool. It is purpose-built to reduce noise, isolate meaningful price shifts, and deliver early trend detection while dynamically adapting to market volatility.
GST leverages the Gaussian filter as its core engine, wrapped in a layered framework of DEMA smoothing, SMMA signal tracking, and standard deviation-based breakout thresholds, producing a powerful toolset for trend confirmation and momentum-based decision-making.
🔍 How It Works
1️⃣ DEMA Smoothing Engine
The indicator begins by calculating a Double Exponential Moving Average (DEMA), which provides a responsive and noise-resistant base input for subsequent filtering.
2️⃣ Gaussian Filter
A custom Gaussian kernel is applied to the DEMA signal, allowing the system to detect smooth momentum shifts while filtering out short-term volatility.
This is especially powerful during low-volume or sideways markets where traditional MAs struggle.
3️⃣ SMMA Layer with Z-Filtering
The filtered Gaussian signal is then passed through a custom Smoothed Moving Average (SMMA). A standard deviation envelope is constructed around this SMMA, dynamically expanding/contracting based on market volatility.
4️⃣ Signal Generation
• ✅ Long Signal: Price closes above Upper SD Band
• ❌ Short Signal: Price closes below Lower SD Band
• ➖ No trade: Price stays within the band → market indecision
✨ Key Features
🔹 Multi-Stage Trend Detection
Combines DEMA → Gaussian Kernel → SMMA → SD Bands for robust signal integrity across market conditions.
🔹 Gaussian Adaptive Filtering
Applies a tunable sigma parameter for the Gaussian kernel, enabling you to fine-tune smoothness vs. responsiveness.
🔹 Volatility-Aware Trend Zones
Price must close outside of dynamic SD envelopes to trigger signals — reducing whipsaws and increasing signal quality.
🔹 Dynamic Color-Coded Visualization
Candle coloring and band fills reflect live trend state, making the chart intuitive and fast to read.
⚙️ Custom Settings
• DEMA Source: Price stream used for smoothing (default: close)
• DEMA Length: Period for initial exponential smoothing (default: 7)
• Gaussian Length / Sigma: Controls smoothing strength of kernel filter
• SMMA Length: Final smoothing layer (default: 12)
• SD Length: Lookback period for standard deviation filtering (default: 30)
• SD Mult Up / Down: Adjusts distance of upper/lower breakout zones (default: 2.5 / 1.8)
• Color Modes: Six distinct color palettes (e.g., Strategy, Warm, Cool)
• Signal Labels: Toggle on/off entry markers ("𝓛𝓸𝓷𝓰", "𝓢𝓱𝓸𝓻𝓽")
📌 Trading Applications
✅ Trend-Following → Enter on confirmed breakouts from Gaussian-smoothed volatility zones
✅ Breakout Validation → Use SD bands to avoid false breakouts during chop
✅ Volatility Compression Monitoring → Narrowing bands often precede large directional moves
✅ Overlay-Based Confirmation → Can complement other QuantEdgeB indicators like K-DMI, BMD, or Z-SMMA
📌 Conclusion
Gaussian Smooth Trend (GST) delivers a precision-built trend model tailored for modern traders who demand both clarity and control. The layered signal architecture, combined with volatility awareness and Gaussian signal enhancement, ensures accurate entries, clean visualizations, and actionable trend structure — all in real-time.
🔹 Summary Highlights
1️⃣ Multi-stage Smoothing — DEMA → Gaussian → SMMA for deep signal integrity
2️⃣ Volatility-Aware Filtering — SD bands prevent false entries
3️⃣ Visual Trend Mapping — Gradient fills + candle coloring for clean charts
4️⃣ Highly Customizable — Adapt to your timeframe, style, and volatility
📌 Disclaimer: Past performance is not indicative of future results. No trading strategy can guarantee success in financial markets.
📌 Strategic Advice: Always backtest, optimize, and align parameters with your trading objectives and risk tolerance before live trading.